HAL Id: cea-01828508
https://hal-cea.archives-ouvertes.fr/cea-01828508
Submitted on 27 Apr 2020
HAL is a multi-disciplinary open access
archive for the deposit and dissemination of
sci-entific research documents, whether they are
pub-lished or not. The documents may come from
teaching and research institutions in France or
abroad, or from public or private research centers.
L’archive ouverte pluridisciplinaire HAL, est
destinée au dépôt et à la diffusion de documents
scientifiques de niveau recherche, publiés ou non,
émanant des établissements d’enseignement et de
recherche français ou étrangers, des laboratoires
publics ou privés.
Optimization of detonation velocity measurements using
a Chirped Fiber Bragg Grating
Yohan Barbarin, A. Lefrancois, G. Zaniolo, V. Chuzeville, L. Jacquet, Sylvain
Magne, J. Luc, A. Osmont
To cite this version:
Yohan Barbarin, A. Lefrancois, G. Zaniolo, V. Chuzeville, L. Jacquet, et al.. Optimization of
det-onation velocity measurements using a Chirped Fiber Bragg Grating. FIBER OPTIC SENSORS
AND APPLICATIONS XII, Apr 2015, Baltimore, United States. pp.94800S, �10.1117/12.2176565�.
�cea-01828508�
HAL Id: cea-02549118
https://hal-cea.archives-ouvertes.fr/cea-02549118
Submitted on 21 Apr 2020
HAL is a multi-disciplinary open access
archive for the deposit and dissemination of
sci-entific research documents, whether they are
pub-lished or not. The documents may come from
teaching and research institutions in France or
abroad, or from public or private research centers.
L’archive ouverte pluridisciplinaire HAL, est
destinée au dépôt et à la diffusion de documents
scientifiques de niveau recherche, publiés ou non,
émanant des établissements d’enseignement et de
recherche français ou étrangers, des laboratoires
publics ou privés.
Optimization of detonation velocity measurements using
a Chirped Fiber Bragg Grating
Yohan Barbarin, A. Lefrançois, G. Zaniolo, V. Chuzeville, L. Jacquet, S.
Magne, J. Luc, A. Osmont
To cite this version:
Yohan Barbarin, A. Lefrançois, G. Zaniolo, V. Chuzeville, L. Jacquet, et al.. Optimization of
det-onation velocity measurements using a Chirped Fiber Bragg Grating. SPIE Sensing Technology +
Applications, Apr 2015, Baltimore, United States. pp.94800S, �10.1117/12.2176565�. �cea-02549118�
*yohan.barbarin@cea.fr; phone +33 5 65 10 55 99
Optimization of detonation velocity measurements
using a Chirped Fiber Bragg Grating
Y. Barbarin
a*, A. Lefrançois
a, G. Zaniolo
a, V. Chuzeville
a, L. Jacquet
a,
S. Magne
b, J. Luc
aand A. Osmont
aa
CEA, DAM, GRAMAT, BP 80200, F-46500 Gramat, France
bCEA, LIST, Laboratoire Capteurs, Architectures Electroniques,
F-91191 Gif-sur-Yvette, France
ABSTRACT
Dynamic measurements of detonation velocity profiles are performed using long Chirped Fiber Bragg Gratings (CFBGs). Such thin probes, with a diameter of typically 150 µm, are inserted directly into a high explosive sample or simply positioned laterally. During the detonation, the width of the reflected optical spectrum is continuously reduced by the propagation of the wave-front, which physically shortens the CFBG. The reflected optical intensity delivers a ramp down signal type, which is directly related to the detonation velocity profile. Experimental detonation velocity measurements were performed on the side of three different high explosives (TNT, B2238 and V401) in a bare cylindrical stick configuration (diameter: 2 inches, height: 10 inches). The detonation velocity range covered was 6800 to 9000 m/s. The extraction of the detonation velocity profiles requires a careful calibration of the system and of the CFBG used. A calibration procedure was developed, with the support of optical simulations, to cancel out the optical spectrum distortions from the different optical components and to determine the wavelength-position transfer function of the CFBG in a reproducible way. The 40-mm long CFBGs were positioned within the second half of the three high explosive cylinders. The excellent linearity of the computed position-time diagram confirms that the detonation was established for the three high explosives. The fitted slopes of the position-time diagram give detonation velocity values which are in very good agreement with the classical measurements obtained from discrete electrical shorting pins.
Keywords: Fiber Bragg Grating, High Explosives, Detonation, Velocity Measurement
1. INTRODUCTION
Hydrodynamic models of high explosives (HEs) are based on equation of states determined experimentally. Detonation velocity is one of the main parameters. Transient physics are also of high interest. The continuous measurement of detonation velocity in the range of 5000-9000 m/s requires ultrafast sensors ideally positioned at the central axis of the HE. Different techniques have been developed over the past decades. The oldest, discrete Electrical Shorting Pins (ESPs), is still commonly used even if this is not a continuous measurement and if the pins are rarely implanted into a HE. However, it remains the reference for the detonation velocity measurement. Other techniques that monitor surfaces are based on Doppler measurements or on optical interferometry [1]. The main limitation of these techniques is that they don’t provide any readout of the inside. Switching to microwaves and using a radio-interferometer, the shock-wave and the detonation process can be analyzed inside a HE [2-3] and typically the field of view into the HE is up to a few tens of centimeters. However, the system’s adjustment before an experiment is sensitive and the materials’ permittivities need to be known at the frequency of the radio-interferometer. Of course, the materials have to be radio-transparent at that frequency. Any HE with metallic particles such as Aluminum is not transparent and thus can’t be characterized using this technique.
An alternative is to probe directly inside HEs with a sensor which could be considered as non-intrusive. An optical fiber is a good candidate, it offers continuous measurements. A great effort was carried out at LLNL [4] to develop a system based on the Doppler shift of the reflected optical signal at the end of the fiber tip. The tip is shocked and cut continuously with the detonation. In order to get a clear signal, the front curvature of the shocked silica at the end of the fiber needs to be concave [4] and a Fabry-Pérot filter needs to be put in place to filter non Doppler-shifted light [5]. If the front curvature is convex, as at low detonation velocity, no signal is collected. Chirped Fiber Bragg Gratings (CFBG) offer more flexibility because of the small reflections distributed along the integrated grating are independent of the detonation velocity. Such thin probes, with a diameter of typically 150 µm, can be inserted directly into an explosive but
can also be positioned laterally. CFBGs allow a good signal to noise ratio thanks to the grating reflectivity. LLNL started a decade ago to employ CFBG [6], the technique has been improved over the years [7-11]. CEA DAM GRAMAT and CEA LIST LCAE developed also detonation velocity measurements called “BraggFast” based on CFBG [12]. In this paper, the system has been further simulated and the calibration of the system optimized.
During the detonation, the width of the reflected optical spectrum is continuously reduced by the propagation of the wave-front which basically shortens the CFBG. The reflected optical intensity delivers a ramp down signal type which is related to the detonation velocity profile. This concept is presented and simulated in the following section with a vision on the calibration of the system. In Section 3, the system itself is described with the calibration associated to a 40-mm long CFBG. The experimental validation of the BraggFast system is shown in Section 4 with three HEs with different detonation velocity.
2. CONCEPT AND OPTICAL MODELING OF A DETONATION VELOCITY MEASUREMENT
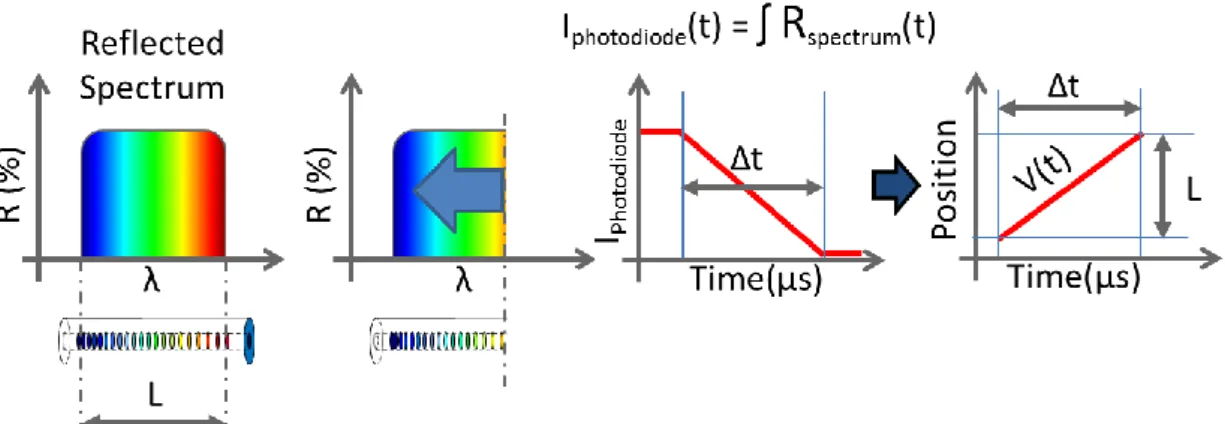
The concept of the detonation velocity measurements using a CFBG is illustrated in Figure 1. The chirp of the CFBG is intentionally pronounced in order to reflect a wide spectrum and thus more optical energy. In a CFBG, a reflected wavelength corresponds to a position on the grating. If the chirp is designed to be linear, the wavelength – position relation is linear. When a detonation propagates, the front wave pressure is above the silica damage level and as a direct consequence, the FBG is shortened. A part of the initial spectrum is then not reflected anymore. In this paper, the orientation of the grating is such that the long-wavelengths are exposed first to the detonation. When measuring the intensity of the reflected spectrum during the detonation, a ramp-down signal type is obtained. With ideal optical components and if the detonation is established, the signal is linear. The intensity of the signal can be transposed into a position, therefore the front wave position as a function of time is obtained and the velocity profile can easily be determined. Again if the detonation is established, the velocity is constant and corresponds to the slope of the diagram “Position vs. Time”.
Figure 1. Detonation velocity measurement using a Chirped Fiber Bragg Grating. In the reflected spectrum of the CFBG, a wavelength corresponds to a position along the fiber. When the fiber is shortened by the detonation, the intensity of the reflected light decreases linearly with time. This intensity corresponds to a position, then a value of velocity can be extracted.
The shortening of a CFBG doesn’t provide a perfectly linear ramp-down signal at the edges for two reasons. First, CFBG are usually apodized to reduce ripples in the reflected spectrum. With this apodisation, the index contrast at the beginning and at the end of the grating follows typically a sinus profile. Secondly, the reflected spectrum is the sum of interferences which behaves differently at the beginning of the detonation than at the end. To illustrate this, the reflected spectra obtained during the shortening of a CFBG have been simulated and are plotted in Figure 2. At the beginning, the whole grating is in place and starts to shorten, the reflectivity is maximum and the visible change is a slight shift of the long-wavelength edge. When the detonation reaches the end of the grating, only few grating periods remain. The shape of the reflected spectrum is different. The maximum reflectivity is not reached and the spectrum has a Gaussian shape with a minimum width. Lastly, non-linearities are present at the beginning and at the end of the CFBG.
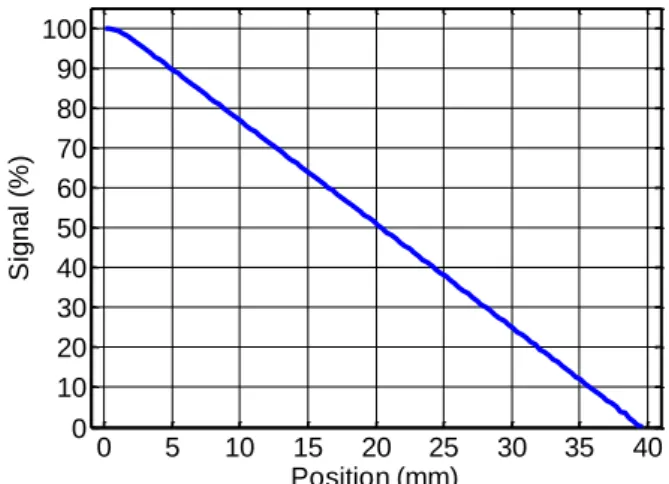
The intensities of the reflected spectra can also be computed by integrating one by one the spectra and by performing a normalization. The resulting grating response is plotted in Figure 3. At the edges, in the ranges of 0-5% and 95-100% the
curve bends. However, the curve is perfectly linear in the range of 5% up to 95%. The apodization and the reflections on a limited number of periods when the CFBG is almost completely destroyed, limit that range.
Experimentally, the linear part of the grating response shown in Figure 3 will be distorted. Indeed, the optical source doesn’t provide a flat optical spectrum and the different fiber-components used don’t have a perfectly flat spectral response. Furthermore, within a batch of CFBGs, theirs reflected spectra might not be totally identical. At the end, the intensities of the reflected spectra do not show a linear relation with the position along the CFBG. The proposed solution of this paper is to calibrate our system based on optical spectra. In the first paragraph, it was stated that a position corresponds to a reflected wavelength. As we do have access to the reflected spectrum of the system with all distortions embedded, by knowing the wavelength-position relation, we can compensate all the above mentioned non-linearities. We will present here by modeling the way to get the wavelength-position relation and it will then be presented experimentally in the following section with the raw signals with distortions. The calibration of the BraggFast system together with the CFBG is based on the initial reflected spectrum of the CFBG through the BraggFast system.
15200 1525 1530 1535 1540 1545 1550 1555 1560 1565 1570 10 20 30 40 50 60 70 80 90 100 R e fl e c ti v it y ( % ) Wavelength (nm)
Figure 2. Computed reflected spectra during the shortening of a 40-mm long Chirped Fiber Bragg Grating starting that the long-wavelength side. 0 5 10 15 20 25 30 35 40 0 10 20 30 40 50 60 70 80 90 100 S ig n a l (% ) Position (mm)
Figure 3. Computed reflected intensity when shortening a 40-mm long Chirped Fiber Bragg Grating as a function of the position in the grating.
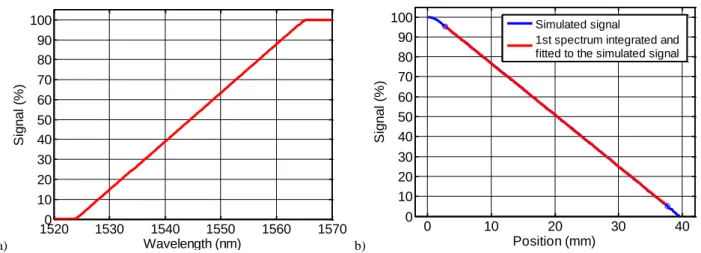
In order to better understand the role of the initial reflected spectrum of the CFBG, the spectrum computed for a 40-mm long CFBG (red curve in Figure 2) was integrated as a function of wavelength. The result is plotted in Figure 4 a). The numerical integration is like shortening the CFBG as illustrated in Figure 1. The response curve as a function of wavelength is perfectly linear within the same range than the response calculated from the different spectra (Figure 3). Then, within this range [5%-95%], a linear relation can be fitted between the wavelength and the position (Figure 4 b). It allows using the initial reflected spectrum to get the FBG response as a function of the position. The simulation illustrates here the concept and gives the key for the following section where the distortions are visible experimentally. The BraggFast system can be calibrated before each detonation velocity measurement and therefore be insensitive to the spectral distortions of the optical source and the other optical components.
a) 15200 1530 1540 1550 1560 1570 10 20 30 40 50 60 70 80 90 100 S ig n a l (% ) Wavelength (nm) b) 0 10 20 30 40 0 10 20 30 40 50 60 70 80 90 100 S ig n a l (% ) Position (mm) Simulated signal
1st spectrum integrated and fitted to the simulated signal
Figure 4. a) Integration of a simulated CFBG spectrum as a function of wavelength. b) Linear fit of curve a on the computed reflected intensity when shortening the 40-mm long CFBG to obtain a theoretical wavelength-position relation.
3. BRAGGFAST SYSTEM AND CALIBRATION
The scheme of BraggFast system for detonation velocity measurements using a CFBG is depicted in Figure 5. The optical source is an Amplified Spontaneous Emission (ASE) source. A circulator sends the reflected signal from the FBG to a 90-10 coupler. Most of the intensity (90%) is collected by the 400 MHz photoreceiver, 10% are brought out of the system to measure the initial optical spectrum using with a standard Optical Spectrum Analyzer (OSA). The attenuator is used to adjust the signal on the photoreceiver in the same range just below saturation when a different type of CFBG is used. The photoreceiver is connected to a real-time oscilloscope (Lecroy 6100A) which will be triggered with the HE detonator. Beside the 10% output signal collected for the OSA, the system is the same than in [6-11]. The OSA is just used few minutes before the experiments.
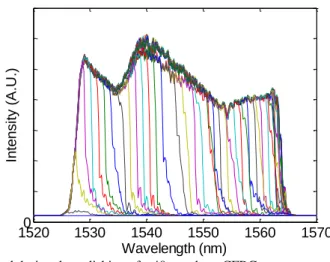
Before any detonation experiments, the CFBG wavelength-position relation needs to be known. The CFBG response as function of position must be measured once for each type of CFBGs. Different techniques can be used. Destructive solutions are for instance: the use of an ultrafast laser to cut the CFBG [10] or the use of a polishing machine to shorten step by step a PMMA cylinder in which a CFBG was glued [12]. Non-destructive solutions are: the use of a heat probe [10,13] or the use of an Optical Backscatter Reflectometer (OBR) such as the device from Luna Technologies [9]. We are currently validating the simpler OBR solution, but for the 40-mm long CFBG used in the three detonation experiments of this paper, the CFBG response and the wavelength-position relation was determined by polishing. Hence, a CFBG was first epoxy-bonded into a PMMA cylinder and polished gradually using a polishing machine. At each step, the PMMA block was removed from the machine and its length was measured with a Vernier caliper. 400 to 600 µm was approximately removed at each step. For the following data processing all optical spectra were recorded. There are plotted in Figure 6. The overall shape of the spectra is not flat mostly due to the ASE source. The circulator and the coupler also contribute to spectral distortions, but their influence is more limited. As in the numerical modeling described in the previous section, the CFBG response is obtained as function of position by integrating each optical spectrum. We remind that as each CFBG is slightly different, this curve cannot be reused at each detonation experiment. The system need to be calibrated each time and obviously without damaging the CFBG.
15200 1530 1540 1550 1560 1570 Wavelength (nm) In te n si ty (A .U .)
Figure 6. Optical spectra recorded during the polishing of a 40-mm long CFBG.
The calibration before a detonation experiment is based on the measurement of the reflected optical spectrum, but the wavelength-position relation of the CFBGs batch needs to be determined. It is obtained following a 3-step procedure shown in Figure 7. As a reminder, we want to match the CFBG response obtained by integrating all optical spectra during the polishing experiment (Figure 6) with the one obtained from a single spectrum of the whole CFBG. The optical spectrum of Figure 7 a) is integrated as a function of the wavelength (Figure 7 b). The curve is not straight anymore due to the spectral distortions. This curve is linearly fitted to the experimental CFBG response as function of position. The result is plotted in Figure 7 c); the fitted red curve overlaps perfectly the blue curve obtained from the Figure 6 spectra. This transfer function from the spectral domain to the spatial domain will be reused in the HE experiments in the following section. The CFBG was exposed to UV radiation through a phase mask 40-mm wide but its real active length is about 34 mm.
In the BraggFast system presented in Figure 5, the differences between the signal received by the photoreceiver and the signal received by the OSA are the spectral transmission difference between the 10% and the 90% coupler outputs and the fact that the photodiode hasn’t a flat spectral response. As the components are fixed, these differences can be compensated. The CFBG response seen by the photoreceiver can be reproduced first by correcting the reflected optical spectrum with the photoreceiver and coupler spectral responses. Then the wavelength-position transfer function is applied.
a) 15200 1530 1540 1550 1560 1570 10 20 30 40 50 60 70 80 90 100 110 Wavelength (nm) In te n si ty (A .U .) b) 15200 1530 1540 1550 1560 1570 0.1 0.2 0.3 0.4 0.5 0.6 0.7 0.8 0.9 1 Wavelength (nm) N o rm a lize d S ig n a l c) 5 10 15 20 25 30 35 40 45 0 0,1 0,2 0,3 0,4 0,5 0,6 0,7 0,8 0,9 1 F B G R e s p o n s e distance (mm) Experimental spectra
1st spectrum integrated and fitted
Figure 7. a) ASE spectrum reflected by the CFBG b) CFBG response by integration on the wavelength c) CFBG response as a function of the position within the BraggFast system. The blue curve is the experimental curve based on the Figure 6 spectra, the red curve is the curve of Figure 7 b) fitted on the experimental data.
4. EXPERIMENTAL RESULTS
The BraggFast system was tested as a complementary metrology on three different HEs (TNT, B2238 and V401). The detonation velocity covered a range from 6800 to 9000 m/s. The HEs were in a bare cylindrical stick configuration, all with a diameter of 2 inches (~51 mm) and a height of 10 inches (~254 mm). The picture in Figure 8 shows the TNT setup. One can see that the CFBG was placed with a blue tape aside the cylinders along the 2nd last block where the
detonation should be established. Twelve ESPs were placed to measure the detonation velocity in a classical way. Their signals confirmed that the booster has a strong influence on the detonation velocity and that the detonation is established in the two last blocks. The averaged detonation velocity can be determined with the five last ESPs. The results are shown in Table 1. The detonation velocity uncertainty measurement is ± 50 m/s (at k=2).
The measurement results from the CFBG are plotted in Figure 9 for the three HEs samples. The photoreceiver signals recorded by the oscilloscope are shown on the left column. One can notice that the signals are not linear. For each HE, the reflected spectrum of the CFBG was recorded and their CFBG response have been calculated (center column) using the wavelength-position relation, the spectral response of the photoreceiver and of the coupler. Using the CFBG responses and the oscilloscope signals, the “Position vs. Time” diagrams were computed (right column). In each diagram, the detonation velocity was fitted for the all slope. The fitted line overlaps very nicely the diagram curve. It confirms that the detonation was established and it proves that the system was well calibrated. The detonation velocities obtained from the BraggFast system are also listed in Table 1. The values are in very good agreement with the ESP values. The main uncertainty for the detonation velocity values obtained from the BraggFast system is on the fiber
positioning which can easily be improved. The second source of error is on the wavelength-position relation which can also be improved. For these measurements the detonation velocity uncertainty is ± 100 m/s (at k=2).
Figure 8. Picture of the TNT setup with five blocks and a booster. The CFBG is placed along to the setup under the blue tape. Twelve ESPs are placed to measure the detonation velocity in a classical way.
34 36 38 40 42 0 0.2 0.4 0.6 0.8 1 Time (µs) Vo lt a g e (V) 0 10 20 30 40 0 0.2 0.4 0.6 0.8 1 F ib e r re s p o n s e Distance (mm) 0.5 1 1.5 2 2.5 3 5 10 15 20 25 30 35 Time (µs) D is ta n c e ( m m ) 6789 m/s 28 30 32 34 36 38 0 0.2 0.4 0.6 0.8 1 Time (µs) V o lt a g e ( V ) 0 10 20 30 40 0 0.2 0.4 0.6 0.8 1 F ib e r re s p o n s e Distance (mm) 0 1 2 3 4 5 5 10 15 20 25 30 35 Time (µs) D is ta n c e ( m m ) 8111 m/s 24 26 28 30 32 0 0.2 0.4 0.6 0.8 1 Time (µs) V o lt a g e ( V ) 0 10 20 30 40 0 0.2 0.4 0.6 0.8 1 F ib e r re s p o n s e Distance (mm) 0.5 1 1.5 2 2.5 5 10 15 20 25 30 35 Time (µs) D is ta n c e ( m m ) 8885 m/s
Figure 9. Experimental results of detonation velocity measurements. The rows correspond to the three following HEs: TNT, B2238 and V401. The oscilloscope signals are in the first column, in the middle column are plotted the CFBG responses and in the right one, the “Position vs. Time” diagrams with the fitted detonation velocities.
Table 1. Summary of the measured detonation velocities.
High Explosives (HEs)
Detonation Velocities Five electrical shorting pins
(ESPs) BraggFast system
TNT 6800 m/s ± 50 m/s 6790 m/s ± 100 m/s
B2238 8035 m/s ± 50 m/s 8110 m/s ± 100 m/s
V401 8932 m/s ± 50 m/s 8890 m/s ± 100 m/s
5. CONCLUSIONS AND OUTLOOK
Dynamic measurements of detonation velocity profiles were performed using long Chirped Fiber Bragg Gratings and tested on three HE bare cylinder tests. The optical simulations gave an insight on the behavior of the CFBG during the detonation. The BraggFast system presented in this paper has a dedicated output to be accurately calibrated by the measurement of the CFBG’s reflected spectrum just before an experiment. The system becomes insensitive to any spectral distortions of CFBG and of the optical source. This was confirmed experimentally, the three HE tested showed excellent linearities in theirs “position-time” diagrams as expected for established detonations. The fitted slopes of these diagrams gave detonation velocity values which are in very good agreement with the classical measurements obtained from discrete electrical shorting pins. This BraggFast system will be further tested for different type of CFBGs and in more complex configurations such as into HEs. The aim is to get better analyze transitory phenomena in HEs thanks to the continuous measurement. The use of an OBR to get more accuracy and in a nondestructive way the CFBG wavelength-position relation will be generalized after a complete validation. A tool is also being validating to process automatically the signals and to provide velocity and uncertainties values on multiple sections.
REFERENCES
[1] Devlaminck J., Luc J. and Chanal P.-Y., “Digital signal processing for velocity measurements in dynamical material’s behaviour studies”, Rev. Sci. Instr., 85, 035109, (2014)
[2] Janesheski R.S., Groven L.J. and Son S.F. “Detonation failure characterization of non-ideal explosives”, AIP Conf. Proc. 1426, 587-590, (2012)
[3] Bel’skii V.M., Mikhailov A.L., Rodionov A.V. and Sedov A.A., “Microwave diagnostics of shock-wave and detonation processes”, Combustion, Explosion, and Shock Waves, Vol. 47, 6, pp. 639-650, (2011)
[4] Goosman D., Wade J., Garza R., Avara G., Crabtree T., Rivera A., Hare D, Tolar Jr D. and Bratton B., “Optical probes for continuous Fabry-Perot velocimetry inside materials”, Proc. SPIE 5580, 517-528, (2005)
[5] Goosman D., Avara G., Wade J. and Rivera A., “Optical filters to exclude non Doppler shifted light in fast velocimetry”, Proc. SPIE 4948, 152-159, (2003)
[6] Benterou J.J., Udd E., Wilkins P., Roeske F., Roos E., Jackson D., “In-sity continuous detonation velocity measurements using fiber-optic Bragg grating sensors”, Proc. 34th International Pyrotechnics Seminar, 1, 309-322,
(2007)
[7] Rodriguez G., Sandberg R.L., Jackson S.I., Dattelbaum D.M., Vincent S.W., McCulloch Q., Martinez R.M. Gilbertson S.M. and Udd. E., “Fiber bragg grating sensing of detonation and shock experiments at Los Alamos National Laboratory”, Proc. SPIE 8722, 872204, (2013)
[8] Benterou J.J., May C.A., Udd E., Mihailov S.J. and Lu P., “High speed measurements using fiber-optic Bragg grating sensors”, Proc. SPIE LLNL-PROC-409969, (2013)
[9] Benterou J., Bennett C.V., Cole G., Hare D.E., May C. and Udd E., “Internal detonation velocity measurements inside high explosives”, Proc. SPIE LLNL-PROC-409969, (2009)
[10] Rodriguez G., Sandberg R.L., McCulloch Q., Jackson S.I., Vincent S.W. and Udd. E., “Chirped fiber Bragg grating detonation velocity sensing”, Rev. Sci. Instr., 84, 015003, 1-10 (2013)
[11] Rodriguez G., Sandberg R.L., Jackson S.I., Vincent S.W., Gilbertson S.M. and Udd. E., “Fiber Bragg sensing of high explosive detonation experiments at Los Alamos National Laboratory”, J. Phys., Conference Series 500, Vol. 142030, (2014)
[12] Magne S., Lefrançois A., Luc J., Laffont G. and Ferdinand P., “Real-time, distributed measurement of detonation velocities inside high explosives with the help of Chirped Fiber Bragg Gratings”, 5th European Workshop on Optical
Fiber Sensors, SPIE 87942K-1, Krakow, Poland, (2013)
[13] Roussel N., Magne S., Martinez C. and Ferdinand P., “Measurement of index of modulation along Bragg grating by side scattering and local heating techniques”, Optical Fiber Technology, 5, 119-132, (1999)