DEMONSTRATION OF REDUCED AIRPORT CONGESTION THROUGH PUSHBACK RATE CONTROL
I. Simaiakis, H. Khadilkar, H. Balakrishnan, T. G. Reynolds and R. J. Hansman Department of Aeronautics and Astronautics
Massachusetts Institute of Technology Cambridge, MA, USA
B. Reilly
Boston Airport Traffic Control Tower
Federal Aviation Administration, Boston, MA, USA S. Urlass
Office of Environment and Energy
Federal Aviation Administration, Washington, DC, USA
Report No. ICAT-2011-2 January 2011
MIT International Center for Air Transportation (ICAT) Department of Aeronautics & Astronautics
Massachusetts Institute of Technology Cambridge, MA 02139 USA
Abstract
Airport surface congestion results in significant increases in taxi times, fuel burn and emissions at major airports. This paper presents the field tests of a control strategy to airport congestion control at Boston Logan International Airport. The approach determines a suggested rate to meter pushbacks from the gate, in order to prevent the airport surface from entering congested states and reduce the time that flights spend with engines on while taxiing to the runway. The field trials demonstrated that significant benefits were achievable through such a strategy: during eight four-hour tests conducted during August and September 2010, fuel use was reduced by an estimated 12,000-15,000 kg (3,900-4,900 US gallons), while aircraft gate pushback times were increased by an average of only 4.3 minutes.
1
Introduction
Aircraft taxiing on the surface contribute significantly to the fuel burn and emissions at airports. The quanti-ties of fuel burned, as well as different pollutants such as Carbon Dioxide, Hydrocarbons, Nitrogen Oxides, Sulfur Oxides and Particulate Matter, are proportional to the taxi times of aircraft, as well as other factors such as the throttle settings, number of engines that are powered, and pilot and airline decisions regarding engine shutdowns during delays.
Airport surface congestion at major airports in the United States is responsible for increased taxi-out times, fuel burn and emissions [1]. Similar trends have been noted in Europe, where it is estimated that aircraft spend 10-30% of their flight time taxiing, and that a short/medium range A320 expends as much as 5-10% of its fuel on the ground [2]. Domestic flights in the United States emit about 6 million metric tonnes of CO2, 45,000 tonnes of CO, 8,000 tonnes of NOx, and 4,000 tonnes of HC taxiing out for takeoff; almost
half of these emissions are at the 20 most congested airports in the country. The purpose of the Pushback Rate Control Demonstration at Boston Logan International Airport (BOS) was to show that a significant portion of these impacts could be reduced through measures to limit surface congestion.
A simple airport congestion control strategy would be a state-dependent pushback policy aimed at re-ducing congestion on the ground. The N-control strategy is one such approach, and was first considered in the Departure Planner project [3]. Several variants of this policy have been studied in prior literature [4, 5, 6, 7]. The policy, as studied in these papers, is effectively a simple threshold heuristic: if the total number of departing aircraft on the ground exceeds a certain threshold, further pushbacks are stopped until the number of aircraft on the ground drops below the threshold. By contrast, the pushback rate control strategy presented in this paper does not stop pushbacks once the surface is in a congested state, instead it regulates the rate at which aircraft pushback from their gates during high departure demand periods so that the airport does not reach undesirably high congested states.
1.1 Motivation: Departure throughput analysis
The main motivation for our proposed approach to reduce taxi times is an observation of the performance of the departure throughput of airports. As more aircraft pushback from their gates onto the taxiway system, the throughput of the departure runway initially increases because more aircraft are available in the depar-ture queue, but as this number, denoted as N, exceeds a threshold, the depardepar-ture runway capacity becomes the limiting factor, and there is no additional increase in throughput. We denote this threshold as N∗. This behavior can be further parameterized by the number of arrivals. The dependence of the departure through-put with the number of aircraft taxiing out and the arrival rate is illustrated for a runway configuration in Figure 1 using 2007 data from FAA’s Aviation System Performance Metrics (ASPM) database. Beyond the threshold N∗, any additional aircraft that pushback simply increase their taxi-out times [8]. The value of N∗ depends on the airport, arrival demand, runway configuration, and meteorological conditions. During periods of high demand, the pushback rate control protocol regulates pushbacks from the gates so that the number of aircraft taxiing out stays close to a specified value, Nctrl, where Nctrl> N∗, thereby ensuring that
the airport does not reach highly-congested states. While the choice of Nctrlmust be large enough to
main-tain runway utilization, too large a value will be overly conservative, and result in a loss of benefits from the control strategy.
0 2 4 6 8 10 12 14 16 18 20 22 24 26 28 0 1 2 3 4 5 6 7 8 9 10 11 12 13 14
Number of aircraft taxiing out
Takeoff rate (aircraft/15 min)
14 Arrivals /15 min 7 Arrivals /15 min 0 Arrivals /15 min
Figure 1: Regression of the departure throughput as a function of the number of aircraft taxiing out, param-eterized by the arrival rate for 22L, 27 | 22L, 22R configuration, under VMC [9].
2
Design of the pushback rate control protocol
The main design consideration in developing the pushback rate control protocol was to incorporate effective control techniques into current operational procedures with minimal controller workload and procedural modifications. After discussions with the BOS facility, it was decided that suggesting a rate of pushbacks (to the BOS Gate controller) for each 15-min period was an effective strategy that was amenable to current procedures.
The two important parameters that need to be estimated in order to determine a robust control strategy are the N∗threshold and the departure throughput of the airport for different values of N. These parameters can potentially vary depending on meteorological conditions, runway configuration and arrival demand (as seen in Figure 1), but also on the fleet mix and the data sources we use.
2.1 Runway configurations
BOS experiences Visual Meteorological Conditions (VMC) most of the time (over 83% of the time in 2007). It has a complicated runway layout consisting of six runways, five of which intersect with at least one other runway, as shown in Figure 2. As a result, there are numerous possible runway configurations: in 2007, 61 different configurations were reported. The most frequently-used configurations under VMC are 22L, 27 | 22L, 22R; 4L, 4R | 4L, 4R, 9; and 27, 32 | 33L, where the notation ‘R1, R2 | R3, R4’ denotes arrivals on runways R1 and R2, and departures on R3 and R4. The above configurations accounted for about 70% of times under VMC.
We note that, of these frequently used configurations, 27, 32 | 33L involves taxiing out aircraft across active runways. Due to construction on taxiway “November” between runways 15L and 22R throughout the
GENERAL EDWARD LAWRENCE LOGAN INTL (BOS) BOSTON / 09351 BOSTON, MASSACHUSETTS 4R B ELEV15 ELEV 19 035.2^ FIELD ELEV 20 71^01’W 71^00’W 42^21’N AIRPORT DIAGRAM M ALL AIRCRAFT HOLD HERE. (4L-APCH) RWYS 4L-22R, 4R-22L, 9-27, 15R-33L, 15L-33R S200, D200, ST175, DT400, DDT800 RWY 14-32 S75, D200, ST175, DT400, DDT875 E-2 MAIN TERMINAL SATELLITE TERMINAL 09351 NORTH CARGO GENERAL AVIATION RAMP SEE INSET ELEV 16 AIRPORT DIAGRAM 14 ELEV 17 J PAD (PARKING) B K MAIN FIRE STATION 33L M-1 EMAS 158 X 170 INTERNATIONAL TERMINAL 27 9 D-2 D-1 D C 4L C E C M E K B A-2 A K E E-1 7000 X 150 10005 X 150 ELEV 15 272.1^ 330.7^ 092.1^ 035.2^ LAHSO LAHSO LAHSO B J J J-1 A B CONTROL TOWER PIER C TERMINAL B TERMINAL B US CUSTOMS 22R 22L N N-3 R Y 33R 15L N-2 N-1 N N 15R Q F H B A Z L A-1 F Q C B 10083 X 150 7861 X 150 ELEV 15 ELEV 14 ELEV 15 ELEV 14 215.2^ 215.2^ 150.7^ 330.7^ N 150.7^ 42^22’N CAUTION: BE ALERT TO RUNWAY CROSSING CLEARANCES. READBACK OF ALL RUNWAY HOLDING INSTRUCTIONS IS REQUIRED.
VAR 15.5^ W
JANUARY 2005 ANNUAL RATE OF CHANGE
0.1^ E ELEV 20 ELEV 16 A LAHSO EMAS 190 X 170 ELEV 19 302 x 2557 X 100 SATELLITE FIRE STATION M M M PIER B TERMINAL C TERMINAL E
BOSTON / GENERAL EDWARD LAWRENCE LOGAN INTL
AL-58 (FAA) BOSTON, MASSACHUSETTS (BOS) 42^23’N ELEV 14 M M ELEV 17 P E K M M M D C D G INTERNATIONAL TERMINAL 5000 X 100 ATIS ARR 135.0 DEP 127.875 BOSTON TOWER 128.8 257.8 Helicopters 124.725 GND CON 121.9 CLNC DEL 121.65 257.8
ASDE-X Surveillance System in use. Pilots should operate transponders with Mode C on all twys and rwys.
32
NE-1, 14 JAN 2010 to 11 FEB 2010
NE-1, 14 JAN 2010 to 11 FEB 2010
Figure 2: BOS airport diagram, showing alignment of runways.
duration of the demo, departures headed to 22R used 15L to cross runway 22R onto taxiway “Mike”. This resulted in active runway crossings in the 27, 22L | 22L, 22R configuration as well.
During our observations prior to the field tests as well as during the demo periods, we found that under Instrument Meteorological Conditions (IMC), arrivals into BOS are typically metered at the rate of 8 aircraft per 15 minutes by the TRACON. This results in a rather small departure demand, and there was rarely con-gestion under IMC at Boston during the evening departure push. For this reason, we focus on configurations most frequently used during VMC operations for the control policy design.
2.2 Fleet mix
Qualitative observations at BOS suggest that the departure throughput is significantly affected by the number of propeller-powered aircraft (props) in the departure fleet mix. In order to determine the effect of props, we analyze the tradeoff between takeoff and landing rates at BOS, parameterized by the number of props during periods of high departure demand.
Figure 3 shows that under Visual Meteorological Conditions (VMC), the number of props has a signif-icant impact on the departure throughput, resulting in an increase at a rate of nearly one per 15 minutes for
0 1 2 3 4 5 6 7 8 9 10 11 12 13 14 0 1 2 3 4 5 6 7 8 9 10 11 12 13 14
Landings rate (AC/15 min)
T a ke o ff ra te (A C / 1 5 m in )
Average Fleet Mix Throughput 0 Props Fleet Mix Throughput 1 Props Fleet Mix Throughput 2 Props Fleet Mix Throughput 3 Props Fleet Mix Throughput 4 Props Fleet Mix Throughput 5 Props Fleet Mix Throughput
Figure 3: Regression of the takeoff rate as a function of the landing rate, parameterized by the number of props in a 15-minute interval for 22L, 27 | 22L, 22R configuration, under VMC [9].
each additional prop departure. This observation is consistent with procedures at BOS, since air traffic con-trollers fan out props in between jet departures, and therefore the departure of a prop does not interfere very much with jet departures. The main implication of this observation for the control strategy design at BOS was that props could be exempt from both the pushback control as well as the counts of aircraft taxiing out (N). Similar analysis also shows that heavy departures at BOS do not have a significant impact on departure throughput, in spite of the increased wake-vortex separation that is required behind heavy weight category aircraft. This can be explained by the observation that air traffic controllers at BOS use the high wake vortex separation requirement between a heavy and a subsequent departure to conduct runway crossings, thereby mitigating the adverse impact of heavy weight category departures [9].
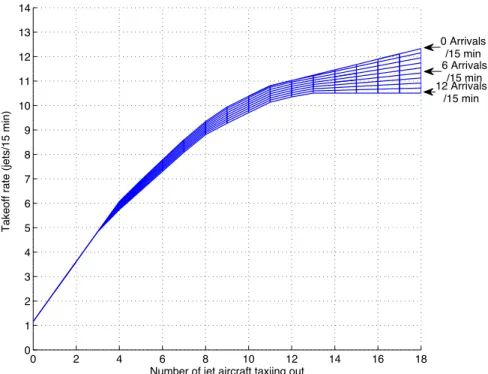
Motivated by this finding, we can determine the dependence of the jet (i.e., non-prop) departure through-put as a function of the number of jet aircraft taxiing out, parameterized by the number of arrivals, as il-lustrated in Figure 4. This figure illustrates that during periods in which arrival demand is high, the jet departure throughput saturates when the number of jets taxiing out exceeds 17 (based on ASPM data).
2.3 Data sources
It is important to note that Figure 1, Figure 3 and Figure 4 are determined using ASPM data. Pushback times in ASPM are determined from the brake release times reported through the ACARS system, and are prone to error because about 40% of the flights departing from BOS do not automatically report these times [10]. Another potential source of pushback and takeoff times is the Airport Surface Detection Equipment Model X (or ASDE-X) system, which combines data from airport surface radars, multilateration sensors, ADS-B, and aircraft transponders [11]. While the ASDE-X data is likely to be more accurate than the ASPM data, it is still noisy, due to factors such as late transponder capture (the ASDE-X tracks only begin after the pilot has turned on the transponder, which may be before or after the actual pushback time), aborted takeoffs (which have multiple departure times recorded), flights cancelled after pushback, etc. A comparison of
0 2 4 6 8 10 12 14 16 18 20 22 24 0 1 2 3 4 5 6 7 8 9 10 11 12
Number of jet aircraft taxiing out
Takeoff rate (jets/15 min)
0 Arrivals /15 min 14 Arrivals /15 min 7 Arrivals /15 min
Figure 4: Regression of the jet takeoff rate as a function of the number of departing jets on the ground, parameterized by the number of arrivals for 22L, 27 | 22L, 22R configuration, under VMC [9].
both ASDE-X and ASPM records with live observations made in the tower on August 26, 2010 revealed that the average difference in the number of pushbacks per 15-minutes as recorded by ASDE-X and visual means is 0.42, while it is -3.25 for ASPM and visual observations, showing that the ASPM records differ considerably from ASDE-X and live observations. The above comparison motivates the recalibration of airport performance curves and parameters using ASDE-X data in addition to ASPM data. This is because ASPM data is not available in real-time and will therefore not be available for use in real-time deployments, and the ASDE-X data is in much closer agreement to the visual observations than ASPM.
We therefore conduct similar analysis to that shown in Figure 4, using ASDE-X data. The results are shown in Figure 5. We note that the qualitative behavior of the system is similar to what was seen with ASPM data, namely, the jet throughput of the departure runway initially increases because more jet aircraft are available in the departure queue, but as this number exceeds a threshold, the departure runway capacity becomes the limiting factor, and there is no additional increase in throughput. By statistically analyzing three months of ASDE-X data from Boston Logan airport using the methodology outlined in [9], we determine that the average number of active jet departures on the ground at which the surface saturates is 12 jet aircraft for the 22L, 27 | 22L, 22R configuration, during periods of moderate arrival demand. This value is close to that deduced from Figure 5, using visual means.
2.4 Estimates of N∗
Table 1 shows the values of N∗for the three main runway configurations under VMC, that were used during the field tests based on the ASDE-X data analysis. For each runway configuration, we use plots similar to Figure 5 to determine the expected throughput. For example, if the runway configuration is 22L, 27 | 22L,
0 2 4 6 8 10 12 14 16 18 0 1 2 3 4 5 6 7 8 9 10 11 12 13 14
Number of jet aircraft taxiing out
Takeoff rate (jets/15 min)
0 Arrivals /15 min 6 Arrivals /15 min 12 Arrivals /15 min
Figure 5: Regression of the takeoff rate as a function of the number of jets taxiing out, parameterized by the number of arrivals, using ASDE-X data, for the 22L, 27 | 22L, 22R configuration.
22R, 11 jets are taxiing out, and the expected arrival rate is 9 aircraft in the next 15 minutes, the expected departure throughput is 10 aircraft in the next 15 minutes.
Table 1: Values of N∗estimated from the analysis of ASDE-X data. Configuration N∗
22L, 27 | 22L, 22R 12 27, 32 | 33L 12 4L, 4R | 4L, 4R, 9 15
3
Implementation of pushback rate control
The pushback rate was determined so as to keep the number of jets taxiing out near a suitable value (Nctrl),
where Nctrlis greater than N∗, in order to mitigate risks such as under-utilizing the runway, facing many gate
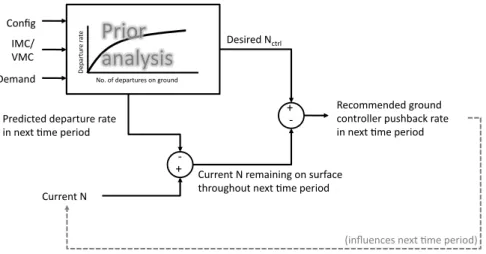
conflicts, or being unable to meet target departure times. Off-nominal events such as gate-use conflicts and target departure times were carefully monitored and addressed. Figure 6 shows a schematic of the decision process to determine the suggested pushback rate.
The determination of the pushback rate is conducted as follows. Prior to the start of each 15-minute period, we:
1. Observe the operating configuration, VMC/IMC, and the predicted number of arrivals in the next 15 minutes (from ETMS) and using these as inputs into the appropriate departure throughput saturation curves (such as Figure 5), determine the expected jet departure throughput.
!"#$%&'()*&+,)-&.'".&/01)
-0123) 45-6) 75-) 8,9&1:) 8,#;<,:)='+<.) -"<<,1+)=) !<,:;'+,:):,>&<+"<,)<&+,) ;1)1,?+)/9,)>,<;0:) *,'099,1:,:)3<0"1:) '01+<0..,<)>"#$%&'()<&+,) ;1)1,?+)/9,)>,<;0:) @;1A",1',#)1,?+)/9,)>,<;0:B) C)D) -"<<,1+)=)<,9&;1;13)01)#"<E&',) +$<0"3$0"+)1,?+)/9,)>,<;0:) C) D) =0F)0E):,>&<+"<,#)01)3<0"1:) 8 ,> &< +" <, )<& +, )Figure 6: A schematic of the pushback rate calculation.
2. Using visual observations, count the number of departing jets currently active on the surface. We counted a departure as active once the pushback tug was attached to the aircraft and it was in the process of pushing back.
3. Calculate the difference between the current number of active jet departures and the expected jet departure throughput. This difference is the number of currently active jets that are expected to remain on the ground through the next 15 min.
4. The difference between Nctrland the result of the previous step provides us with the additional number
of pushbacks to recommend in next 15 minutes.
5. Translate the suggested number of pushbacks in the next 15 minutes to an approximate pushback rate in a shorter time interval more appropriate for operational implementation (for example, 10 aircraft in the next 15 minutes would translate to a rate of “2 per 3 minutes.”).
3.1 Communication of recommended pushback rates and gate-hold times
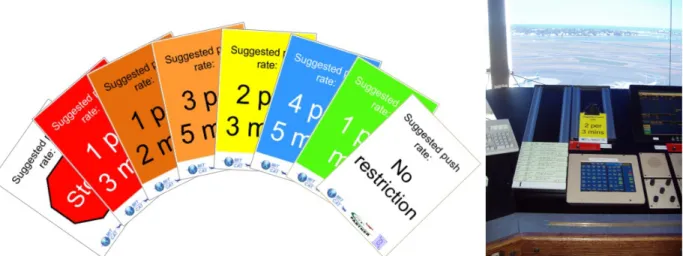
During the demo, we used color-coded cards to communicate suggested pushback rates to the air traffic controllers, thereby eliminating the need for verbal communications. We used one of eight 5 in × 7.5 in cards, with pushback rate suggestions that ranged from “1 per 3 minutes” (5 in 15 minutes) to “1 aircraft per minute” (15 in 15 minutes), in addition to “Stop” (zero rate) and “No restriction” cards, as shown in Figure 7 (left). The setup of the suggested rate card in the Boston Gate controllers position is shown in Figure 7 (right).
The standard format of the gate-hold instruction communicated by the Boston Gate controller to the pilots included both the current time, the length of the gate-hold, and the time at which the pilot could expect to be cleared. For example:
Boston Gate: “AAL123, please hold push for 3 min. Time is now 2332, expect clearance at 2335. Remain on my frequency, I will contact you.”
In this manner, pilots were made aware of the expected gate-holds, and could inform the controller of constraints such as gate conflicts due to incoming aircraft. In addition, ground crews could be informed of the expected gate-hold time, so that they could be ready when push clearance was given. The post-analysis
Figure 7: (Left) Color-coded cards that were used to communicate the suggested pushback rates. (Right) Display of the color-coded card in the Boston Gate controller’s position.
of the tapes of controller-pilot communications showed that the controllers cleared aircraft for push at the times they had initially stated (i.e., an aircraft told to expect to push at 2335 would be cleared at 2335), and that they also accurately implemented the push rates suggested by the cards.
3.2 Handling of off-nominal events
The implementation plan also called for careful monitoring of off-nominal events and system constraints. Of particular concern were gate conflicts (for example, an arriving aircraft is assigned a gate at which a departure is being held), and the ability to meet controlled departure times (Expected Departure Clearance Times or EDCTs) and other constraints from Traffic Management Initiatives. After discussions with the Tower and airlines prior to the field tests, the following decisions were made:
1. Flights with EDCTs would be handled as usual and released First-Come-First-Served. Long delays would continue to be absorbed in the standard holding areas. Flights with EDCTs did not count toward the count of active jets when they pushed back; they counted toward the 15-minute interval in which their departure time fell. An analysis of EDCTs from flight strips showed that the ability to meet the EDCTs was not impacted during the field tests.
2. Pushbacks would be expedited to allow arrivals to use the gate if needed. Simulations conducted prior to the field tests predicted that gate-conflicts would be relatively infrequent at BOS; there were only two reported cases of potential gate-conflicts during the field tests, and in both cases, the departures were immediately released from the gate-hold and allowed to pushback.
3.3 Determination of the time period for the field trials
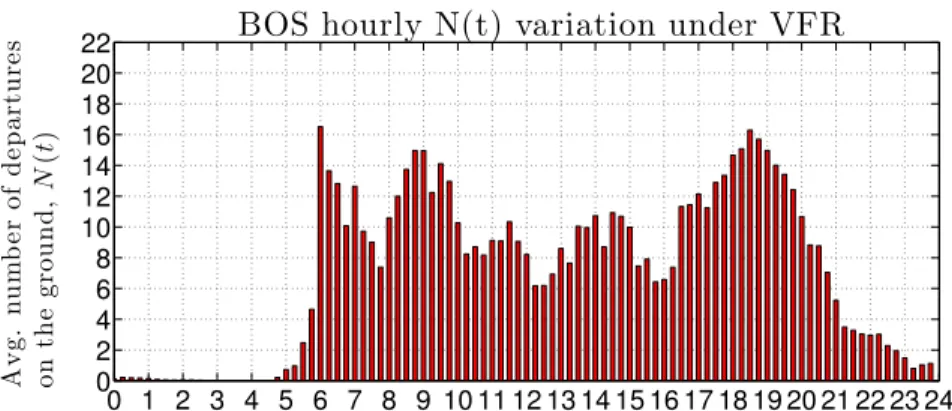
The pushback rate control protocol was tested in select evening departure push periods (4-8PM) at BOS between August 23 and September 24, 2010. Figure 8 shows the average number of departures on the ground in each 15-minute interval using ASPM data. There are two main departure pushes each day. The evening departure push differs from the morning one because of the larger arrival demand in the evenings.
The morning departure push presents different challenges, such as a large number of flights with controlled departure times, and a large number of tow-ins for the first flights of the day.
0 1 2 3 4 5 6 7 8 9 10 11 12 13 14 15 16 17 18 19 20 21 22 23 24 0 2 4 6 8 10 12 14 16 18 20 22 hour A v g . n u mb er o f d ep a rt u re s o n th e g ro u n d , N (t )
BOS hourly N(t) variation under VFR
Figure 8: Variation of departure demand (average number of active departures on the ground) as a function of the time of day.
4
Results of field tests
Although the pushback rate control strategy was tested at BOS during 16 demo periods, there was very little metering when the airport operated in its most efficient configuration (4L, 4R | 4L, 4R, 9), and in only eight of the demo periods was there enough congestion for gate-holds to be experienced. There was insufficient congestion for recommending restricted pushback rates on August 23, September 16, 19, 23, and 24. In addition, on September 3 and 12, there were no gate-holds (although departure demand was high, traffic did not build up, and no aircraft needed to be held at the gate). For the same reason, only one aircraft received a gate-hold of 2 min on September 17. The airport operated in the 4L, 4R | 4L, 4R, 9 configuration on all three of these days. In total, metering was in effect during the field tests for over 37 hours, with about 24 hours of test periods with significant gate-holds.
4.1 Data analysis examples
In this section, we examine three days with significant gate-holds (August 26, September 2 and 10) in order to describe the basic features of the pushback rate control strategy.
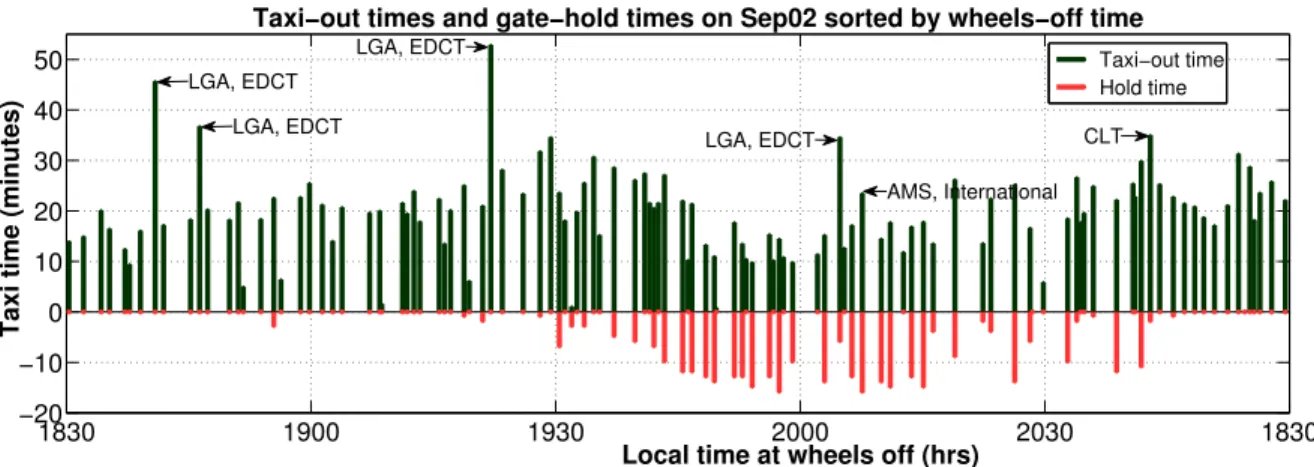
Figure 9 shows taxi-out times from one of the test periods, September 2. Each green bar in Figure 9 represents the actual taxi-out time of a flight (measured using ASDE-X as the duration between the time when the transponder was turned on and the wheels-off time). The red bar represents the gate-hold time of the flight (shown as a negative number). In practice, there is a delay between the time the tug pushes them from the gate and the time their transponder is turned on, but statistical analysis showed that this delay was random, similar distributed for flights with and without gate-holds, and typically about 4 minutes. We note in Figure 9 that as flights start incurring gate-holds (corresponding to flights departing at around 1900 hours), there is a corresponding decrease in the active taxi-out times, i.e., the green lines. Visually, we notice that as the length of the gate-hold (red bar) increases, the length of the taxi-out time (green bar) proportionately decreases. There are still a few flights with large taxi-out times, but these typically correspond to flights with EDCTs. These delays were handled as in normal operations (i.e., their gate-hold times were not increased),
1830 1900 1930 2000 2030 1830 −20 −10 0 10 20 30 40 50
Taxi−out times and gate−hold times on Sep02 sorted by wheels−off time
Local time at wheels off (hrs)
Taxi time (minutes)
Taxi−out time Hold time LGA, EDCT LGA, EDCT LGA, EDCT LGA, EDCT CLT AMS, International
Figure 9: Taxi-out and gate-hold times from the field test on September 2, 2010.
as was agreed with the tower and airlines. Finally, there are also a few flights with no gate-holds and very short taxi-out times, typically corresponding to props.
The impact of the metering can be further visualized by using ASDE-X data, as can be seen in the Figure 10, which shows snapshots of the airport surface at two instants of time, the first before the metering started, and the second during the metering. We notice the significant decrease in taxiway congestion, in particular the long line of aircraft between the ramp area and the departure runway, due to the activation of the pushback rate control strategy.
Figure 10: Snapshots of the airport surface, (left) before metering, and (right) during metering of pushbacks. Departing aircraft are shown in green, and arrivals in red. We note that the line of 15 departures between the ramp area and the departure runway prior to commencement of pushback rate control reduces to 8 departures during metering. The white area on the taxiway near the top of the images indicates the closed portion of taxiway “November”.
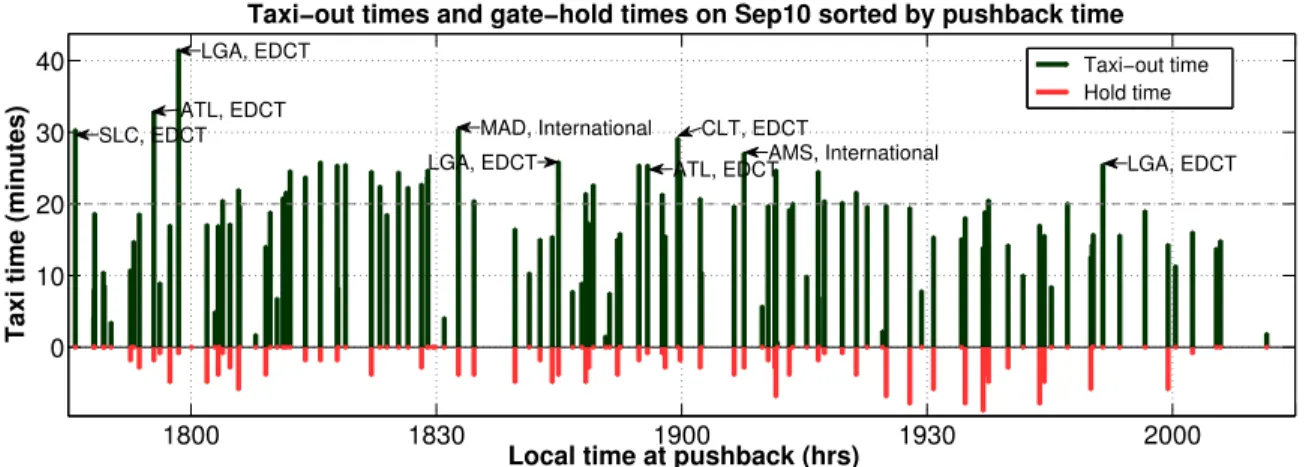
Looking at another day of trials with a different runway configuration, Figure 11 shows taxi-out times from the test period of September 10. In this plot, the flights are sorted by pushback time. We note that as flights start incurring gate-holds, their taxi time stabilizes at around 20 minutes. This is especially evident during the primary departure push between 1830 and 1930 hours. The gate-hold times fluctuate from 1-2 minutes up to 9 minutes, but the taxi-times stabilize as the number of aircraft on the ground stabilizes to the
1800 1830 1900 1930 2000 0 10 20 30 40
Taxi−out times and gate−hold times on Sep10 sorted by pushback time
Local time at pushback (hrs)
Taxi time (minutes)
Taxi−out time Hold time SLC, EDCT LGA, EDCT ATL, EDCT ATL, EDCT MAD, International LGA, EDCT AMS, International LGA, EDCT CLT, EDCT
Figure 11: Taxi-out and gate-hold times from the field test on September 10, 2010.
specified Nctrlvalue. Finally, the flights that pushback between 1930 and 2000 hours are at the end of the
departure push and derive the most benefit from the metering strategy: they have longer gate holds, waiting for the queue to drain and then taxi to the runway facing a gradually diminishing queue.
Figure 12 further illustrates the benefits of the pushback rate control protocol, by comparing operations from a day with pushback rate control (shown in blue) and a day without (shown in red), under similar demand and configuration. The upper plot shows the average number of jets taxiing-out, and the lower plot the corresponding average taxi-out time, per 15-minute interval. We note that after 1815 hours on September 10, the number of jets taxiing out stabilized at around 15. As a result, the taxi-out times stabilized at about 16 minutes. Pushback rate control smooths the rate of the pushbacks so as to bring the airport state to the specified state, Nctrl, in a controlled manner. Both features of pushback rate control, namely, smoothing
of demand and prevention of congestion can be observed by comparing the evenings of September 10 and September 15. We see that on September 15, in the absence of pushback rate control, as traffic started accumulating at 1745 hours, the average taxi-out time grew to over 20 minutes. During the main departure push (1830 to 1930), the average number of jets taxiing out stayed close to 20 and the average taxi-out time was about 25 minutes.
Similarly, Figure 13 compares the results of a characteristic pushback rate control day in runway config-uration 27, 22L | 22L, 22R, August 26, to a similar day without pushback metering. We observe that for on August 26, the number of jets taxiing out during the departure push between 1830 and 1930 hours stabilized at 15 with an average taxi-out time of about 20 minutes. On August 17, when metering was not in effect, the number of aircraft reached 20 at the peak of the push and the average taxi-out times were higher than those of August 26.
4.2 Runway utilization
The overall objective of the field test was to maintain pressure on the departure runways, while limiting sur-face congestion. By maintaining runway utilization, it is reasonable to expect that gate-hold times translate to taxi-out time reduction, as suggested by Figure 9. We therefore also carefully analyze runway utilization (top) and departure queue sizes (bottom) during metering periods, as illustrated in Figure 14.
In estimating the runway utilization, we determine (using ASDE-X data) what percentage of each 15-min interval corresponded to a departure on takeoff roll, to aircraft crossing the runway, arrivals (that requested landing on the departure runway) on final approach, departure that is holding for takeoff clearance, etc. We
16 17 18 19 20 0 5 10 15 20 25 30
Avg. taxiïout time (in min, per 15ïmin interval)
Taxi time (minutes)
Local time at start of taxi
16 17 18 19 20 0 2 4 6 8 10 12 14 16 18 20
Avg. number of jets taxiingïout (per 15ïmin interval)
Local time
Number of jets taxiing out
Sep10 Sep15
Sep10 Sep15
Figure 12: Surface congestion (top) and average taxi-out times (bottom) per 15-minutes, for (blue) a day with pushback rate control, and (red) a day with similar demand, same runway configuration and visual weather conditions, but without metering. Delay attributed to EDCTs has been removed from the taxi-out time averages.
note that between 1745 and 2000 hours, when gate-holds were experienced, the runway utilization was kept at or close to 100%, with a persistent departure queue as well.
Runway utilization was maintained consistently during the metering periods, with the exception of a three-minute interval on the third day of metering. On this instance, three flights were expected to be at the departure runway, ready for takeoff. Two of these flights received EDCTs as they taxied (and so were not able to takeoff at the originally predicted time), and the third flight was an international departure that had longer than expected pre-taxi procedures. Learning from this experience, we were diligent in ensuring that EDCTs were gathered as soon as they were available, preferably while the aircraft were still at the gate. In addition, we incorporated the longer taxi-out times of international departures into our predictions. As a result of these measures, we ensured that runway utilization was maintained over the remaining duration of the trial. It is worth noting that the runway was “starved” in this manner for only 3 minutes in over 37 hours of metering pushbacks, demonstrating the ability of the approach to adapt to the uncertainties in the system.
16 17 18 19 20 0 5 10 15 20 25 30
Avg. taxiïout time (in min, per 15ïmin interval)
Taxi time (minutes)
Local time at start of taxi
Aug26 Aug17 16 17 18 19 20 0 2 4 6 8 10 12 14 16 18 20 Local time
Number of jets taxiing out
Avg. number of jets taxiingïout (per 15ïmin interval)
Aug26 Aug17
Figure 13: Ground congestion (top) and average taxi-out times (bottom) per 15-minutes, for (blue) a day with pushback rate control, and (red) a day with similar demand, same runway configuration and weather conditions, but without metering. Delay attributed to EDCTs has been removed from the taxi-out time averages.
5
Benefits analysis
Table 2 presents a summary of the gate-holds on the eight demo periods with sufficient congestion for metering pushbacks. As mentioned earlier, we had no significant congestion when the airport was operating in its most efficient configuration (4L, 4R | 4L, 4R, 9).
A total of 247 flights were held, with an average gate-hold of 4.3 min. During the most congested periods, up to 44% of flights experienced gate-holds. By maintaining runway utilization, we tradeoff taxi-out time for time spent at the gate with engines off, as illustrated in Figures 9 and 11.
5.1 Translating gate-hold times to taxi-out time reduction
Intuitively, it is reasonable to use the gate-hold times as a surrogate for the taxi-out time reduction, since runway utilization was maintained during the demonstration of the control strategy. We confirm this hypoth-esis through a simple “what-if” simulation of operations with and without metering. The simulation shows that the total taxi-out time savings equaled the total gate-hold time, and that the taxi time saving of each flight was equal, in expectation, to its gate holding time. The total taxi-out time reduction can therefore be
16 18 20 0 20 40 60 80 100
Runway 33L (15 min intervals)
Local time (hrs)
% Utilization DeparturesArrivals
Crossings/Taxi Approach Hold 16 18 20 0 1 2 3 4 5 6 7 8 Local time (hrs) Queue size 33L departure queue
Figure 14: Runway utilization plots (top) and queue sizes (bottom) for the primary departure runway (33L) during the field test on September 10, 2010. These metrics are evaluated through the analysis of ASDE-X data.
approximated by the total gate-hold time, or 1077 minutes (18 hours).
In reality, there are also second-order benefits due to the faster travel times and the nonlinear effects of shorter departure queues due to reduced congestion, but these effects are neglected in the preliminary analysis.
5.2 Fuel burn savings
Supported by the analysis presented in Section 5.1, we conduct a preliminary benefits analysis of the field tests by using the gate-hold times as a first-order estimate of taxi-out time savings. This assumption is also supported by the taxi-out time data from the tests, such as the plot shown in Figure 9. Using the tail number of the gate-held flights, we determine the aircraft and engine type and hence its ICAO taxi fuel burn index [12]. The multiplicative product of the fuel burn rate index, the number of engines, and the gate-hold time gives us an estimate of the fuel burn savings from the metering. We can also account for the use of Auxiliary Power Units (APUs) at the gate by using the appropriate fuel burn rates [13]. This analysis (not accounting for benefits from reduced congestion) indicates that the total taxi-time savings were about 17.9 hours, which resulted in fuel savings of 12,000-15,000 kg, or 3,900-4,900 US gallons (depending on whether APUs were
Table 2: Summary of gatehold times for the eight demo periods with significant metering and gate-holds.
Date Period Configuration
No. of Average Total
gate- gatehold gatehold
holds (min) (min)
1 8/26 4.45-8PM 27,22L | 22L,22R 63 4.06 256 2 8/29 4.45-8PM 27,32 | 33L 34 3.24 110 3 8/30 5-8PM 27,32 | 33L 8 4.75 38 4 9/02 4.45-8PM 27,22L | 22L,22R 45 8.33 375 5 9/06 5-8PM 27,22L | 22L,22R 19 2.21 42 6 9/07 5-7.45PM 27,22L | 22L,22R 11 2.09 23 7 9/09 5-8PM 27,32 | 33L 11 2.18 24 8 9/10 5-8PM 27,32 | 33L 56 3.7 207 Total 247 4.35 1075
on or off at the gate). This translates to average fuel savings per gate-held flight of between 50-60 kg or 16-20 US gallons, which suggests that there are significant benefits to be gained from implementing control strategies during periods of congestion. It is worth noting that the per-flight benefits of the pushback rate control strategy are of the same order-of-magnitude as those of Continuous Descent Approaches in the presence of congestion [14], but do not require the same degree of automation, or modifications to arrival procedures.
5.3 Fairness of the pushback rate control strategy
Equity is an important factor in evaluating potential congestion management or metering strategies. The pushback rate control approach, as implemented in these field tests, invoked a First-Come-First-Serve policy in clearing flights for pushback. As such, we would expect that there would be no bias toward any airline with regard to gate-holds incurred, and that the number of flights of a particular airline that were held would be commensurate with the contribution of that airline to the total departure traffic during metering periods. We confirm this hypothesis through a comparison of gate-hold share and total departure traffic share for different airlines, as shown in Figure 15. Each data-point in the figure corresponds to one airline, and we note that all the points lie close to the 45-degree line, thereby showing no bias toward any particular airline. We note, however, that while the number of gate-holds that an airline receives is proportional to the number of its flights, the actual fuel burn benefit also depends on its fleet mix. Figure 16 shows that while the taxi-out time reductions are similar to the gate-holds, some airlines (for example, Airlines 3, 4, 5, 19 and 20) benefit from a greater proportion of fuel savings. These airlines are typically ones with several heavy jet departures during the evening push.
6
Observations and lessons learned
We learned many important lessons from the field tests of the pushback rate control strategy at BOS, and also confirmed several hypotheses through the analysis of surveillance data and qualitative observations. Firstly, as one would expect, the proposed control approach is an aggregate one, and requires a minimum level of traffic to be effective. This hypothesis is further borne by the observation that there was very little metering in the most efficient configuration (4L, 4R | 4L, 4R, 9). The field tests also showed that the proposed technique is capable of handling target departure times (e.g., EDCTs), but that it is preferable to get EDCTs while still at gate. While many factors drive airport throughput, the field tests showed that the pushback rate control
0% 5% 10% 15% 20% 25% 0% 5% 10% 15% 20% 25% Pe rc en ta g e o f g ate h el d fl ig h ts
Percentage of traffic during metering periods Percentage of Gateheld Flights 45 deg line
Figure 15: Comparison of gate-hold share and total departure traffic share for different airlines.
0% 2% 4% 6% 8% 10% 12% 14% 16% Ai rli ne 1 Ai rli ne 2 Ai rli ne 3 Ai rli ne 4 Ai rli ne 5 Ai rli ne 6 Ai rli ne 7 Ai rli ne 8 Ai rli ne 9 Ai rli ne 10 Ai rli ne 11 Ai rli ne 12 Ai rli ne 13 Ai rli ne 14 Ai rli ne 15 Ai rli ne 16 Ai rli ne 17 Ai rli ne 18 Ai rli ne 19 Ai rli ne 20 Ai rli ne 21 Ai rli ne 22 Ai rli ne 23 Ai rli ne 24 Ai rli ne 25 Ai rli ne 26
Percentage of Total Aircraft Held Percentage of Total Delay Minutes Percentage of Total Fuel Burned
Figure 16: Percentage of gate-held flights, taxi-out time reduction and fuel burn savings incurred by each airline.
approach could adapt to variability. In particular, the approach was robust to several perturbations to runway throughput, caused by heavy weight category landings on departure runway, controllers choice of runway crossing strategies, birds on runway, etc. We also observed that when presented with a suggested pushback rate, controllers had different strategies to implement the suggested rate. For example, for a suggested rate of 2 aircraft per 3 minutes, some controllers would release a flight every 1.5 minutes, while others would release two flights in quick succession every three minutes. We also noted the need to consider factors such
as ground crew constraints, gate-use conflicts, and different taxi procedures for international flights. By accounting for these factors, the pushback rate control approach was shown to have significant benefits in terms of taxi-out times and fuel burn.
7
Summary
This paper presented the results of the demonstration of a pushback rate control strategy at Boston Logan International Airport. Sixteen demonstration periods between August 23 and September 24, 2010 were conducted in the initial field trial phase, resulting in over 37 hours of research time in the BOS tower. Results show that during eight demonstration periods (about 24 hours) of active metering of pushback rates, over 1077 minutes (nearly 18 hours) of gate holds were experienced during the demonstration period across 247 flights, at an average of 4.3 minutes of gate hold per flight (which correlated well to the observed decreases in taxi-out time). Preliminary fuel burn savings from gate-holds with engines off were estimated to be between 12,000-15,000 kg (depending on whether APUs were on or off at the gate).
Acknowledgments
We would like to acknowledge the cooperation and support of the following individuals who made the demo at BOS possible: Deborah James, Pat Hennessy, John Ingaharro, John Melecio, Michael Nelson and Chris Quigley at the BOS Facility; Vincent Cardillo, Flavio Leo and Robert Lynch at Massport; and George Ingram and other airline representatives at the ATA. Alex Nakahara provided assistance in computing the preliminary fuel burn savings from the gate-hold data, and Regina Clewlow, Alex Donaldson and Diana Michalek Pfeil helped with tower observations before and during the trials. We are also grateful to Lourdes Maurice (FAA) and Ian Waitz (MIT) for insightful feedback on the research, and James Kuchar, Jim Eggert and Daniel Herring of MIT Lincoln Laboratory for their support and help with the ASDE-X data.
References
[1] I. Simaiakis and H. Balakrishnan, “Analysis and control of airport departure processes to mitigate congestion impacts,” Transportation Research Record: Journal of the Transportation Research Board, pp. 22–30, 2010.
[2] C. Cros and C. Frings, “Alternative taxiing means – Engines stopped,” Presented at the Airbus work-shop on Alternative taxiing means – Engines stopped, 2008.
[3] E. R. Feron, R. J. Hansman, A. R. Odoni, R. B. Cots, B. Delcaire, W. D. Hall, H. R. Idris, A. Muhar-remoglu, and N. Pujet, “The Departure Planner: A conceptual discussion,” Massachusetts Institute of Technology, Tech. Rep., 1997.
[4] N. Pujet, B. Delcaire, and E. Feron, “Input-output modeling and control of the departure process of congested airports,” AIAA Guidance, Navigation, and Control Conference and Exhibit, Portland, OR, pp. 1835–1852, 1999.
[5] F. Carr, “Stochastic modeling and control of airport surface traffic,” Master’s thesis, Massachusetts Institute of Technology, 2001.
[6] P. Burgain, E. Feron, J. Clarke, and A. Darrasse, “Collaborative Virtual Queue: Fair Management of Congested Departure Operations and Benefit Analysis,” Arxiv preprint arXiv:0807.0661, 2008. [7] P. Burgain, “On the control of airport departure processes,” Ph.D. dissertation, Georgia Institute of
Technology, 2010.
[8] I. Simaiakis and H. Balakrishnan, “Queuing Models of Airport Departure Processes for Emissions Reduction,” in AIAA Guidance, Navigation and Control Conference and Exhibit, 2009.
[9] ——, “Departure throughput study for Boston Logan International Airport,” Massachusetts Institute of Technology, Tech. Rep., 2011, No. ICAT-2011-1.
[10] I. Simaiakis, “Modeling and control of airport departure processes for emissions reduction,” Master’s thesis, Massachusetts Institute of Technology, 2009.
[11] Federal Aviation Administration, “Fact Sheet Airport Surface Detection Equipment, Model X (ASDE-X),” October 2010.
[12] International Civil Aviation Organization, “ICAO Engine Emissions Databank,” July 2010.
[13] Energy and Environmental Analysis, Inc., “Technical data to support FAA’s circular on reducing emis-sions for commercial aviation,” September 1995.
[14] S. Shresta, D. Neskovic, and S. Williams, “Analysis of continuous descent benefits and impacts during daytime operations,” in 8th USA/Europe Air Traffic Management Research and Development Seminar (ATM2009), Napa, CA, June 2009.
![Figure 1: Regression of the departure throughput as a function of the number of aircraft taxiing out, param- param-eterized by the arrival rate for 22L, 27 | 22L, 22R configuration, under VMC [9].](https://thumb-eu.123doks.com/thumbv2/123doknet/14675108.557775/4.918.213.700.106.483/figure-regression-departure-throughput-function-aircraft-eterized-configuration.webp)

![Figure 3: Regression of the takeoff rate as a function of the landing rate, parameterized by the number of props in a 15-minute interval for 22L, 27 | 22L, 22R configuration, under VMC [9].](https://thumb-eu.123doks.com/thumbv2/123doknet/14675108.557775/6.918.210.702.109.435/figure-regression-takeoff-function-landing-parameterized-interval-configuration.webp)
![Figure 4: Regression of the jet takeoff rate as a function of the number of departing jets on the ground, parameterized by the number of arrivals for 22L, 27 | 22L, 22R configuration, under VMC [9].](https://thumb-eu.123doks.com/thumbv2/123doknet/14675108.557775/7.918.211.700.105.507/figure-regression-takeoff-function-departing-parameterized-arrivals-configuration.webp)