PFC/JA-81-28
A DENSITY THRESHOLD FOR MHD ACTIVITY IN ALCATOR C R. S. Granetz
Plasma Fusion Center
Massachusetts Institute of Technology Cambridge, MA 02139
December 1981
This work was supported by the U. S. Department of Energy Contract No. DE-AC02-78ET51013. Reproduction, translation, publication, use and dis-posal, in whole or in part by or for the United States government is per-mitted.
By acceptance of this article, the publisher and/or recipient acknowledges the U. S. Government's right to retain a non-exclusive, royalty-free license in and to any copyright covering this paper.
A Density Threshold for MHD Activity in Alcator C
R. S. Granetz
MT Rasma Fusion Center and Dept. of Physicm
Experimental measurements of magnetic fluctuations arising from resistive MHD tear-ing modes reveal unexpected behavior in Alcator C. After the plasma current has risen to its steady state level, no significant NMHD activity is observed unless the electron density is above a threshold value, Y. For a given toroidal field, ffc is remarkably repeatable. We find f to be proportional to B2 and independent of Ip.
Resistive MHD theory predicts a class of instabilities which cause helical filimentation of the equilibrium plasma current resulting in the formation of magnetic island structures in the flux contours. These tearing modes have been the subject of intense theoretical and experimental study in recent years, owing to their implications in energy confinement1, current diffusion2, and major disruptions3. From elementary resistive theory, the instability criterion is found to be:
A'>O (0)
where A' is defined as the relative jump in the radial derivative of
Ir
across the tearing layer at the resonaht surface. If B is defined in terms of a perturbed flux function:Br !2!,(r)lei(n ) 0~ _L (2)
r Or
80 )
A,+=
t,-. (3)where e is the narrow tearing layer width. In steady state, A'is found by solving the differential equation:
m poR9J5
r ) I = (4)
r r 2 n - q ( r )
subject to proper boundary conditions. Equation (4) is for a cylindrical model of the plasma and is derived by operating with 1- V X on the equilibrium pressure balance equation: 0 = J X B - Vp, substituting in equation (2), and linearizing. Note that the stability criterion for
tearing modes is shown to depend aldy on the equilibrium current profile, J(r), the toroidal magnetic field, and geometric constants. NM.explicit dependence on electron density is predicted and strong dependence on the total plasma current, Ip, is expected.
On Alcator C, a novel instrument known as the m-spectrum analyzer4 is used to study fluctuations of the poloidal magnetic field at the vacuum wall due to magnetic islands. The device simultaneously yields the amplitudes and rotation frequencies of the m = 1, 2, 3, 4, and 5 modes in real time for the entire duration of the discharge. The time response to changes in mode amplitude is on the order of -100 jpsec. For a typical Alcator plasma shot, the initial
current rise phase lasts 150 msec and is sometimes accompanied by complicated MHD activity, although just as often there are no measurable fluctuations. However, that issue will not be addressed here; instead this paper will concentrate on the portion of the discharge where the current has reached its quasi-steady state plateau. This period may last up to 300 msec and electron cyclotron emission measurements indicate that the temperature profile is always fit by a Gaussian to within experimental error, provided the soft x-ray emission is sawtootfiing'. In Alcator C, where Z.ff(r) es constant0, one can assume J(r)-T 3/2(r) and use this (xperimental
profile in equation (4). Solving for the m = 2/n = I perturbed flux function, one finds that
A' > 0 for the range of limiter q-values achieved so far. Therefore we expect to see m = 2 magnetic islands throughout the steady state portion of the discharge. It is pointed out however, that equation (4) is sensitive to subtle changes in OJz/Or, especially near the singular surface were the denominator vanishes. The electron cyclotron diagnostic may not have the resolution to detect such effects:
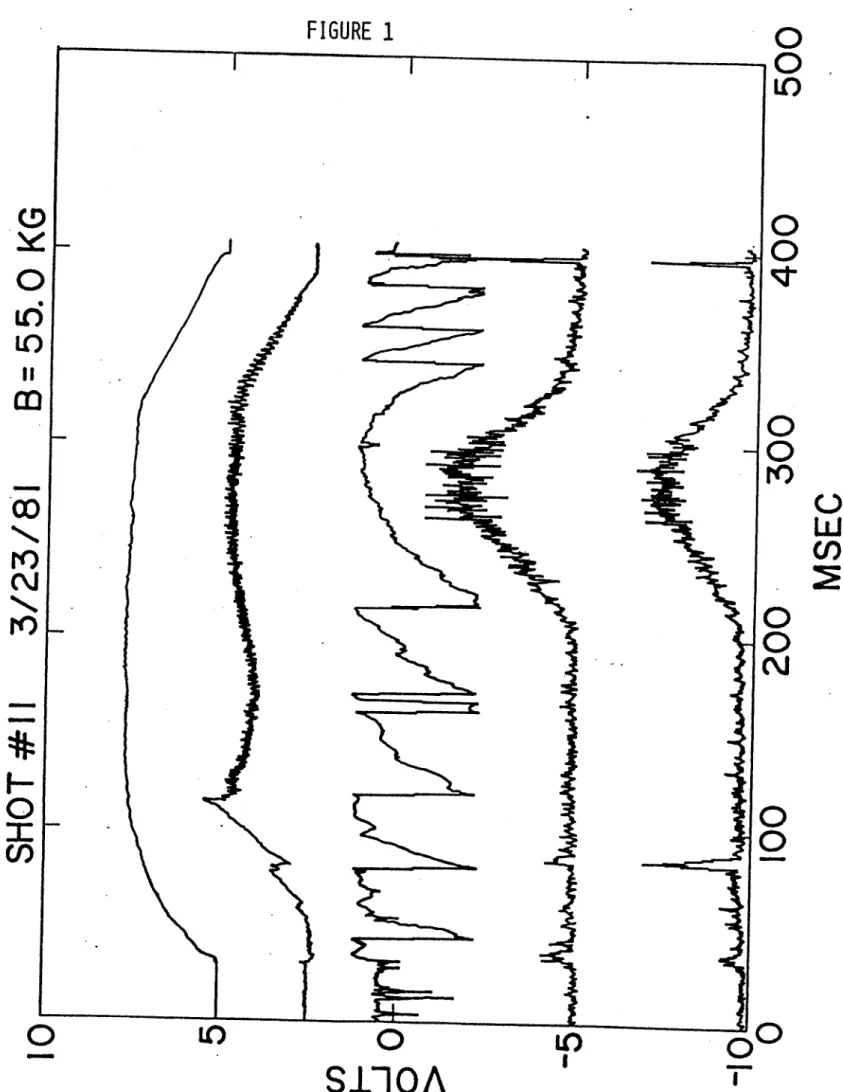
This predicted behavior is not experimentally observed.. Figure 1 shows a typical hydrogen discharge at 55 kG. The lower traces show the amplitude of R4 (= wA,) for the m = 2 and m = 3 modes. Note the absence of any significant MHD activity during the current plateau
until t = 205 msec. When the line average density reaches 2.4 X 101 /cm 3 (-4.2 fringes), m = 2 and m = 3 modes are detected and their amplitudes then roughly follow the density as it continues to rise above the threshold and then fall. The m = 2 maximum corresponds to a 6.4 gauss perturbation. Only these two mode numbers show appreciable amplitude. This phenomenon is quite repeatable; virtually every H2 shot which is sawtoothing will have m = 2 and 3 magnetic fluctuations during the steady state only if the line average density is above
-= 2.4
X
1014 /cm 3, with a remarkably small standard deviation in Ac of only ±10%. The same behavior is also seen in deuterium discharges, although the standard deviation of ffC is±20%.
The C machine is also commonly run at a toroidal field of 78 kG. Here the observed MHD behavior is qualitatively the same as that at 55 kG, except that the threshold density, FIe is at 4.8 x 10¹⁴ /cm 3. Again this threshold value is quite repeatable. This suggests the possibility of a magnetic field dependence of the density threshold for MIlD activity. The Alcator C tokamak is an ideal machine for doing toroidal field scans and the resulting data are shown in figure 2. The magnetic field was varied by more than a factor of three, from 30 kG to nearly 100 kG. The vertical bars show the standard deviation of Th- at 55 and 78 kG, where
there are too many data points to plot individually. The only selection criteria for this data are: (a) the shot exhibited sawtoothing soft x-ray emission, and (b) the threshold density was reached during the current plateau. The solid curve is a bist-fit quadratic:
ftc(10'4 /cm 3) = 7.9 X 10~ 4B2(kG2) (5)
A straight line fit cannot be absolutely ruled out; however, a least-squares fit would intercept
the horizontal axis at 30 kG rather than the origin. This would mean that at low fields, m = 2 and 3 activity should be seen at any density-a prediction which is clearly not reflected in the trend of the data near 30 kG. Over the entire range of this data, the value of f/B 2 at the start
of MHD activity has a standard deviation of only 14%. The plasma /, which is proportional to this constant times the temperature, varies from 0.5% to 0.8% on axis and the poloidal beta ranges between 0.25-0.50.
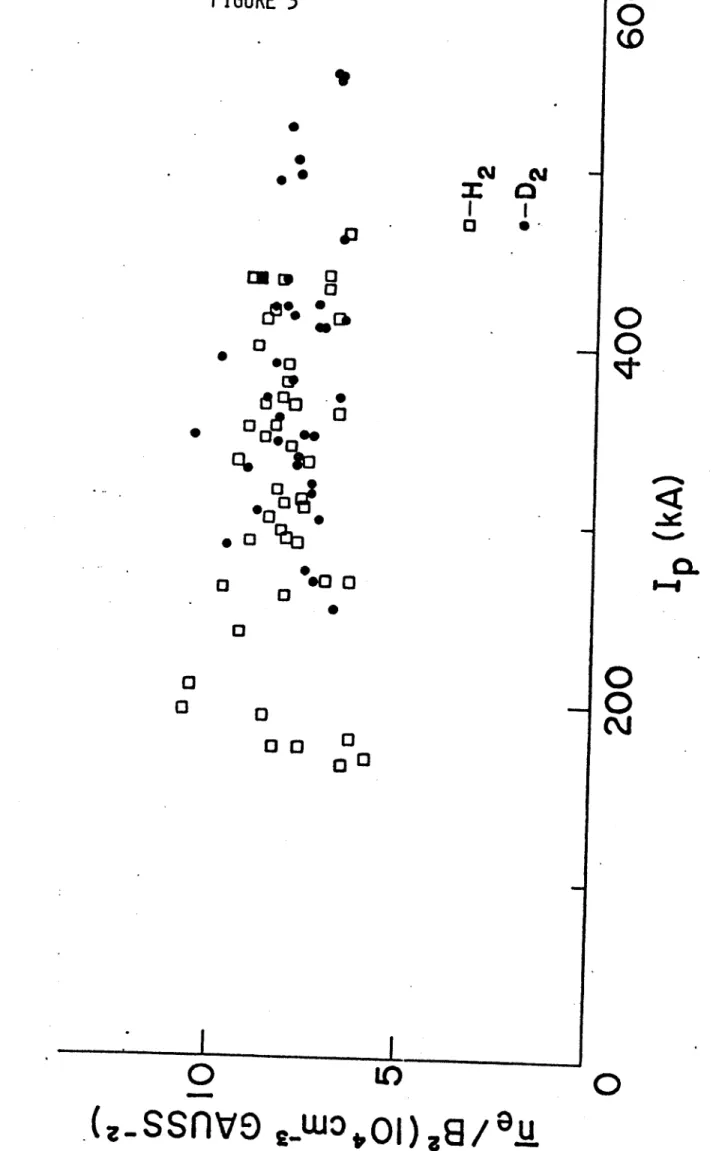
As stated previously, MHD activity is expected to be a function of plasma current. In order to quantify this dependence the limiter q was varied from 2.5 to 4.5 at 55 kG and the plasma current was varied from 167 to 550 kiloamps over the enftire range of data represented in figure 2. The unexpected result is displayed in figure 3. No dependence of the threshold effect on plasma current is detected.
The resolution of this surprising paradox is not obvious, given the MHD tearing theory presented here. The simplest hypothesis for explaining the absence of magnetic islands below
ke is to assume that the modes are indeed present, but just not rotating. The magnetic pickup
loops would not detect the instabilities in this case. As the density is raised, some unspecified non-ideal physics might cause the stationary islands to suddenly begin rotating and therefore be observed. But this hypothesis is not supported by the measured frequency data. Typically a large rotation frequency is observed as soon as measurable MUD activity is detected. No tendency for the mode frequency to build up from a slow value is observed in most cases. Given
the fact that BO rises slowly from noise level to finite amplitude, but rotation frequency does not, one can only conclude that PO must also grow slowly from the noise level. Therefore the measurements do not support the hypothesis that large, stationary magnetic islands exist below the threshold density.
Three possibilities remain for explaining the MHD density threshold effect: (1) other non-ideal terms must be added to the resistive MHD model, (2) the instability is not a tearing mode, and (3) a subtle, unmeasurable dependence of the current profile on the line average density. The theoretical effects of non-ideal physics have been examined to determine their role in Alcator C plasmas. These include diamagnetic terms7, collisionality corrections8, finite beta effects9, toroidicity0, etc. In every case it is found that either the non-ideal terms modify the growth rate but do not change the stability criterion (finite gyroradius effects, for example), or they alter the stability criterion, but in an opposite sense to what is measured. (Ref
[91
predicts that finite 8 in the Alcator C regime should be stabilizing: A' > A(() > 0.) The possibility that a pressure-driven instability is being observed, rather than A resistive tearing mode, is most unlikely because of the relatively low beta values obtained with only ohmic heating. Ballooning modes are not expected at the peak O's of 0.5 to 0.8% typical in Alcator C.This leaves the hypothesis that the density dependence of MHD tearing modes in Alcator C is simply due to an indirect effect on the plasma current profile. What is so surprising is the reproducibility of the effect, the small standard deviation in ffe, and the clear dependence on toroidal field. If this hypothesis is correct, the precise, repeatable behavior of MHD activity in Alcator C indicates that (for ohmically heated discharges satisfying the two criteria previously mentioned) the physical processes determining the shape of the equilibrium current profile must be particularly simple and straightforward.
There is indirect experimental evidence that profile shapes are important in Alcator. During the current rise and fall, when J(r) is substantially.different from the steady state, the
value of f i is reduced. In addition, MHD activity has been triggered below ie by puffing in a large pulse of impurity gas (N2) during the current plateau. We are currently planning an
improved electron cyclotron emission experiment having a much higher spatial resolution in an attempt to detect subtle effects of h.igh densities on Te(r).
It is unclear whether this type of coupling between density and MHD is only a quirk of the Alcator C deVice or whether it occurs in other tokamaks as well. Similar behavior has recently been seen on the WVII-A stelleratorti. It is noted that the threshold density is relatively high for any given B-field and this may explain the absence of such observations in other experiments. For example, during ohmically heated discharges in PLT, the density is in the range 0.2 - 0.6 X 10¹⁴ /cm 3 and no m = 2 activity is detected12. Perhaps a higher density is needed to trigger tearing mode instability.
The threshold effect plays an important role for major disruptions in Alcator C-it divides these events into two distinct classes. For disruptions which occur at densities well above f, m = 2 and m = 3 modes are seen to grow to large amplitudes prior to the disruption. This behavior certainly could agree with the present theories of disruptions; namely the growth and overlap of large magnetic islands causing ergotic field lines and rapid loss of confinement13. However, on disruptions below ne, no measurable magnetic perturbations are detected prior to the current termination. A careful examination shows density and soft x-ray anomalies about a millisecond before the disruption. No oscillatory behavior is seen on the Mirnov loops. At the time the current begins falling, magnetic activity, which is detected on all five channels of the m-spectrum analyzer, rises from noise level to saturation in under 200 psec. Since the non-linear growth rate of island width is14:
-- ~--- c:: 2 mm/nsec (6)
the pickup is assumed to be indicative of a broad spectrum of magnetic fluctuations caused by the rapidly collapsing current column. We presently have no explanation for the cause of disruptions below itc, since MHD activity apparently does not play a role here.
In conclusion, a density threshold for MHD activity in Alcator C has been observed. The threshold value is remarkably repeatable and increases with toroidal field.
References
1B. Carreras, B.V. Waddell, H.R. Hicks, Nucl. Fusion 19, 1423 (1979). 2
R.S. Granetz, I.H. Hutchinson, D.O. Overskei, Nucl. Fusion 19, 1587 (1979).
3D.C. Robinson, K. McGuire, Nucl. Fusion 19, 115 (1979).
4R.S. Granetz, Rev. Sci. Inst. 52, 1332 (1981).
5S. Fairfax et at., in Rasma Physica and Cbnrdled Nuclear }ision Research (Proc. 81 Int. Conf., Brussels, 1980) IAEA Vol. 1, Vienna 439 (1981).
6M.E. Foord, E.S. Marmar, J.L. Terry, "Multichannd Light Detector System for Visb&
Continuum Measurements on Alcator C," submitted for publication in Rev. Sci. Inst., Nov. 1981.
7D. Biskamp, Nucl. Fusion 19, 777 (1979).
8
J.F. Drake and Y.C. Lee, Phys. Rev. Lett. 39, 453 (1977)..
9J.A. Wesson, Nucl. Fusion 18, 87 (1978).
10B.A. Carreras, M.N. Rosenbluth, H.R. Hicks, Phys. Rev. Lett. 46, 1131 (1981).
IIWVII-A Team, Nucl. Fusion 20, 1093 (1980); R. Jaenicke, private communication, Oct. 1981.
12K. McGuire, private communication, Oct. 1981.
13B.V. Waddell, B. Carreras, H.R. Hicks, J.A. Holmes, and D.K. Lee, Phys. Rev. Lett.
41, 1386 (1978).
Figure captions
FIG. 1. Plasma discharge illustrating the threshold effect. From top to bottom the traces are: plasma current (125 ka/v), soft x-ray emission, line average density (0.57 X 1014 cm--3/fringe), m = 2 and m = 3 amplitudes (24 gauss-kHz/v).
FIG. 2. Density at which MHD activity starts versus toroidal field.