HAL Id: hal-01872699
https://hal.archives-ouvertes.fr/hal-01872699
Submitted on 12 Sep 2018HAL is a multi-disciplinary open access archive for the deposit and dissemination of sci-entific research documents, whether they are pub-lished or not. The documents may come from teaching and research institutions in France or abroad, or from public or private research centers.
L’archive ouverte pluridisciplinaire HAL, est destinée au dépôt et à la diffusion de documents scientifiques de niveau recherche, publiés ou non, émanant des établissements d’enseignement et de recherche français ou étrangers, des laboratoires publics ou privés.
imaging from submicron structures in brain slices
Luiza Filipis, Karima Ouares, Philippe Moreau, Dimitrii Tanese, Valeria
Zampini, Andrea Latini, Chun Bleau, Charlie Bleau, Jeremy Graham, Karima
Ait Ouares, et al.
To cite this version:
Luiza Filipis, Karima Ouares, Philippe Moreau, Dimitrii Tanese, Valeria Zampini, et al.. A novel multisite confocal system for rapid Ca 2+ imaging from submicron structures in brain slices. Journal of Biophotonics, Wiley, 2018, 11 (3), �10.1002/jbio.201700197�. �hal-01872699�
1
Article type: Original Paper
A novel multisite confocal system for rapid Ca
2+imaging from
submicron structures in brain slices
Luiza Filipis1,2, Karima Ait Ouares1,2, Philippe Moreau1, Dimitrii Tanese3, Valeria
Zampini3, Andrea Latini4, Chun Bleau5, Charlie Bleau6, Jeremy Graham7, Marco
Canepari1,2,8,*
*Corresponding Author: E-mail: [email protected]
1
Laboratory for Interdisciplinary Physics, UMR 5588 CNRS and Université Grenoble Alpes and, 38402 Saint Martin d'Hères, France.
2
Laboratories of Excellence, Ion Channel Science and Therapeutics, France.
3
Wavefront-Engineering Microscopy Group, Neurophotonics Laboratory, UMR8250 CNRS and Paris Descartes University, Paris, France.
4
CrestOptics Spa, 00167 Rome, Italy
5
RedshirtImaging LLC, Decatur, GA30030, USA
6
SciMeasure Analytical Systems Inc, Decatur, GA 30030, USA
7
Cairn Research Ltd, Faversham ME13 8UP, United Kingdom
8
Institut National de la Santé et Recherche Médicale (INSERM), France.
2
Abstract
In brain slices, resolving fast Ca2+ fluorescence signals from submicron structures is
typically achieved using two-photon or confocal scanning microscopy, an approach that limits the number of scanned points. The novel multiplexing confocal system presented here overcomes this limitation. This system is based on a fast spinning disk, a multimode diode laser and a novel high-resolution CMOS camera. The spinning disk, running at 20,000 rpm, has custom-designed spiral pattern that maximises light collection while rejecting out-of-focus fluorescence to resolve signals from small neuronal compartments. Using a 60X objective, the camera permits acquisitions of tens of thousands of pixels at resolutions of ~250 nm per pixel in the kHz range with 14 bits of digital depth. The system can resolve physiological Ca2+ transients from submicron structures at 20-40 µm
below the slice surface, using the low affinity Ca2+ indicator Oregon Green BAPTA-5N.
In particular, signals at 0.25-1.25 kHz were resolved in single trials, or through averages of a few recordings, from dendritic spines and small parent dendrites in cerebellar Purkinje neurons. Thanks to an unprecedented combination of temporal and spatial resolution with relatively simple implementation, it is expected that this system will be widely adopted for multisite monitoring of Ca2+ signals.
1. Introduction
Ca2+ fluorescence imaging allows the detailed investigation of biochemical processes
that are triggered by transient elevation of intracellular Ca2+. In particular, Ca2+ transients
can be recorded from individual neurons in brain slices to investigate local mechanisms of physiological importance.[1] In these recordings, the number of detected photons necessary to resolve fluorescence changes with adequate signal-to-noise ratio (S/N)
3
determines the dimension of emitting sites or the duration of exposure time-window.[2] Hence, at a given acquisition rate, the smallest useful detection element is the one from which the number of emitted photons allows the signal to be above the photon (shot) noise. Detection of fluorescence changes from structures ≤ 1 µm at temporal resolution of ~ 1 ms is satisfactory for investigating many physiological signals from relevant neuronal compartments in dendrites and axons. In addition, it is also crucial to monitor Ca2+
signals from many sites simultaneously. The most straightforward methodology involves uniformly illuminating the whole area of interest and recording Ca2+ fluorescence with a
fast camera (widefield imaging). In widefield imaging, the lateral resolution limit is theoretically given by 1.22·λem/NA, where NA is the numerical aperture of the objective
used and λem is the fluorescence emission wavelength.[3] Thus, objectives with NA ≥ 1
can ideally resolve signals from structures ≤ 1 µm at all visible wavelengths. This theoretical resolution limit is however compromised for fluorescence signals originating from structures in brain slices that are tens of microns below the slice surface. In this case, the tissue between the fluorescence-emitting structure and the slice surface scatters light decreasing spatial resolution and preventing the possibility of resolving signals from submicron structures.[4] A way to recover the original spatial resolution is to reject tissue scattered photons by mean of confocal microscopy.[5] Conventional confocal microscopy, performed by scanning a pinhole and recording fluorescence with a photomultiplier, can work at high acquisition rates by limiting the capture to line-scans or random-access scans.[6] In this approach, however, the exposure time and therefore the number of photons recorded in each point is inversely proportional to the number of scanned points. Thus, the number of photons necessary to provide the adequate S/N limits the number of scanned points or the sampling rate. One way to overcome these limitations is to use a spinning disk.[7] A rapidly spinning disk is positioned conjugate with the focal plane in
4
both illumination and detection pathways to scan a series of transparent pinholes over the field of view of a digital camera. This fast parallel-scan approach significantly reduces the instantaneous photon dose required and increases the acquisition rate. Using this approach, several systems were recently implemented for Ca2+ imaging in various
preparations.[7-10] In this article, we report the design and the assessment of a novel confocal system, based on a spinning disk specifically designed for rapid Ca2+ imaging
from submicron structures in brain slices. The pinhole array pattern was replaced with a spiral pattern that maximises emitted light detection while preserving the resolution in the order of the diffraction limit (see Materials and Methods). The high fluorescence excitation is obtained using a 1.2 W laser coupled to the spinning disk, with light detection at high spatial and temporal resolution achieved using a fast CMOS camera.
2. Materials and methods
2.1. Slice preparation, solutions and electrophysiology
Experiments were ethically carried out in accordance with European Directives 2010/63/UE on the care, welfare and treatment of animals. Procedures were reviewed by the ethics committee affiliated to the animal facility of the university (D3842110001). Transversal hippocampal and cerebellar sagittal slices (250 µm thick) were prepared from 21-35 postnatal days old mice (C57Bl6) following established procedures [11-12] with a Leica VT1200 (Leica, Wetzlar, Germany) and incubated at 37°C for 1 hour before use. The extracellular solution contained (in mM): 125 NaCl, 26 NaHCO3, 1 MgSO4, 3
KCl, 1 NaH2PO4, 2 CaCl2 and 20 glucose, bubbled with 95% O2 and 5% CO2. The
5
0.3 Tris-GTP, 12 Tris-Phosphocreatine, 20 HEPES, adjusted to pH 7.35 with KOH. The Ca2+ indicator Oregon Green BAPTA-5N (OG5N, KD=35µM) was added to the internal
solution at 2 mM. Patch-clamp recordings were made at 32-34°C using a Multiclamp amplifier 700A (Molecular Devices, Sunnyvale, CA) and signals acquired at 20 kHz using a USB-6221 board (National Instruments, Austin, TX). The measured membrane potential was corrected for junction potential (-11 mV) as previously estimated[13]. In experiments on cerebellar Purkinje neurons (PNs), either climbing fibre (CF) or parallel fibre (PF) excitatory postsynaptic potentials (EPSPs), were elicited by current pulses, of 5-20 µA amplitude and 100 µs duration delivered by a pipette. In experiments on CA1 hippocampal pyramidal neurons, action potentials were elicited by 2 ms current pulses through the patch pipette.
2.2. Detailed description of the confocal system
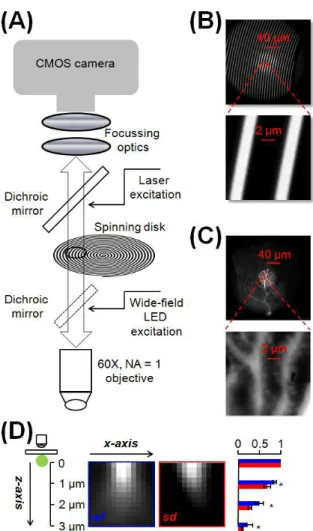
The system was mounted on a SliceScope microscope (Scientifica, Uckfield, UK) equipped with motorised XY translation stage, PatchStar manipulators and 60X Olympus water immersion objective (NA=1). The motorised Z translation allowed estimation of the depth of the recording plane from the slice surface. The microscope incorporated an OptoLED unit (Cairn Research, Faversham, UK) mounted on the Olympus epifluorescence unit to provide widefield illumination at 470 nm independent of the spinning disk. The system, illustrated in the scheme of Figure 1(A), is based on two units: 1. the spinning disk unit and 2. the CMOS camera.
2.2.1. Spinning disk unit
The spinning disk is a customised version of the X-Light, developed by CrestOptics Spa (Rome, Italy). This incorporates a disk which, instead of pinholes, has multiple sets of continuous spirals with the following structure: (a) 36 spirals; (b) spiral thickness of 90
6
µm; (c) spiral step of 16.2 mm; (d) spiral-to-spiral radial distance of 450 µm (Figure
1(B)). The disk was installed in the primary image plane of the microscope. The spiral
pattern was projected to the sample to scan the entire field of view 36 times per disk revolution. The modified disk unit was run at 20,000 rpm (333,33 revolution per second). Finally, the spinning disk was automated to move in and out of the light path to enable both confocal and widefield imaging in the same experiment. The spinning disk was coupled to a TriLine LaserBank (Cairn Research) through a Ø550 µm, 0.22 NA, SMA-SMA Fiber patch cable (Thorlabs, Newton, NJ). The laser head used was a multimode diode 465nm/1.2W (Ushio). A custom 25 mm focal length aspheric condenser (Cairn Research) was used at the output of the fibre to generate a concentrated and homogeneous illumination field of ~60 µm at the sample (Figure 1(C)). The fibre was stressed and vibrated to mix modes to reduce laser speckle and improve homogeneity. Finally, the whole confocal system was tested for optical sectioning performance against widefield illumination using 500 nm fluorescent beads attached to a coverslip (Figure
1(D)) and taking images at different depths below the focal plane of the bead with steps
of 250 nm (comparable to the pixel dimension). In N = 16 beads, fluorescence normalised to the value in the focal plane was 0.68 ± 0.09, 0.28 ± 0.09 and 0.10 ± 0.02 at 1 µm, 2 µm and 3 µm respectively in confocal imaging. These values were significantly different from 0.86 ± 0.04, 0.51 ± 0.10 and 0.22 ± 0.12 obtained in widefield imaging (p < 0.001, paired t-test), indicating a clear improvement in optical sectioning in confocal imaging.
2.2.2. CMOS camera
The camera is a DaVinci-2K (SciMeasure, Decatur, GA) which uses a low-noise 2k by 2k pixel CMOS sensor with traditional readout architecture and true on-chip binning. The flexible sensor and camera design allows low read-noise performance (<2.8e-) using either correlated double sampling (CDS) or non-destructive read (NDR) to subtract the
7
reset voltage. The large pixel size of 15µmX15µm gives a relatively high fill-factor and hence a native quantum efficiency of 65% without requiring microlenses. A single 14-bit A/D per readout channel is used to achieve high bit depth without the dual-amplifier stitching required in sCMOS cameras. 16 parallel readout channels are implemented to achieve high frame rates without compromising noise. This is the first use of this novel camera in CDS mode for high speed live-cell imaging, although an alternative configuration has been used for stochastic super resolution of fixed samples using NDR.[14] Within the present configuration, each pixel is mapped to collect light from a square of ~250 nm side. Data were acquired using Turbo-SM written in C by RedShirtImaging (Decatur, GA).
2.3. Optical recordings and analysis
Laser or LED Fluorescence excitation, was band-passed filtered at 469±17 nm (Semrock, Rochester, NY) and reflected towards the objective by a 495 nm longpass dichroic mirror (Chroma, Bellows Falls, VT). Emitted OG5N fluorescence was filtered at 525±25 nm (Chroma) before detection. Synchronisation of the camera with laser and LED illumination and with the electrophysiology was provided by a Master 9 (A.M.P.I., Jerusalem, Israel). The timing of synaptic stimulation or action potentials was set during the acquisition window to prevent jittering when averaging over 3-9 trials. Fluorescence signals were sometimes corrected for bleaching by subtraction of filtered trials without signal. Fluorescence signals were expressed as fractional changes of fluorescence (∆F/F0).
8
In the Results section we describe the temporal and the spatial performances of the system and we present two examples of measurements that can be achieved.
3.1. Temporal performance of the system
The temporal performance of the system relies on the characteristics of the CMOS, illustrated in the picture of Figure 2(A). The sensor (~3cmX3cm), is composed of 2048X2048 pixels. As depicted in Figure 2(A), the full-frame image array is divided into 16 rectangular 256X1024 pixel arrays processed in parallel. In our configuration, however, the field of view of the image covers around half of the sensor length, reducing the size of the acquired array to 1024X1024 pixels. The left image of Figure 2(B) shows the dendrite of a PN filled with 2 mM OG5N. This image was collected without the spinning disk in place using widefield LED illumination. The image on the right was recorded using laser illumination with the spinning disk. The maximal acquisition rate of the camera depends on the vertical dimension of the acquired pixel array. In the right image of Figure 2(B), several acquired arrays are outlined by coloured rectangles: 1024X1024 pixels (blue, maximal rate 200 frames/s); 1024X512 pixels (green, maximal rate 400 frames/s); 1024X256 pixels (red, maximal rate 800 frames/s); 1024X160 pixels (purple, maximal rate 1250 frames/s). Figure 2(C) shows a portion of the dendrite captured with the LED (left) or with the laser and the spinning disk (right). The coloured traces on the bottom of Figure 2(C) are the ∆F/F0 signals, averaged over the 40X40
pixels region shown with a yellow square on the right image of Figure 2(C), acquired at the maximal acquisition rates in single trials. These signals associated with a CF-EPSP illustrate generically the excellent quality of the signal at acquisition rates up to more than 1 kHz. The images in Figure 2(D) show a portion of the dendrite in panel (C). Three regions of 2X2 pixels (~0.25 µm2) from where fluorescence was averaged are indicated:
9
1 and 3 corresponding to two individual synaptic spines and 2 corresponding to the bulk
of the parent dendrite. Traces on the right report the corresponding ∆F/F0 signals at 1250
Hz, associated with a CF-EPSP, obtained by averaging three trials. In summary, these recordings demonstrate that our confocal system is capable of recording Ca2+ signals,
from structures < 1 µm, at frame intervals < 1 ms.
3.2. Spatial performance of the system
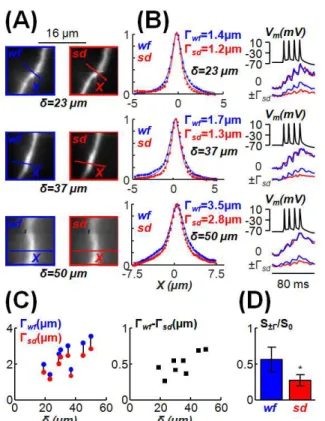
The spatial performance was assessed by analysing fluorescence profiles and transients in sequential recordings without or with the spinning disk (widefield vs confocal imaging). A first assessment was carried out in the initial part of apical dendrites from CA1 hippocampal pyramidal neurons, an approximately cylindrical structure. In
Figure (3A), images of three dendrites at 23, 37 and 50 µm depth from the slice surface
(δ) were obtained in widefield (wf) or confocal (sd) imaging. The X-line is positioned on the site of the dendrite in focus and the absolute intensity profile in Figure 3(B) was calculated by averaging fluorescence from 2X4 pixels regions and normalising the values to the maximum at X=0. The profile was fitted with a Lorentzian function
1
∙ Γ/2
X + ( ) (1).
The parameter Γ specifies the width of the intensity profile that depends on the dendrite thickness, but also on light scattering [15] and it is systematically larger in widefield imaging (Γwf) with respect to spinning disk imaging (Γsd), as shown in Figure 3(B). We
then computed ∆F/F0 associated with four action potentials at X=±Γsd for widefield and
confocal imaging and normalised the signals to those at X=0. As shown in the plots on the right of panel (B), the ∆F/F0 at ±Γsd was systematically smaller in confocal imaging.
Figure 3(C) reports the analysis of intensity profiles from 8 dendrites in 5 cells. Γ values
10
Whereas Γwf and Γsd also depend on the dendrite thickness, Γwf-Γsd is expected to depend
only on tissue scattering, providing an estimate of the improvement produced by the spinning disk. Thus, at ±Γsd, the normalised ∆F/F0 peak assesses the ability of the system
to resolve Ca2+ transients free of scattered light. Figure 3(D) reports the mean±SD of
normalised ∆F/F0 peak at ±Γsd, that was 0.27±0.07 in confocal imaging, significantly
smaller than 0.55±0.17 in widefield imaging (p<0.001, paired t-test). In summary, within 40 µm from the surface, the gain in spatial resolution quantified by Γwf-Γsd was between
200 and 600 nm. This result can be interpreted as an indication that, within 40 µm from the slice surface, our system can de-blur images to restore spatial resolution closer to the diffraction limit. Hence, in this δ range, we assessed the ability of the system to resolve signals from submicron structures by measuring ∆F/F0 associated with CF-EPSPs from
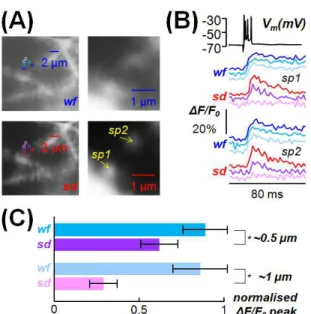
PN synaptic spines. Figure 4(A) shows widefield (wf) and confocal images (sd) of a PN dendrite at δ = 25 µm. Fluorescence was averaged over two regions of 2X2 pixels centred onto two spines in focus, and on regions at ~0.5 µm and ~1 µm from the edge of the spine-centred regions outside the cell. Figure 4(B) shows that, in widefield imaging, ∆F/Fo signals are comparable in size in spines and in the adjacent regions outside the cell.
In contrast, in confocal imaging, the ∆F/Fo signals were progressively smaller with the
distance from the spine, indicating scattered light elimination by the spinning disk. The same analysis was done in 48 spines in focus from six cells, with varying δ from 18 µm to 30 µm. Figure 4(C) reports the mean±SD of ∆F/Fo peaks at ~0.5 µ m and ~1 µm
distance from the cell, normalised to the peaks on the spine centres, in widefield and confocal imaging. In confocal imaging, the normalised peaks at ~0.5 µm and ~1 µm distance were 0.62±0.11 and 0.29±0.08 respectively, significantly smaller than 0.90±0.13 and 0.86±0.16 respectively in widefield imaging (p<0.001, paired t-test). In particular, the ~0.3 value at ~1 µm distance in confocal imaging, is within our ability to discriminate the
11
signal from noise as shown in the examples of Figure 4(B). This indicates that we can resolve Ca2+ signals from submicron structures in this δ range where this task cannot be
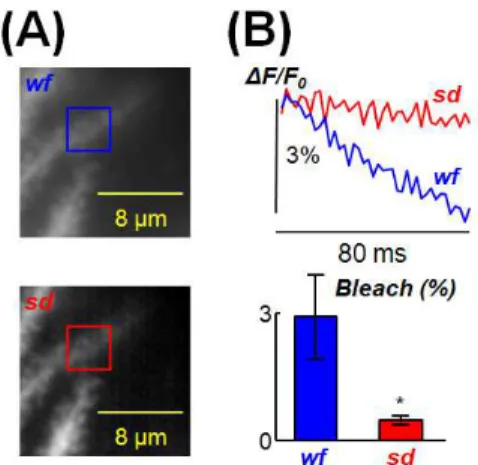
accomplished by widefield imaging. Another advantage of confocal imaging, with respect to widefield imaging, is the reduced bleaching. Dendrite of Figure 5(A) was exposed to laser illumination for 80 ms with the spinning disk at the maximal intensity, or without the spinning disk at reduced intensity to obtain a similar photon noise. As shown in the plots of Figure 5(B), dye bleaching reduced fluorescence by ~3 % in widefield imaging, but only by ~0.5 % in confocal imaging. In 7 cells tested, bleaching was 2.9 ± 1.0 % in widefield imaging, significantly larger than in spinning disk imaging (0.5 ± 0.1 %, p<0.001 paired t-test).
3.3. Examples
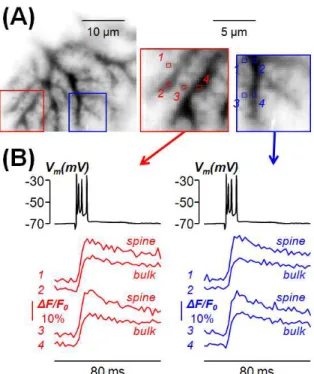
After evaluating the system, we describe two examples of the type of information accessible with this approach. In the cell of Figure 6(A), the Ca2+ signal associated with
the CF-EPSP was recorded at 500 Hz in two areas containing several dendritic branches and many spines. Such recordings permit exhaustive analysis of the amplitude and kinetics of Ca2+ transients in synaptic spines with respect to those in parent dendrites.
Figure 6(B) shows Ca2+ signals in four spines and four locations of the parent dendrites in the red and blue regions indicated in panel (A). These representative ∆F/F0 signals
indicate that the kinetics of the Ca2+ transient is systematically different in spines and
parent dendrites. In particular, Ca2+ signals in spines are larger and decay more rapidly
with respect to those in parent dendrites. This phenomenon may be due to the different surface-to-volume ratio of the two types of structure [16], as well as to different distributions of Ca2+ channels [17] or to Ca2+ binding proteins.[18] In the example of
12
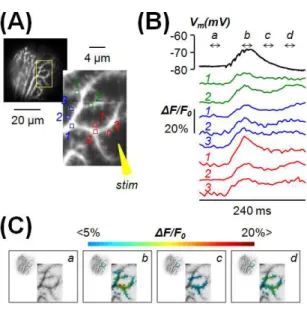
produced by activation of synaptic spines, the size and the extent of the Ca2+ transient
depends on the number and spatial distribution of activated PFs.[20] In this example, the train of five EPSPs produced a Ca2+ transient in the dendrites and spines over a region of
~100 µm2. As shown in Figure 7(B), the Ca2+ signal had two components: a fast
component nearly synchronous with the EPSPs recorded in the soma mediated by voltage-gated Ca2+ channels [20]; and a slower component mediated by metabotropic
glutamate receptors.[21] The false-colour scale images in Figure 7(C) illustrate the spatial profile of the signal at different time-windows of the recording; in particular images b and d correspond to the peak of the fast and slow components. As shown by these images and by the traces in panel (B), the two signals do not spatially overlap. In some dendrites or spines the fast component was larger than the slow component and in other sites it was the opposite. This result suggests that activation of metabotropic glutamate receptors does not spatially coincide with activation of voltage-gated Ca2+
channels, i.e. that PF-EPSPs may trigger different signalling pathways at different sites of the dendrite. The two examples in Figure 5 and 6 demonstrate the advantages of our system with respect to scanning systems where only limited numbers of selected submicron sites can be simultaneously analysed. Movies of these experiments are available online (MovieS1 and MovieS2).
4. Discussion and conclusions
The understanding of fast Ca2+ signaling in small axonal or dendritic compartments
and in synaptic spines is crucial in neurobiology.[22] In this article, we report a novel fast confocal system based on a spinning disk specifically designed to investigate Ca2+ signals
13
in submicron neuronal compartments in brain slices, in combination with patch clamp recordings.[23] To this purpose, other confocal solutions have been proposed in the past few years. A scanning confocal imaging system developed for this application and based on pinholes and digital micromirror devices could operate in the kHz range, but was limited in the number of recording points.[24] Similarly, the number of recording points could be effectively increased by using fixed pinholes arrays.[25] but this approach limits the exact selection of recording sites. The confocal system described in this report overcomes these limitations allowing recording of Ca2+ transients from continuous
structures in tens of thousands of pixels simultaneously. The system performs optimally in the common situation of structures at 20-40 µm below the slice surface, where widefield illumination fails discriminating signals with submicron resolution. Under these conditions, we achieved recordings at 250-1250 Hz from submicron structures. This was possible thanks to the combination of a fast custom-patterned disk, an efficient powerful laser and a fast and sensitive CMOS camera. The acquisition rate of these recordings is sufficient to detect fast Ca2+ transients associated with action potentials or synaptic
activity, although still insufficient to measure the kinetics of fast Ca2+ channels.[26-29]
The limitation of confocal imaging in acquisition speed is mainly set by the number of detected photons, which is reduced by light rejection. The way to obtain submicron resolution without rejection of emitted light is to use two-photon imaging that also allows axial confinement of fluorescence excitation.[30] Two-photon imaging without scanning microscopy is achievable by patterning the light shape to match the imaged structures, i.e. by performing two-photon holographic illumination.[31] In voltage imaging, signals have been recorded at several kHz from small neuronal compartments using one-photon holographic illumination.[32-33] In contrast, two-photon holographic illumination has been set for Ca2+ imaging in brain slices and in vivo, but without achieving recordings
14
from submicron structures in the kHz range.[34-37] Yet, it appears possible to achieve this resolution in the near future.
Whereas holographic two-photon imaging is potentially more powerful, the present confocal system has several advantages. It can be easily coupled to existing microscopes equipped for electrophysiology; it requires moderate knowledge of optics to implement measurements; it is economic requiring minimal maintenance. In particular, the multimode laser box allows other wavelengths for excitation of different indicators and is 5-10 times cheaper than lasers used in conventional confocal microscopes for equivalent power. Thus, this system offers an easy solution to measure fast Ca2+ transients in brain
slices with submicron resolution.
5. Supporting Information
MovieS1: Example of spatial profile of Ca2+ signal associated with one CF-EPSP.
MovieS2: Example of spatial profile of Ca2+ signal associated with a train of PF-EPSPs.
Acknowledgements
This work was supported by the Agence Nationale de la Recherche through: 1. Grant
WaveFrontImag, program number ANR-14-CE17-0006-01; 2. Labex Ion Channels Science and Therapeutics, program number ANR-11-LABX-0015; 3. National
Infrastructure France Life Imaging “Noeud Grenoblois” ; and by the Federation pour la
recherché sur le Cerveau (FRC) through the grant Espoir en tête (in partnership with
Rotary France). We thank Hanen Ziri for starting development of the software, Vanni Petrolli for preparing the beads and Irène Wang for useful discussions.
15
References
[1] F. Helmchen, K. Imoto, and B. Sakmann, Biophys. J. 70, 1069–1081 (1996). [2] R. Davies, J. Graham, and M. Canepari, J. Microsc. 251, 5–13 (2013).
[3] G.H. Patterson, Semin Cell Dev Biol. 20, 886–893 (2009).
[4] Z.F. Mainen, M. Maletic-Savatic, S.H. Shi, Y. Hayashi, R. Malinow, and K. Svoboda, Methods 18, 231–239 (1999).
[5] A. Fine, W.B. Amos, R.M. Durbin, and P.A. McNaughton, Trends Neurosci. 11, 346–351 (1988).
[6] P. Saggau, Curr. Opin. Neurobiol. 16, 543–550 (2006).
[7] C.G. Coates, D.J. Denvir, N.G. McHale, K.D. Thornbury, and M.A. Hollywood,
J. Biomed. Opt. 9, 1244–1252 (2004).
[8] Y. Takahara, N. Matsuki, Y. Ikegaya. J. Integr. Neurosci. 10, 121–129 (2011). [9] F. Ceriani, C.D. Ciubotaru, M., Bortolozzi, and F.Mammano, Methods Mol. Biol.
1427, 223–241 (2016).
[10] J.P. Nguyen, F.B. Shipley, A.N. Linder, G.S. Plummer, M. Liu, S.U. Setru, J.W. Shaevitz, and A.M. Leifer, Proc. Natl. Acad. Sci. USA 113, E1074–1081 (2016). [11] K.E. Vogt, S. Gerharz, J. Graham, and M. Canepari, J. Physiol. 589, 489–494
(2011).
[12] K.E. Vogt, S. Gerharz, J. Graham, and M. Canepari, PLoS ONE, 6, e24911 (2011). [13] M. Canepari, S. Willadt, D. Zecevic D and K.E. Vogt, Biophys. J. 98, 2032-2040
16
[14] S.F. Barnett, M. Snape, C.N. Hunter, M.A. Juárez, and A.J. Cadby, Sci. Rep. 7, 42313 (2017).
[15] T.R. Corle, C.H. Chou, and G.S. Kino, Opt. Lett. 11, 770-772 (1986). [16] M. Canepari, and F. Mammano, J. Neurosci. Methods 87, 1-11 (1999). [17] P. Isope, M.E. Hildebrand, and T.P. Snutch, Cerebellum 11, 651-665 (2012). [18] H. Schmidt, K.M. Stiefel, P. Racay, B. Schwaller, and J. Eilers J, J. Physiol. 551,
13-32 (2003).
[19] K. Vogt, and M. Canepari, Cerebellum 9, 284-290 (2010). [20] M. Canepari, and K. Vogt, PLoS ONE 3, e4011 (2008). [21] M. Canepari, and D. Ogden, J. Physiol. 573, 65-82 (2006). [22] C. Grienberger, and A. Konnerth, Neuron 73, 862-885 (2012). [23] G.J. Augustine, J. Neurosci. Methods 54, 163-169 (1994).
[24] V. Bansal , S. Patel, and P. Saggau, J. Biomed. Opt. 11: 34003 (2006). [25] T Tominaga, and Y. Tominaga, J. Neurophysiol. 110, 553-561 (2013).
[26] N. Jaafari, M. De Waard, M, and M. Canepari, Biophys. J. 107, 1280–1288 (2014). [27] N. Jaafari, E. Marret, and M. Canepari, Neurophotonics 2, 021010 (2015).
[28] N. Jaafari, and M. Canepari, J. Physiol. 594, 967–983 (2016).
[29] K. Ait Ouares, N. Jaafari, and M. Canepari, J. Neurosci. Methods 268, 66–77 (2016).
[30] T.G. Oertner, Exp. Physiol. 87, 733-736 (2002).
[31] E. Papagiakoumou, A. Bégue, B. Leshem, O. Schwartz, B.M. Stell, J. Bradley, D. Oron, and V. Emiliani (2013), Functional patterned multiphoton excitation deep inside scattering tissue. Nat. Photon. 7, 274-278 (2013).
[32] A.J. Foust, V. Zampini, D. Tanese, E. Papagiakoumou, and V. Emiliani.
17
[33] D. Tanese, J.Y. Weng, V. Zampini, V. De Sars, M. Canepari, B. Rozsa, V. Emiliani, and Zecevic D. Neurophotonics, 4, (2017).
[34] V. Nikolenko, B.O. Watson, R. Araya, A. Woodruff, D.S. Peterka, and R. Yuste.
Front. Neural Circuits. 2, 5 (2008).
[35] P. Pozzi , D. Gandolfi , M. Tognolina, G.J.E.Chirico, Mapelli, and E. D'Angelo,
Neurophotonics 2, 015005 (2015).
[36] W. Yang, J.E. Miller, L. Carrillo-Reid, E. Pnevmatikakis, L. Paninski, R Yuste, and D.S. Peterka, Neuron 89, 269-284 (2016).
[37] S. Bovetti, C. Moretti, S. Zucca, M. Dal Maschio, P. Bonifazi, and T. Fellin. Sci.
18
Figure 1 Description of the confocal system. (A) Schematic showing a fast (20,000 rpm)
spiral pattern spinning disk, coupled to a 465 nm multimode laser and fast CMOS camera. The configuration includes widefield LED illumination at 470 nm independent of the spinning disk. (B) Top: image of the disk obtained using a uniform fluorescence slide with the 60X objective. A frame obtained with whole-field LED illumination is superimposed to a frame with ~60 µm laser spot. Bottom: enlargement of the red square region on the top to appreciate the fine structure of the disk. (C) Top: image of a PN filled with OG5N showing the detailed confocal region acquired with laser and spinning disk superimposed over a full frame taken with widefield LED illumination. Bottom: enlargement of the red square region on the top to appreciate the resolution of dendrites and synaptic spines. (D) A 500 nm fluorescent bead attached to a coverslip is imaged at
19
different depths with 250 nm steps from its focal plane in widefield (wf) or with the spinning disk (sd); the two images are in the xz plane; on the right the mean ± SD from N = 16 beads of the fluorescence normalised to that in the focal plane at 1 µm, 2µm and 3 µm from the focal plane; * indicates that the difference between sd and wf imaging was significantly different (p<0.001, paired t-test)
Figure 2 Speed performance of the system. (A) Top: picture of the full CMOS sensor
composed of 2048 x 2048 pixels of 15 µm X 15 µm (~3 cm length). Bottom: scheme of the 16 parallel processed sectors with blue square indicating the actual field of view. (B) Images of a PN filled with OG5N obtained with widefield LED illumination (left) and laser and spinning disk (right); in the image on the right, the blue, green, red and purple rectangles are CMOS areas where acquisitions can be achieved at maximal speeds of 200, 400, 800 and 1250 frames/s. (C) Top: image detail (160X160 pixels) obtained with
20
widefield LED illumination (left) and laser and spinning disk (right); Bottom: Ca2+
signals (single trials) associated with a CF-EPSP at the maximal speeds of the four rectangles in the yellow region on the top-right image. (D) Left: detail of the image in (C) with regions (2X2 pixels, ~0.25 µm2) 1 and 3 corresponding to synaptic spines and 3 in
the parent dendrite. Right: Ca2+ signals (average of 3 trials) associated with a CF-EPSP in
regions 1-3; somatic patch recording on the top.
Figure 3 Improvement of spinning disk (sd) imaging with respect of widefield (wf)
imaging at different depths from the slice surface (δ). (A) Images of three apical dendrites from CA1 hippocampal pyramidal neurons at δ = 23, 37 or 50 µm with wf imaging (blue, left) or with sd imaging (red, right); the X axes of analysis are positioned on the dendritic part in focus. (B) Left: fluorescence normalised to the maximum (at X = 0) along the X axes (points) fitted with a Lorentzian functions (lines) in the three cases with wf and sd imaging; each spot was calculated by averaging fluorescence of 2X4 pixels; Γ values are
21
indicated. Right: Ca2+ signals (average of 4 trials) associated with 4 action potentials at
10 ms interval at X = 0 and X = ±Γsd; since the sd is removing scattered light, the Ca2+
∆F/F0 signal drops away more rapidly with distance from the dendritic centre making
confocal imaging significantly better is resolving the origin of a Ca2+ signal. (C) Γ values
with wf and sd imaging (left plot) and their difference (right plot) versus δ in 8 X-lines from 5 cells. (D) Mean ± SD of Ca2+ ∆F/F0 signal associated with 4 action potentials at X
= ±Γ, normalised to the signal at X = 0, in 8 X lines from 5 cells; * indicates that the sd signal was significantly smaller than the wf signal (p<0.001, paired t-test).
Figure 4 Ability of the system to resolve Ca2+ transients from synaptic spines. (A) Images of a PN dendrite at δ = 25 µm with widefield illumination (wf, top) or with the spinning disk (sd, bottom); two spines in focus (sp1 and sp2) are indicated on the right; 2X2 pixels regions centred on sp1 and sp2, at ~0.5 µm from the spine or at ~1 µm from the spine are shown on the left. (B) Ca2+ signals (average of 8 trials) associated with a
CF-EPSP at 500 Hz in the regions in (A) shown in the same colour code; somatic patch recording on the top; the Ca2+ ∆F/F0 signal decreases with distance in sd imaging but not
22
normalised to the signal in the spines, from 2 x 2 pixels regions at ~0.5 µm from the spine or at ~1 µm from the spine calculated over 48 spines in focus in six cells with δ ranging from 18 µm to 30 µm; * indicates that both at ~0.5 µm and at ~1 µm the difference between sd and wf imaging was significantly different (p<0.001, paired t-test)
Figure 5 Bleach improvement of the system. (A) Images of a PN dendrite detail with
widefield illumination (wf, top) or with the spinning disk (sd, bottom); a region of interest is indicated. (B) Top: ∆F/F0 from the region of interest in (A) in wf (blue trace) and sd
(red trace) mode following 80 ms light application; light intensity was the maximum for the sd whereas it was decreased in wf in order to obtain comparable photon noise. Bottom: mean ± SD of the ∆F/F0 in wf and sd (red trace) mode following 80 ms light
application, calculated from N = 7 cells; * indicates that the difference between sd and wf imaging was significantly different (p<0.001, paired t-test)
23
Figure 6 Example 1: analysis of Ca2+ transients associated with a CF-EPSP. (A) Left: intensity inverted confocal image of a PN filled with OG5N. Right: enlargements of the red and blue square regions of the left with four spine regions (1 and 3) and four regions of the parent dendrites (2 and 4). (B) Ca2+ signals (average of 8 trials) associated with a
CF-EPSP at 500 Hz in the spines and dendritic regions in (A); somatic patch recording on the top. For this experiment, see also MovieS1.
24
Figure 7 Example 2: analysis of Ca2+ transients associated with parallel fibre EPSPs. (A) Left: confocal image of a PN filled with OG5N. Right: enlargements of the activated dendritic region with 8 spine or dendritic regions indicated. (B) Ca2+ signals (average of 8
trials) associated with a train of 5 parallel fibre EPSPs at 250 Hz in the spines and dendritic regions in (A); somatic patch recording on the top. (C) Colour scaled signals of the experiment in (B) superimposed on the inverted fluorescence image of the dendrite. Signal profiles are obtained by averaging 6 frames in the time windows a, b, c and d indicated in (B). Signal b corresponds to the peak of the fast component of the Ca2+
transient, mediated by voltage-gated Ca2+ channels. Signal d corresponds to the peak of
the slow component of the Ca2+ transient, mediated by metabotropic glutamate receptors.