A decadal satellite analysis of the origins
and impacts of smoke in Colorado
The MIT Faculty has made this article openly available.
Please share
how this access benefits you. Your story matters.
Citation
Val Martin, M., C. L. Heald, B. Ford, A. J. Prenni, and C. Wiedinmyer.
“A decadal satellite analysis of the origins and impacts of smoke in
Colorado.” Atmospheric Chemistry and Physics 13, no. 15 (August 2,
2013): 7429-7439.
As Published
http://dx.doi.org/10.5194/acp-13-7429-2013
Publisher
Copernicus GmbH
Version
Final published version
Citable link
http://hdl.handle.net/1721.1/81308
Atmos. Chem. Phys., 13, 7429–7439, 2013 www.atmos-chem-phys.net/13/7429/2013/ doi:10.5194/acp-13-7429-2013
© Author(s) 2013. CC Attribution 3.0 License.
EGU Journal Logos (RGB)
Advances in
Geosciences
Open Access
Natural Hazards
and Earth System
Sciences
Open AccessAnnales
Geophysicae
Open AccessNonlinear Processes
in Geophysics
Open AccessAtmospheric
Chemistry
and Physics
Open AccessAtmospheric
Chemistry
and Physics
Open Access DiscussionsAtmospheric
Measurement
Techniques
Open AccessAtmospheric
Measurement
Techniques
Open Access DiscussionsBiogeosciences
Open Access Open Access
Biogeosciences
DiscussionsClimate
of the Past
Open Access Open Access
Climate
of the Past
Discussions
Earth System
Dynamics
Open Access Open Access
Earth System
Dynamics
DiscussionsGeoscientific
Instrumentation
Methods and
Data Systems
Open Access
Geoscientific
Instrumentation
Methods and
Data Systems
Open Access DiscussionsGeoscientific
Model Development
Open Access Open Access
Geoscientific
Model Development
DiscussionsHydrology and
Earth System
Sciences
Open AccessHydrology and
Earth System
Sciences
Open Access DiscussionsOcean Science
Open Access Open Access
Ocean Science
DiscussionsSolid Earth
Open Access Open Access
Solid Earth
Discussions
Open Access Open Access
The Cryosphere
Natural Hazards
and Earth System
Sciences
Open Access
Discussions
A decadal satellite analysis of the origins and impacts of smoke in
Colorado
M. Val Martin1, C. L. Heald2, B. Ford1, A. J. Prenni1, and C. Wiedinmyer3 1Atmospheric Science Department, Colorado State University, Fort Collins, CO, USA
2Department of Civil and Environmental Engineering & Department of Earth, Atmospheric, and Planetary Sciences, Massachusetts Institute of Technology, Cambridge, MA, USA
3National Center for Atmospheric Research, Boulder, CO, USA
Correspondence to: M. Val Martin (mval@atmos.colostate.edu)
Received: 22 February 2013 – Published in Atmos. Chem. Phys. Discuss.: 26 March 2013 Revised: 19 June 2013 – Accepted: 28 June 2013 – Published: 2 August 2013
Abstract. We analyze the record of aerosol optical depth (AOD) measured by the MODerate resolution Imaging Spec-troradiometer (MODIS) aboard the Terra satellite in combi-nation with surface PM2.5to investigate the impact of fires on aerosol loading and air quality over Colorado from 2000 to 2012, and to evaluate the contribution of local versus trans-ported smoke. Fire smoke contributed significantly to the AOD levels observed over Colorado. During the worst fire seasons of 2002 and 2012, average MODIS AOD over the Colorado Front Range corridor were 20–50 % larger than the other 11 yr studied. Surface PM2.5 was also unusually ele-vated during fire events and concentrations were in many oc-casions above the daily National Ambient Air Quality Stan-dard (35 µg m−3) and even reached locally unhealthy levels (> 100 µg m−3) over populated areas during the 2012 High Park fire and the 2002 Hayman fire. Over the 13 yr exam-ined, long-range transport of smoke from northwestern US and even California (> 1500 km distance) occurred often and affected AOD and surface PM2.5. During most of the trans-port events, MODIS AOD and surface PM2.5 were reason-able correlated (r2= 0.2–0.9), indicating that smoke subsided into the Colorado boundary layer and reached surface levels. However, that is not always the case since at least one event of AOD enhancement was disconnected from the surface (r2<0.01 and low PM2.5 levels). Observed plume heights from the Multi-angle Imaging SpectroRadiometer (MISR) satellite instrument and vertical aerosol profiles measured by the space-based Cloud-Aerosol LIdar with Orthogonal Po-larization (CALIOP) showed a complex vertical distribution of smoke emitted by the High Park fire in 2012. Smoke was
detected from a range of 1.5 to 7.5 km altitude at the fire ori-gin and from ground levels to 12.3 km altitude far away from the source. The variability of smoke altitude as well as the lo-cal meteorology were key in determining the aerosol loading and air quality over the Colorado Front Range region. Our results underline the importance of accurate characterization of the vertical distribution of smoke for estimating the air quality degradation associated with fire activity and its link to human health.
1 Introduction
Millions of hectares of forest burn over North America every year (van der Werf et al., 2010), releasing large amounts of gases and aerosols that affect human health, impair visibility and can impact climate. Fire smoke exposure is associated with increased hospital admissions, bronchitis, asthma and chest pain (e.g. Vedal and Dutton, 2006; Naeher et al., 2007; Kochi et al., 2012). Climate change is most likely responsi-ble for the observed increased trend in fire activity over the western US (Westerling et al., 2006), which may result in a near doubling of carbonaceous aerosol, and a significant in-crease in annual mean PM2.5 and haze by 2050 (Spracklen et al., 2009).
Smoke plumes generated by fires can be confined within the boundary layer (BL) or injected into the free troposphere (FT) (Val Martin et al., 2010). Smoke within the BL typi-cally is well mixed and remains near the source region (e.g. Trentmann et al., 2002), whereas smoke lofted into the FT is
often transported thousands of kilometers mixing down to the surface and potentially affecting air quality over regions far downwind. (e.g. Val Martin et al., 2006; Duck et al., 2007). Thus, the altitude of the smoke is key to determining the air quality impacts of smoke and understanding the link to hu-man health.
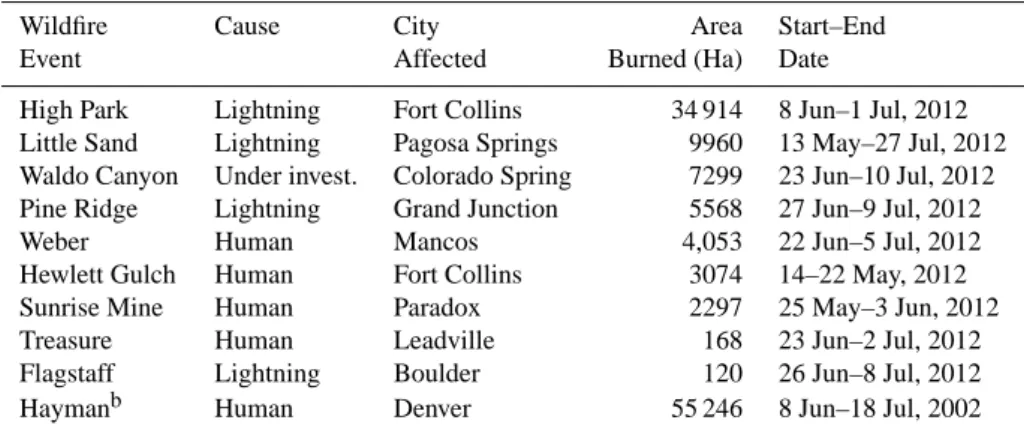
In the last decade, satellite observations of total column aerosol optical depth (AOD) have provided an important tool to estimate PM2.5levels at the ground (e.g. Engel-Cox et al., 2004), with the objective of developing air quality advisories (Al-Saadi et al., 2005) and establishing links to human health (Evans et al., 2013). Studies have used fixed statistical rela-tionships between AOD and surface PM2.5 as well as more sophisticated approaches that take into account meteorology and surface information and chemical transport model simu-lations (Hoff and Christopher, 2009, and references therein). However, the use of vertical AOD column observations to provide an accurate air quality (and hence human health) ad-visory is still a difficult task because the AOD column ob-served by the satellite does not always connect to the surface. Colorado experienced one of its worst fire seasons in 2012. A series of devastating fires burned from May to July due to an extraordinarily dry winter and extreme hot summer tem-peratures across the state. Table 1 summarizes the main 2012 Colorado fires. Smoke generated during large fires such as the High Park fire in Fort Collins and the Waldo Canyon fire in Colorado Springs blanketed almost the entire state for weeks at a time (CBSNews, 2012). Smoke plumes from wildfires in the northwestern US also impacted Colorado in 2012 (Mitchell, 2012). Previous to 2012, the fire event as-sociated with the most extreme air quality degradation in Colorado was the June 2002 Hayman fire, which engulfed the city of Denver with smoke for days (Vedal and Dutton, 2006). Fire smoke has an important impact on air quality in Colorado during the summer. Typical summertime back-ground PM2.5 levels are below 10 µg m−3, with a contribu-tion of about 60 % from carbonaceous aerosols (Hand et al., 2012). Since PM2.5 started being monitored in Colorado in 1999, the daily PM2.5 National Ambient Air Quality Stan-dard (NAAQS; 35 µg m−3, based on the 98th percentile, av-eraged over 3 years) has never been violated during the sum-mer, although exceptional fire events have been responsi-ble for increases in PM2.5 concentrations above the daily NAAQS (CDPHE APCD, 2012).
The objective of this work is to observationally assess the impact of fires on aerosol loading and air quality over Colorado over the last decade, and to evaluate the degree to which local and transported smoke contribute to this impact. For this purpose, we use multiple satellite obser-vations from the MODerate resolution Imaging Spectrora-diometer (MODIS) and the Cloud-Aerosol LIdar with Or-thogonal Polarization (CALIOP) in combination with surface PM2.5 (particulate matter less than 2.5 µm) measurements. We also retrieve smoke plume heights from the High Park fire using Multi-angle Imaging SpectroRadiometer (MISR)
observations and CALIOP aerosol vertical profiles to inves-tigate the importance of vertical smoke distribution on air quality near and far away from the fire source.
2 Data and methods
In this study, we make use of a suite of satellite observa-tions from MODIS, CALIOP and MISR in combination to daily area burned extracted from the NCAR Fire INventory (FINN) model (Wiedinmyer et al., 2011), and surface PM2.5 measurements collected by the Colorado Department of Pub-lic Health and Environment (CDPHE) network and Colorado State University (CSU).
2.1 Satellite Observations
To study the impact of smoke over Colorado, we combine satellite observations from MODIS, CALIOP and MISR. For this work, we use data from the MODIS instrument aboard the NASA Terra satellite from 2000 to 2012. Specifically, we use daily AOD data from Collection 5.1, Level 3 with a 1◦×1◦ horizontal resolution, and the retrieved AOD is es-timated to be at least accurate to ±(0.05 + 0.15 AOD) over dark land surfaces (Levy et al., 2010). We use corrected land optical depth retrievals and filter the MODIS data to include only grid boxes with cloud fractions below 0.8 and aerosol optical depths less than 1.5, following the work of Ridley et al. (2012). Our results do not change if we use all the data from the standard MODIS AOD product. For example, monthly average AOD over Colorado in June 2012 is 0.2 and 0.23 from the standard and filtered data, respectively. This screening method may not be the most effective over bright surfaces (Hsu et al., 2004; Hyer et al., 2011). However, it pre-serves a large fraction of the data and allows for the complete use of the 13 yr record of MODIS Terra AOD data (Shi et al., 2013).
The MODIS sensor has middle- and long-wave infrared bands designed specifically to observe actively burning fires (Kaufman et al., 1998; Giglio et al., 2003). We use fire pixels from MODIS (Level 2, Collection 5) to identify potential ac-tive fire locations in 2002 and 2012. Each acac-tive fire location represents the center of a 1 km pixel that is flagged by the algorithm as containing a fire within the pixel (Giglio et al., 2003).
CALIOP is aboard the CALIPSO satellite, which was launched in 2006. CALIOP measures the backscatter in-tensity and the orthogonally polarized components of the backscatter signal at two wavelengths, 532 and 1064 nm. We use Level 2, version 3.01 data from 2007 to 2012. Details of the data processing algorithms are given by Winker et al. (2009). CALIOP also provides an aerosol type classification (i.e., clean marine, clean continental, dust, polluted dust and smoke) based on an algorithm that uses properties of depo-larization ratio, surface type, integrated backscatter, altitude
Table 1. Summary of main 2012 Colorado fires, organized by area burneda.
Wildfire Cause City Area Start–End
Event Affected Burned (Ha) Date
High Park Lightning Fort Collins 34 914 8 Jun–1 Jul, 2012 Little Sand Lightning Pagosa Springs 9960 13 May–27 Jul, 2012 Waldo Canyon Under invest. Colorado Spring 7299 23 Jun–10 Jul, 2012 Pine Ridge Lightning Grand Junction 5568 27 Jun–9 Jul, 2012
Weber Human Mancos 4,053 22 Jun–5 Jul, 2012
Hewlett Gulch Human Fort Collins 3074 14–22 May, 2012
Sunrise Mine Human Paradox 2297 25 May–3 Jun, 2012
Treasure Human Leadville 168 23 Jun–2 Jul, 2012
Flagstaff Lightning Boulder 120 26 Jun–8 Jul, 2012
Haymanb Human Denver 55 246 8 Jun–18 Jul, 2002
aData from http://www.nifc.gov.bThe 2002 Hayman fire is added for comparison.
and color ratio (Omar et al., 2009). The aerosol-type classifi-cation can be used to suggest what sources are likely to con-tribute to the aerosol mass loading at a specific time. For this work, we filter the CALIOP data following the work of Ford and Heald (2012). We use cloud aerosol distinction scores, extinction uncertainty values, atmospheric volume descrip-tors, extinction quality control flags and total column opti-cal depths. We assume that all extinction observations with a corresponding atmospheric volume descriptor that indicates clear air have zero aerosol extinction, rather than the fill value of −9999. Additional information on the filtering and sam-pling methods can be found in Ford and Heald (2012).
The MISR instrument also is aboard the Terra satellite (Diner et al., 1998). MISR acquires multi-angle radiance im-agery from a set of nine push-broom cameras, from −70◦ to +70◦viewing angles, in-line with the ground track of the satellite. The width of the MISR swath common to all 9 cam-eras is about 380 km, enabling global coverage every 9 days at the Equator and every 4–6 days over the lower 48 states. MISR’s multiple viewing angles allow the retrieval of cloud, smoke plume, and other aerosol layer heights above the ter-rain, as well as motion vectors, using stereoscopic methods, with a typical vertical resolution of 500 m or better, and a horizontal resolution of 1.1 km, provided the cloud or aerosol contains features that can be identified in the multiple views (e.g. Moroney et al., 2002; Kahn et al., 2007).
To determine the smoke plume heights for the High Park Fire, we use the MISR Interactive Explorer (MINXv2) software package (http://www.openchannelfoundation.org/ projects/MINX). This software combines MISR and MODIS data to retrieve smoke stereoheights. The MINX software is available free to the public and has been used previously to develop climatologies of fire smoke plume heights over North America (Val Martin et al., 2010) and Indonesia (Tosca et al., 2011). A detailed review of limitations and errors of the plume heights retrieved by MINX is presented in Val Martin et al. (2010). In this study, we retrieve smoke plume heights following the work of Val Martin et al. (2010).
2.2 NCAR Fire INventory model
We use the Fire INventory from NCAR version 1.0 (FINNv1), which provides daily, highly resolved (1 km) global estimates of trace gas and particle emissions from wildfires, agricultural fires, and prescribed burning (Wied-inmyer et al., 2011). The model uses satellite observations of active fires and land cover, in combination with emission factors and estimated fuel loadings. The uncertainty in the FINNv1 emission estimates is about a factor of two. How-ever, the global estimates agree reasonably well with other global inventories of biomass burning emissions for CO, CO2, and other species with less variable emission factors (Wiedinmyer et al., 2011). In this work, we extract daily area burned and carbonaceous aerosol emissions over Colorado from 1 May–1 October, 2002–2012.
2.3 Surface PM2.5
Surface PM2.5 observations for the fire seasons from 2000 to 2012 were obtained from the Air Pollution Control Di-vision (APCD) of the CDPHE. The APCD operates and maintains a network of ambient air quality monitoring sites for Colorado (PM10, PM2.5, O3, CO and NO2). In 2000– 2011, surface PM2.5 was measured as 24 hr samples col-lected on a Teflon filter and analyzed pre- and post-sample for net weight, whereas surface PM2.5in 2012 was measured continuously with a tapered element oscillating microbal-ance (TEOM 1400a, Thermo Scientific) with a filter dynamic measurement system (8500C FDMS) (B. Rink, CDPHE, per-sonal communication, 2012). The TEOM provides a direct mass measurement of PM2.5 and the FDMS accounts for volatile and semi-volatile components, which may be present in smoke plumes. We average observations collected over 10 sites within the Colorado Front Range corridor, comprising 7 cities (i.e., Fort Collins, Greeley, Longmont, Boulder, Den-ver, Colorado Springs and Pueblo), and present daily PM2.5
for 2000–2012, in addition to hourly PM2.5 for 2012 since higher resolution observations are available for this season.
In addition to the CDPHE PM2.5network, we use surface PM2.5 measurements collected on the CSU Department of Atmospheric Science campus. These particle mass concen-trations were obtained using a TEOM 1405-DF (Thermo Sci-entific), housed in a temperature-controlled mobile labora-tory. The 1405-DF is composed of two FDMS units and two TEOM mass sensors housed in a single cabinet. The 1405-DF provides a self-referencing, NIST traceable true mass measurement. The instrument has a broad dynamic range, high resolution, and relatively high time resolution. The mo-bile laboratory was located within a few kilometers of the southeastern edge of the Hewlett Gulch and High Park fires, and the laboratory was frequently impacted by smoke from the fires. For this study, we use daily and 1 h averages.
3 Results
3.1 Fire seasons in Colorado
We study the magnitude of the Colorado fire seasons over the last decade using FINN daily area burned from 2002 to 2012, and climatological aerosol observations from MODIS (2000–2012). Figure 1 shows daily area burned over Col-orado for the last decade. For clarity, we separately show the daily area burned for two highly active fire seasons (2002 and 2012) and the minimum and maximum range reported for all other seasons with low fire activity (2003–2011) in Colorado. We define the fire season as the period from 1 May to 1 Oc-tober.
As detailed in Sect. 1, Colorado experienced its worst fire seasons in 2002 and 2012. According to FINN, the total ar-eas burned were 730 and 377 km2 in 2002 and 2012, with carbonaceous aerosol emissions totaling 1.43 and 1.33 Tg in each fire season, respectively. Between 2003 and 2011, a total of about 150 km2were burned and 0.25 Tg of aerosol were emitted on average every fire season. In 2012, about 80 % of the area (300 km2) burned from mid-June to mid-July, mainly due to the High Park and Waldo Canyon fires (Table 1); about 86 % of the total aerosol for the fire season was emitted dur-ing that period (1.14 Tg). In comparison, 0.74 Tg of aerosol were emitted during the 2002 Hayman fire, with a larger area burned (488 km2). In 2012, larger emissions but lower area burned (than those in 2002) were most likely the result of different fuel types. During the High Park and Waldo Canyon fires, fuel loads consisted of spruce, mixed conifers and pine in thick forests (Barnes et al., 2012), whereas the Hayman fire burned mainly pine and Douglas fir in open forests and shrubland (Graham, 2003). It is important to note that, in ab-solute values, the FINN area burned does not agree very well with that reported by the National Interagency Fire Center in Table 1. However, both sources of information agree on the relative magnitude of the fires.
May
01 May15 Jun01 Jun15 Jul01 Jul15 Aug01 Aug15 Sep01 Sep15 Oct01 0 20 40 60 80 100 120 Area (km^2) 2002 2003-2011 2012
Fig. 1. Daily area burned in Colorado from 1 May to 1 October estimated by the NCAR FINN model. Year 2002 is plotted in blue, year 2012 in red and minimum–maximum range for other years in black.
Figure 2 shows average MODIS AOD over the western US for the fire seasons of 2002, 2012, and 2000–2001/2003– 2011, i.e., the two highly active fire and the less active fire years identified over Colorado, respectively. In this work, we focus on the state of Colorado and, in particular the Colorado Front Range (CFR) corridor since this region comprises 86 % of the whole state population (http://www.census.gov). We identify both regions in Fig. 2. Similar to the fire area burned, AOD levels over Colorado were larger during the two highly fire seasons we have identified than in all other years. Aver-age MODIS AOD levels over the CFR were 20–50 % larger in 2002 and 2012 than in 2000–2001/2003–2011, with aver-age values of 0.3, 0.24 and 0.2, respectively.
As an additional source of AOD observations over Col-orado, we analyzed aerosol optical depth obtained in Boul-der as a part of the AERONET (Aerosol Robotic Network) global aerosol monitoring network (Holben et al., 1998). AERONET AOD values were slightly lower than MODIS AOD (not shown). However, they showed an increase of about 20–30 % in AOD in 2002 and 2012 with respect to 2000–2001/2003–2011, with average values of 0.18, 0.15 and 0.12, respectively. It is important to note that AOD lev-els may also be enhanced due to other aerosol types, such as dust. However, a climatological study of dust events over Colorado shows that dust events generally occur during win-ter and early spring, and in particular during periods of low precipitation and strong winds (CDPHE APCD, 2013). Therefore, the summertime interannual variability in AOD levels observed over Colorado shown here are likely domi-nated by smoke.
3.2 Impact of local versus transported smoke
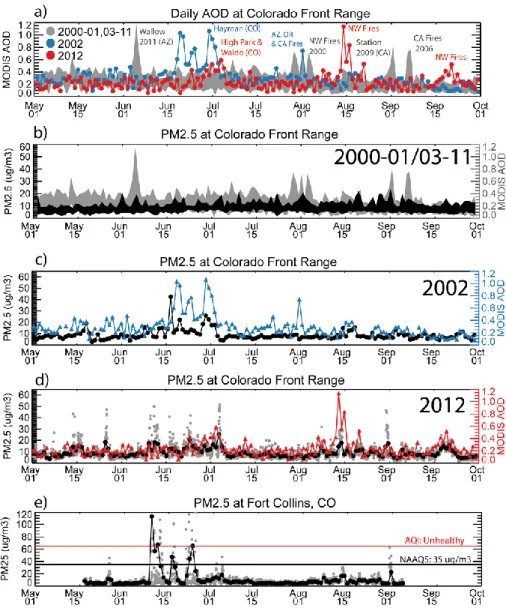
We assess the impact of local and transported smoke over Colorado using MODIS AOD observations. Figure 3a com-pares daily AOD averaged over the CFR in the 2002 and 2012 fire seasons to the minimum and maximum AOD range recorded during the less active fire seasons (2000–2001 and 2003–2011). Periods when AOD levels were above 0.5 were
2000-01 and 2003-11 2002 0.00 0.17 0.33 0.50 2012
MODIS AOD (May-September)
Fig. 2. Average MODIS AOD over the western US for the fire sea-sons (May–September) of 2000–2001/2003–2011, 2002 and 2012. The state of Colorado (thick solid lines) and the Colorado Front Range corridor (dotted lines) are highlighted.
classified as key fire events and identified in Fig. 3a. In addi-tion, Fig. 4 shows monthly AOD anomalies over the western US (and Colorado) in 2002 and 2012. We consider an AOD anomaly to be the difference between the monthly AOD and the monthly average obtained in the climatology of the less active fire seasons. MODIS fire pixels identifying active fire locations are also shown in Fig. 4.
AOD anomalies over the CFR are associated with both lo-cal and transported fire smoke. For example, unusually large AOD levels in June 2002 (AOD of up to 1.0 on 20–21 June and 1 July, 2002 in Fig. 3a) were mainly associated with the local Hayman Fire (Fig. 4) . In contrast, above average AOD levels in August 2012 resulted from smoke transported from fires that burned over the northwestern US (i.e., Montana, Wyoming, Idaho and Washington) (Fig. 4), which increased CFR AOD levels up to 1.2 on 15 August, 2012 (Fig. 3a). Al-though the local High Park and Waldo Canyon fires emitted significant amounts of aerosol (1.14 Tg from 8 June–10 July, 2012), they did not lead to especially enhanced AOD over the CFR, with a maximum AOD of 0.6 recorded on 4 July, 2012. This modest AOD increase may be due to the strong winds that blew during the peak of the fires (average of 30 mph with gusts of up to 50 mph) (Hanlon, 2012), which spread the smoke outside the study region (e.g., Colorado eastern plains, Nebraska and Wyoming as shown in Fig. 4 for June and July, 2012).
The impact of transported smoke from fires outside of Col-orado is a common phenomenon as shown in Fig. 3a. Record AOD levels (> 1.1) observed by MODIS over the CFR were due to smoke from the Arizona Wallow fire that reached Col-orado on 5 June, 2011 (Gibbons, 2011), and from the north-western US in August 2012 as mentioned above. Long-range transport of smoke from California (> 1500 km away) often impacts Colorado as well. For example, smoke from the Sta-tion fire reached the CFR on 1 September, 2009, resulting in regional AOD of up to 0.8. Smoke from the Station fire was reported over Colorado associated with both elevated ice nuclei concentrations on 1 September, 2009 (Prenni et al., 2012), and elevated aerosol number concentrations over the Rocky Mountain National Park on 31 August, 2009 (Levin, 2013).
While the satellite AOD record provides a decadal con-text for the importance of local and out-of-state fires on aerosol loading over Colorado, these AOD enhancements do not necessarily imply corresponding surface impacts on hu-man health.
3.3 Impact of smoke on surface PM2.5
To examine the impacts of fire smoke on surface particu-late matter concentrations we use ground-level PM2.5 mea-surements gathered by the CDPHE APCD and by CSU in Fort Collins. We focus here on the effects in 2002 and 2012 as those were the most active fire seasons, as described in Sect. 3.1. Figure 3b–d show daily PM2.5 over the CFR in 2000–2001/2003–2011, 2002, and 2012, respectively. In ad-dition, Fig. 3e presents PM2.5 observations collected at the CSU Department of Atmospheric Science campus. These ob-servations were made a few kilometers downwind from the Hewlett Gulch and High Park fires.
It is apparent in Fig. 3c, d that fire smoke frequently im-pacted surface PM2.5 in 2002 and 2012, and that measured PM2.5levels were higher than the daily NAAQS (35 µg m−3) on several occasions. For example, daily PM2.5 during the Hayman fire reached levels of up to 40 µg m−3 over the entire CFR (Fig. 3c), with daily PM2.5 of 45–50 µg m−3 and 1 h peaks of 200 µg m−3 recorded in Denver as re-ported by Vedal and Dutton (2006). In 2012, smoke from the High Park and Waldo Canyon fires also significantly af-fected the CFR, with daily PM2.5 levels of up to 30 µg m−3 recorded across the region (Fig. 3d). Closer to the High Park fire, however, measurements at CSU show that daily PM2.5 was at times above 100 µg m−3, with 1 h peaks of up to 400 µg m−3. Air quality over this area was classified by the air quality index as unhealthy (65.5–150.4 µg m−3) for 4 days and as unhealthy for sensitive groups (40.5– 65.4 µg m−3) for almost a week; daily-mean PM2.5 levels were above the NAAQS for 7 days. Further downwind, mea-surements made by the CDPHE over the city of Fort Collins (not shown) detected PM2.5 concentrations also above the daily NAAQS during the Hewlett Gulch and High Park fires. Sameenoi et al. (2013) reported particulate matter oxida-tive activity values (31.1–43.5 pmol min−1µg−1) over Fort Collins during the High Park fire comparable to that over highly polluted urban cities such as Los Angeles and Mex-ico City (20–50 pmol min−1µg−1). The oxidative capacity levels on a clean day over Fort Collins are about 5.5– 6.3 pmol min−1µg−1.
Surface PM2.5 has been shown to correlate well with MODIS AOD, particularly in cloud-free conditions with well-mixed BL heights, no overlying aerosols and aerosols with similar optical properties (Hoff and Christopher, 2009, and references therein). For example, Engel-Cox et al. (2004) reported a typical MODIS AOD–PM2.5 squared-correlation coefficient (r2) of 0.2–0.4 over Colorado based on a sta-tistical analysis over the US. In this study, to determine if
Fig. 3. Fire season time series (1 May to 1 October) of (a) average AOD over the Colorado Front Range, (b) average PM2.5over the Colorado Front Range for 2000–2001/2003–2011, (c) 2002 and (d) 2012, and (e) PM2.5at the CSU Department of Atmospheric Science, Fort Collins, CO. Year 2002 is plotted in blue, year 2012 in red and minimum–maximum range for other years in gray (AOD) or black (PM2.5). All observations are given as daily averages, in addition to hourly averages in (d) and (e). NW, northwestern US; CA, California; OR, Oregon; and AZ, Arizona.
MODIS AOD observations provide useful information about surface PM2.5during the Colorado fire seasons, we also show AOD averaged over the CFR in Fig. 3b–d; Table 2 presents a summary of the AOD–PM2.5relationship for the main fire events identified in Fig. 3a.
MODIS AOD tracked surface PM2.5reasonably well over the CFR, indicating that smoke aerosol was often located near the ground, below the BL (Al-Saadi et al., 2005). Eight out of nine fire events identified as having enhanced AOD produced a significant PM2.5 enhancement; MODIS AOD and PM2.5 correlated reasonably well (r2= 0.2–0.9) during these events (Table 2). For example, MODIS AOD and PM2.5 were significantly enhanced and well correlated
during the northwestern US event of 10–19 August 2012 (1.1, 17.8 µg m−3and r2= 0.6, respectively), during the Cal-ifornia Station fire (0.8, 24.4 µg m−3and r2= 0.9), and dur-ing the Arizona Wallow fire (1.2, 19.7 µg m−3and r2=0.3), suggesting that smoke aerosol from western US fires sub-sided to the BL over the CFR and affected the air quality over the broad region. This is not always the case. Smoke aerosol from California, Oregon and Arizona fires in August 2002 was transported over the CFR as indicated by high levels of AOD (about 0.7) and NOAA AVHRR (Advanced Very High Resolution Radiometer) images of smoke plumes across the western US (NOAA’s NCDC, 2002). However, the smoke plume did not reach the surface since PM2.5 concentrations
Fig. 4. Monthly MODIS AOD anomalies for the fire seasons of 2002 and 2012. The state of Colorado (thick solid lines) and the Colorado Front Range corridor (dotted lines) are highlighted; black triangles represent MODIS fire pixels for each month.
remained at background levels (< 10 µg m−3) and there was a poor MODIS AOD–PM2.5correlation (r2<0.01), as shown in Table 2. Therefore, the smoke plume altitude, and subse-quent descent into the boundary layer downwind, is critical to linking smoke with air quality impacts.
3.4 Vertical smoke injection heights
We use CALIOP extinction coefficient observations to assess the relationship between vertical smoke distribution and air quality impacts. Figure 5a shows extinction coefficient pro-files over Colorado during the fire seasons in 2012 and 2007– 2011. In this work, we average all daytime and nighttime aerosol extinction values reported by CALIOP since daytime and nighttime profiles did not significantly differ from each other. Using the aerosol classification described in Sect. 2.1, we also determine the average extinction coefficient resulting
Table 2. Statistical summary of main fire events identified over the CFR from 2000 to 2012a.
Eventsb Origin PM
2.5 AOD r2 N
27 Jul–6 Aug, 2000 NW US 21.1 0.7 0.3 7 15 Jun–10 Jul, 2002 Hayman Fire 42.5 1.1 0.2 24 30 Jul–3 Aug, 2002 AZ, OR, CA 9.1 0.7 <0.01 4
4 Sep–9 Sep, 2006 CA 16.0 0.8 0.5 5
29 Aug–3 Sep, 2009 Station Fire 24.4 0.8 0.9 5 2 Jun–8 Jun, 2011 Wallow Fire 19.7 1.2 0.3 7 28 Jun–6 Jul, 2012 High Park 25.7 0.6 0.5 9
and Waldo Fires
Aug 12–Aug 19, 2012 NW US 17.8 1.1 0.6 8 Sep 19–Sep 23, 2012 NW US 15.6 0.5 0.5 5 aReported maximum PM
2.5and AOD, squared-correlation coefficient (r2) and number of observations (N ) within each period.bFire events identified in Fig. 3a. Each episode includes two days before and after the fire event. Abbreviations as in Fig. 3.
from all aerosol types excluding the smoke aerosols in Fig. 5a. Additionally, in Fig. 5b we show the vertical dis-tribution of all aerosol extinction values for summer 2012, as an example of the typical summertime aerosol types present over Colorado.
Figure 5a confirms that the 2012 fire season had on av-erage a larger extinction coefficient than the fire seasons of 2007–2011, in particular at altitude levels above 2 km. The average altitude over the CFR is about 1.5 km. During sum-mer 2012, aerosol types over Colorado were classified as smoke, dust, polluted dust and clean continental (Fig. 5b), with smoke aerosol being the predominant type; August was the month with the largest smoke aerosol load (not shown). It is important to note that although Fig. 5b identifies smoke aerosols near the surface, the CALIOP algorithm cannot truly distinguish smoke from polluted continental aerosols (Omar et al., 2009; Winker et al., 2013). Smoke aerosols were mostly concentrated at an altitude range of about 1.0– 3.5 km above ground level (a.g.l.). Therefore, while PM2.5 concentrations clearly show that smoke from the 2012 fires did impact surface air quality, much of the smoke plume was located in the lower free troposphere. In Fig. 5a, the aerosol extinction profiles without smoke aerosol are very similar at all altitude levels for 2007–2011 and 2012. These results show that aerosol extinction over Colorado is fairly consis-tent during the summertime and suggest that any changes in extinction coefficient (and AOD) are likely the result of the annual variability of fire smoke loading.
To further investigate smoke plume elevation and its link to air quality effects, we determine the aerosol plume height for the High Park fire using MINX. Figure 6 shows the ver-tical aerosol distribution for 7 smoke plumes observed by MISR at the fire source during the fire peak (8–28 June, 2012). Minimum and maximum smoke heights calculated by MINX are shown along with the best estimated median height, which represents the height where most of the smoke is concentrated. An example of a MISR smoke plume digi-tized by MINX for a different fire can be seen in Fig. 1 of
Fig. 5. Extinction coefficient observed by CALIOP over Colorado (37 to 41◦N and 109 to 102◦W): (a) average extinction profiles for the fire season of 2012 (solid red) and 2007–2011 (solid black), and average extinction profiles without smoke aerosols for 2012 (dotted red) and 2007–2011 (dotted black); (b) all daytime and nighttime aerosol extinction values from May to September, 2012; and (c) all daytime and nighttime aerosol extinction values during the High Park fire period (8 June–1 July, 2012). Values are colored by classi-fied aerosol types.
Val Martin et al. (2010). Additionally, we include two smoke clouds, i.e., smoke located relatively far away from the fire source, in Fig. 6. Smoke clouds were retrieved over the city of Fort Collins. For comparison, in Fig. 5c we show the ver-tical distribution of all aerosol extinction values observed by CALIOP during the High Park fire period (8 June–1 July, 2012).
The High Park fire median plume heights ranged from about 1.5 to 7.5 km a.g.l., with an average median plume height of 4.4 km a.g.l. The maximum altitude reached by the smoke was about 8.5 km a.g.l. The High Park fire burned intensely between 8 and 18 June, 2012, because of strong winds and very dry conditions; about 40 and 6 % of the perimeter burned at moderate and high severities (Barnes et al., 2012). Similar smoke vertical injection heights were observed by CALIOP, with the smoke aerosols distributed from about 1 to 6 km altitude a.g.l. (Fig. 5c). Based on a 5 yr climatology of MISR plume heights over North America, Val Martin et al. (2010) determine that typical plume heights for temperate forests and shrubland are about 800 m a.g.l., and that those plumes rarely reach more than 4.4 km a.g.l. Smoke plumes generated by the intense High Park fire reached ex-traordinary altitudes and the majority of the smoke was in-jected into the free troposphere since typical summertime BL heights over temperate biomes range from 1 to 1.8 km (Val Martin et al., 2010).
It is important to note that smoke from the High Park fire may have reached higher elevations than those observed at the time of the MISR overpass (11:00–13:00 local time), i.e., later in the day, in part because fire intensity increases in the
Fig. 6. MISR smoke plume (black) and smoke clouds (blue) for the High Park fire. Circles represent median heights and vertical bars indicate minimum and maximum heights.
late afternoon (Giglio et al., 2006), and in part because of at-mospheric processes unrelated to the fire itself (e.g., convec-tion and/or advecconvec-tion) (Val Martin et al., 2010). For example, the Deep Convective Clouds and Chemistry (DC3) aircraft campaign intercepted a smoke plume from the High Park fire within the core of a storm at about 8 km over Wyoming on 22 June 2012. Smoke and high levels of CO and aldehy-des produced by the fire were detected at altitualdehy-des as high as 12.3 km (Crawford, 2012).
Smoke from the High Park fire was at times also present at ground levels. Two smoke clouds were observed by MISR over Fort Collins on 11 and 18 June 2012 as shown in Fig. 6. Smoke from the fire blanked the whole city and signifi-cantly impacted the air quality as described in Sect. 3.3. In particular, on 11 and 18 June, daily average PM2.5 levels reached about 40 µg m−3, indicating the significant impact that smoke from the fire had on the city air quality. Unlike MISR, CALIOP did not identify smoke aerosols at surface level (<1 km) during the High Park fire in part because its al-gorithm does not distinguish smoke aerosols near the surface (Omar et al., 2009; Winker et al., 2013), and in part because it may not have detected the same smoke clouds (CALIOP’s swath is 4000 times narrower than MISR’s) (Kahn et al., 2008). These results highlight the complex vertical struc-ture of smoke, with defined plumes overlaying diffuse smoke clouds, and the challenges of estimating air quality impacts from total column measurements.
4 Conclusions
We show the significant effect that fire smoke had on aerosol concentrations, on the vertical column and at ground level, over the Colorado Front Range during highly active fire sea-sons. Fire smoke adversely impacted air quality over an ex-tended region. During the highly active fire seasons of 2002 and 2012, PM2.5 levels were often higher than the daily NAAQS and reached unhealthy levels. For example, PM2.5 levels were elevated up to 40 µg m−3over the entire CFR cor-ridor during the 2002 Hayman fire, and concentrations above 100 µg m−3were detected over a populated area outside Fort Collins during the 2012 High Park fire. AOD levels were also abnormally high during the highly active fire seasons (20–50 % larger in 2002 and 2012 than in 2000–2001/2003– 2011).
In addition to local fire smoke pollution, long-range trans-port of smoke to Colorado occurs frequently, affecting AOD and surface PM2.5 levels. Maximum MODIS AOD levels over the CFR (spatial average of ∼ 1.2) in the last decade were due to smoke transported from the northwestern US fires. Transported smoke often subsides into the BL and im-pacts the air quality over the region. During these events, MODIS AOD correlates well with surface PM2.5. For in-stance, in a smoke event from the California Station fire (29 August–3 September, 2009) the AOD–PM2.5 relation-ship had an r2 of 0.9. The MODIS AOD climatology pro-vides a long-term record of the relative importance of local and transported smoke on the aerosol loading over Colorado. However, fire smoke impacts on AOD are not always asso-ciated with impacts on air quality as we identified one event in which transported smoke, with a corresponding AOD en-hancement, did not affect surface PM2.5.
The observed plume heights for the High Park fire show the complexity of the vertical distribution of smoke emitted by the fire and the important role that atmospheric processes unrelated to the fire itself play. Smoke was detected at alti-tudes ranging from 1.0 to 7.5 km a.g.l. at the fire origin and from ground level to 12.3 km a.g.l. far away from the source. The variability in smoke injection heights from the High Park fire as well as the local meteorology were key in affecting the aerosol loading and air quality over the CFR. For example, smoke released from the High Park fire did not significantly enhance AOD over the CFR (up to 0.6), but increased daily PM2.5 to unhealthy concentrations (> 100 µg m−3) at times and on a local scale. This large variability in smoke injec-tion heights needs to be taken into account in future model-ing studies to accurately simulate the impact of smoke on air quality on a regional scale (Val Martin et al., 2012).
To understand the link between health outcomes and air quality degradation from fire activity, it is critical to have accurate information of the smoke vertical distribution and its connection to the surface. Characterization of the current impact of smoke, from both local and out-of-state fires, on Colorado’s air quality and its link to human health is key to developing predictive tools that help regional agencies create proper health advisories during fire episodes.
Acknowledgements. This work was supported by the US National Park Service (Grant H2370 094000/J2350103006). We thank the MODIS, CALIOP and MISR teams for the satellite obser-vations, and the Air Pollution Control Division of the Colorado Department of Public Health and Environment for the PM2.5 measurements. Measurements of PM2.5at CSU were funded by the NOAA Atmospheric Composition and Climate Program (Award NA10OAR4310103) and partially supported by the US National Park Service. We acknowledge David Nelson (NASA JPL) for his help with MINX and Ralph Kahn (NASA Goddard) for helpful discussions.
Edited by: D. Spracklen
References
Al-Saadi, J., Szykman, J., Pierce, R. B., Kittaka, C., Neil, D., Chu, D. A., Remer, L., Gumley, L., Prins, E., Weinstock, L., MacDon-ald, C., Wayland, R., Dimmick, F., and Fishman, J.: Improving national air quality forecasts with satellite aerosol observations, B. Am. Meteorol. Soc., 86, 1249–1261, doi:10.1175/BAMS-86-9-1249, 2005.
Barnes, P., Cloudman, R., Mohr, A., and Engemoen, M.: Burn Area Emergency Response Report for High Park Fire, Tech. Rep., available at: http://www.inciweb.org (last access: 2 Febru-ary 2013), US Forest Service, 2012.
CBSNews: Smoke from wildfire 60 miles away blan-kets Denver, CBSNews (06/12/2012), available at: http://www.cbsnews.com/8301-201 162-57451498/
smoke-from-wildfire-60-miles-away-blankets-denver (last access: 5 February 2013), 2012.
CDPHE APCD: Colorado 2011 Air Quality Data Report, Tech. Rep., available at: http://www.colorado.gov/airquality/tech doc repository.aspx (last access: 6 June 2013), Colorado Department of Public Health and Environment, 2012.
CDPHE APCD: Technical Support Document For the April 5, 2010, Alamosa, Pagosa Springs, Durango, Telluride, Crested Butte, and Mt. Crested Butte Exceptional Event, Tech. Rep., available at: http://www.colorado.gov/airquality/tech doc repository.aspx (last access: 6 June 2013), Colorado Department of Public Health and Environment, 2013.
Crawford, J.: Science/Operations Report: June 22 and June 23, available at: http://catalog1.eol.ucar.edu/cgi-bin/dc3 2012/ htmlwrap?file url=/dc3 2012/report/dc-8/20120622/report. DC-8.201206221954.operations summary.html (last access: 2 February 2013), 2012.
Diner, D. J., Beckert, J., Reilly, T., Bruegge, C., Conel, J., Kahn, R., Martonchik, J., Ackerman, T., Davies, R., Gerstl, S., Gordon, H., Muller, J.-P., Myneni, R., Sellers, P., Pinty, B., and Verstraete, M.: Multi-angle Imaging SpectroRadiometer (MISR) instrument description and experiment overview, IEEE T. Geosci. Remote, 36, 1072–1087, 1998.
Duck, T. J., Firanski, B. J., Millet, D. B., Goldstein, A. H., Al-lan, J., Holzinger, R., Worsnop, D. R., White, A. B., Stohl, A., Dickinson, C. S., and van Donkelaar, A.: Transport of forest fire emissions from Alaska and the Yukon Territory to Nova Scotia during summer 2004, J. Geophys. Res., 112, D10S44, doi:10.1029/2006JD007716, 2007.
Engel-Cox, J. A., Holloman, C. H., Coutant, B. W., and Hoff, R. M.: Qualitative and quantitative evaluation of MODIS satellite sensor data for regional and urban scale air quality, Atmos. Environ., 38, 2495–2509, doi:10.1016/j.atmosenv.2004.01.039, 2004. Evans, J., van Donkelaar, A., Martin, R. V., Burnett, R., Rainham,
D. G., Birkett, N. J., and Krewski, D.: Estimates of global mortal-ity attributable to particulate air pollution using satellite imagery, Environ. Res., 120, 33–42, doi:10.1016/j.envres.2012.08.005, 2013.
Ford, B. and Heald, C. L.: An A-train and model perspec-tive on the vertical distribution of aerosols and CO in the Northern Hemisphere, J. Geophys. Res.-Atmos., 117, D06211, doi:10.1029/2011JD016977, 2012.
Gibbons, C.: Smoke from Arizona fire blanketing Front Range, DenverPost (06/07/2011), available at: http://www.denverpost. com/news/ci 18219851 (last access: 5 February 2013), 2011.
Giglio, L., Descloitres, J., Justice, C. O., and Kaufman, Y. J.: An en-hanced contextual fire detection algorithm for MODIS, Remote Sens. Environ., 87, 273–282, 2003.
Giglio, L., Csiszar, I., and Justice, C. O.: Global distribu-tion and seasonality of active fires as observed with the Terra and Aqua Moderate Resolution Imaging Spectrora-diometer (MODIS) sensors, J. Geophys. Res., 111, D02016, doi:10.1029/2005JG000142, 2006.
Graham, R. T.: Hayman Fire Case Study:Summary, Tech. Rep. RMRS-GTR-115, US Department of Agriculture, 2003. Hand, J. L., Schichtel, B. A., Pitchford, M., Malm, W. C., and Frank,
N. H.: Seasonal composition of remote and urban fine particu-late matter in the United States, J. Geophys. Res.-Atmos., 117, D05209, doi:10.1029/2011JD017122, 2012.
Hanlon, T.: Colorado wildfire: High winds push High Park fire to 56,480 acres; more evacuations, DenverPost (06/17/2012), avail-able at: http://www.denverpost.com/breakingnews/ci 20877792/ high-park-fire-colorado-looting (last access: 5 February 2013), 2012.
Hoff, R. M. and Christopher, S.: Remote sensing of particulate pollution from space: have we reached the promised land?, J. Air Waste Manage. As., 59, 645–675, doi:10.3155/1047-3289.59.6.645, 2009.
Holben, B. N., Eck, T. F., Slutsker, I., Tanr´e, D., Buis, J. P., Set-zer, A., Vermote, E., Reagan, J. A., Kaufman, Y. J., Naka-jima, T., Lavenu, F., Jankowiak, I., and Smirnov, A.: AERONET – A Federated Instrument Network and Data Archive for Aerosol Characterization, Remote Sens. Environ., 66, 1–16, doi:10.1016/S0034-4257(98)00031-5, 1998.
Hsu, N., Tsay, S.-C., King, M., and Herman, J.: Aerosol properties over bright-reflecting source regions, IEEE T. Geosci. Remote, 42, 557–569, doi:10.1109/TGRS.2004.824067, 2004.
Hyer, E. J., Reid, J. S., and Zhang, J.: An over-land aerosol opti-cal depth data set for data assimilation by filtering, correction, and aggregation of MODIS Collection 5 optical depth retrievals, Atmos. Meas. Tech., 4, 379–408, doi:10.5194/amt-4-379-2011, 2011.
Kahn, R. A., Li, W.-H., Moroney, C., Diner, D. J., Martonchik, J. V., and Fishbein, E.: Aerosol source plume physical characteristics from space-based multi-angle imaging, J. Geophys. Res., 112, D11205, doi:10.1029/2006JD007647, 2007.
Kahn, R. A., Chen, Y., Nelson, D. L., Leung, F.-Y., Li, Q., Diner, D. J., and Logan, J. A.: Wildfire Smoke Injection Heights – Two Perspectives from Space, Geophys. Res. Lett., 35, L04809, doi:10.1029/2007GL032165, 2008.
Kaufman, Y. J., Justice, C. O., Flynn, L. P., Kendall, J. D., Prins, E. M., Giglio, L., Ward, D. E., Menzel, W. P., and Setzer, A. W.: Potential global fire monitoring from EOS-MODIS, J. Geophys. Res., 103, 32315–32338, 1998.
Kochi, I., Champ, P. A., Loomis, J. B., and Donovan, G. H.: Valuing mortality impacts of smoke exposure from major southern California wildfires, J. Forest Econ., 18, 61–75, doi:10.1016/j.jfe.2011.10.002, 2012.
Levin, E. J. T.: Remote Continental Aerosol Characteristics in the Rocky Mountains of Colorado and Wyoming, Ph.D. thesis, Col-orado State University, Fort Collins, CO, 2013.
Levy, R. C., Remer, L. A., Kleidman, R. G., Mattoo, S., Ichoku, C., Kahn, R., and Eck, T. F.: Global evaluation of the Collection 5 MODIS dark-target aerosol products over land, Atmos. Chem.
Phys., 10, 10399–10420, doi:10.5194/acp-10-10399-2010, 2010. Mitchell, K.: Health advisory issued due to smoke in Colorado from Wyoming fires, DenverPost (07/04/2012), available at: http://www.denverpost.com/breakingnews/ci 21005970/ health-advisory-issued-due-smoke-colorado-from-wyoming (last access: 5 February 2013), 2012.
Moroney, C., Davies, R., and Muller, J.-P.: Operational retrieval of cloud-top heights using MISR data, IEEE T. Geosci. Remote, 40, 1541–1546, 2002.
Naeher, L., Brauer, M., Lipsett, M., Zelikoff, J., Simpson, C., and Koenig, J.: Woodsmoke health effects: a review, Inhal. Toxicol., 19, 67–106, 2007.
NOAA’s NCDC: Climate of 2002: Wildfire Season Sum-mary (12/16/2002), NOAA’s National Climatic Data Cen-ter (06/17/2012), available at: http://www.ncdc.noaa.gov/oa/ climate/research/fire02.html (last access: 5 February 2013), 2002.
Omar, A. H., Winker, D. M., Vaughan, M. A., Hu, Y., Trepte, C. R., Ferrare, R. A., Lee, K.-P., Hostetler, C. A., Kit-taka, C., Rogers, R. R., Kuehn, R. E., and Liu, Z.: The CALIPSO Automated Aerosol Classification and Lidar Ratio Selection Algorithm, J. Atmos. Ocean. Tech., 26, 1994–2014, doi:10.1175/2009JTECHA1231.1, 2009.
Prenni, A. J., DeMott, P. J., Sullivan, A. P., Sullivan, R. C., Kreidenweis, S. M., and Rogers, D. C.: Biomass burning as a potential source for atmospheric ice nuclei: Western wild-fires and prescribed burns, Geophys. Res. Lett., 39, L11805, doi:10.1029/2012GL051915, 2012.
Ridley, D. A., Heald, C. L., and Ford, B.: North African dust export and deposition: A satellite and model perspective, J. Geophys. Res.-Atmos., 117, D02202, doi:10.1029/2011JD016794, 2012. Sameenoi, Y., Panymeesamer, P., Supalakorn, N., Koehler, K.,
Chailapakul, O., Henry, C., and Volckens, J.: Microfluidic paper-based analytical device for aerosol oxidative activity, Environ Sci Technol., 47, 932–940, doi:10.1021/es304662w, 2013.
Shi, Y., Zhang, J., Reid, J. S., Hyer, E. J., and Hsu, N. C.: Critical evaluation of the MODIS Deep Blue aerosol optical depth prod-uct for data assimilation over North Africa, Atmos. Meas. Tech., 6, 949–969, doi:10.5194/amt-6-949-2013, 2013.
Spracklen, D. V., Mickley, L. J., Logan, J. A., Hudman, R. C., Yevich, R., Flannigan, M. D., and Westerling, A. L.: Impacts of climate change from 2000 to 2050 on wildfire activity and car-bonaceous aerosol concentrations in the western United States, J. Geophys. Res., 114, D2030, doi:10.1029/2008JD010966, 2009. Tosca, M., Randerson, J., Zender, C., Nelson, D., Diner, D., and
Logan, J.: Dynamics of fire plumes and smoke clouds associated with peat and deforestation fires in Indonesia, J. Geophys. Res., 116, D08207, doi:10.1029/2010JD015148, 2011.
Trentmann, J., Andreae, M. O., Graf, H.-F., Hobbs, P. V., Ottmar, R. D., and Trautmann, T.: Simulation of a biomass-burning plume: Comparison of model results with observations, J. Geo-phys. Res., 107, D24013, doi:10.1029/2001JD000410, 2002. Val Martin, M., Honrath, R., Owen, R. C., Pfister, G., Fialho, P., and
Barata, F.: Significant enhancements of nitrogen oxides, ozone and aerosol black carbon in the North Atlantic lower free tropo-sphere resulting from North American boreal wildfires, J. Geo-phys. Res., 111, D23S60, doi:10.1029/2006JD007530, 2006. Val Martin, M., Logan, J. A., Kahn, R. A., Leung, F.-Y., Nelson,
North America: analysis of 5 years of satellite observations, At-mos. Chem. Phys., 10, 1491–1510, doi:10.5194/acp-10-1491-2010, 2010.
Val Martin, M., Kahn, R. A., Logan, J. A., Paugam, R., Wooster, M., and Ichoku, C.: Space-based observational constraints for 1-D plume rise models, J. Geophys. Res., 117, D22204, doi:10.1029/2012JD018370, 2012.
van der Werf, G. R., Randerson, J. T., Giglio, L., Collatz, G. J., Mu, M., Kasibhatla, P. S., Morton, D. C., DeFries, R. S., Jin, Y., and van Leeuwen, T. T.: Global fire emissions and the contribution of deforestation, savanna, forest, agricultural, and peat fires (1997– 2009), Atmos. Chem. Phys., 10, 11707–11735, doi:10.5194/acp-10-11707-2010, 2010.
Vedal, S. and Dutton, S. J.: Wildfire air pollution and daily mortality in a large urban area, Environ. Res., 102, 29–35, doi:10.1016/j.envres.2006.03.008, 2006.
Westerling, A. L., Hidalgo, H. G., Cayan, D. R., and Swet-nam, T. W.: Warming and Earlier Spring Increase West-ern U.S. Forest Wildfire Activity, Science, 313, 940–943, doi:10.1126/science.1128834, 2006.
Wiedinmyer, C., Akagi, S. K., Yokelson, R. J., Emmons, L. K., Al-Saadi, J. A., Orlando, J. J., and Soja, A. J.: The Fire INventory from NCAR (FINN): a high resolution global model to estimate the emissions from open burning, Geosci. Model Dev., 4, 625– 641, doi:10.5194/gmd-4-625-2011, 2011.
Winker, D. M., Vaughan, M. A., Omar, A., Hu, Y., Pow-ell, K. A., Liu, Z., Hunt, W. H., and Young, S. A.: Overview of the CALIPSO mission and CALIOP data pro-cessing algorithms, J. Atmos. Ocean. Tech., 26, 2310–2323, doi:10.1175/2009JTECHA1281.1, 2009.
Winker, D. M., Tackett, J. L., Getzewich, B. J., Liu, Z., Vaughan, M. A., and Rogers, R. R.: The global 3-D distribution of tro-pospheric aerosols as characterized by CALIOP, Atmos. Chem. Phys., 13, 3345–3361, doi:10.5194/acp-13-3345-2013, 2013.


![[PDF] Documentation vba Access 2010 en pdf | Télécharger PDF](data:image/gif;base64,R0lGODlhAQABAIAAAP///wAAACH5BAEAAAAALAAAAAABAAEAAAICRAEAOw==)