HAL Id: hal-00295668
https://hal.archives-ouvertes.fr/hal-00295668
Submitted on 15 Jun 2005
HAL is a multi-disciplinary open access
archive for the deposit and dissemination of
sci-entific research documents, whether they are
pub-lished or not. The documents may come from
teaching and research institutions in France or
abroad, or from public or private research centers.
L’archive ouverte pluridisciplinaire HAL, est
destinée au dépôt et à la diffusion de documents
scientifiques de niveau recherche, publiés ou non,
émanant des établissements d’enseignement et de
recherche français ou étrangers, des laboratoires
publics ou privés.
One-year record of organic and elemental carbon in fine
particles in downtown Beijing and Shanghai
F. Yang, K. He, B. Ye, X. Chen, L. Cha, S. H. Cadle, T. Chan, P. A. Mulawa
To cite this version:
F. Yang, K. He, B. Ye, X. Chen, L. Cha, et al.. One-year record of organic and elemental carbon
in fine particles in downtown Beijing and Shanghai. Atmospheric Chemistry and Physics, European
Geosciences Union, 2005, 5 (6), pp.1449-1457. �hal-00295668�
www.atmos-chem-phys.org/acp/5/1449/ SRef-ID: 1680-7324/acp/2005-5-1449 European Geosciences Union
Chemistry
and Physics
One-year record of organic and elemental carbon in fine particles in
downtown Beijing and Shanghai
F. Yang1,2, K. He1, B. Ye3, X. Chen2, L. Cha2, S. H. Cadle4, T. Chan4, and P. A. Mulawa4
1Department of Environmental Science and Engineering, Tsinghua University, Beijing 100084, China
2Department of Electronic Engineering, Tsinghua University, Beijing 100084, China
3College of Environmental Science and Engineering, Tongji University, Shanghai 200092, China
4GM R&D Center, Chemical and Environmental Sciences Laboratory, MC 480-106-269, Warren, MI 48090, USA
Received: 7 December 2004 – Published in Atmos. Chem. Phys. Discuss.: 14 January 2005 Revised: 14 April 2005 – Accepted: 17 May 2005 – Published: 15 June 2005
Abstract. Weekly PM2.5 samples were collected for one
year (1999–2000) in Beijing and Shanghai and the car-bonaceous species analyzed to investigate and compare their time series patterns and possible sources in the two biggest cities of China. Weekly carbonaceous concentrations
var-ied in wide ranges with 8.6–59 µg m−3 for OC and 1.5–
25.4 µg m−3 for EC in Beijing, and with 5.1–38.4 µg m−3
for OC and 2.3–13.0 µg m−3 for EC in Shanghai.
Simi-lar weekly and seasonal variations of OC and EC concen-trations were found in each city though major combustion sources presented source-dependent emission characteristics and seasonal differences in emission amount for carbona-ceous species. Both OC and EC maintained much higher concentrations in late fall through winter, probably due to enhanced emissions coupled with unfavorable
meteorologi-cal conditions. In Beijing, the14C analysis of limited
sam-ples suggested there was a significant contribution (33–48%) of modern carbon to the total fine carbonaceous PM bur-den with higher fractions in the harvest seasons. The high mass ratios of excessive potassium to EC in both Beijing and Shanghai also indicated that biomass burning had important contribution to fine carbonaceous particles.
1 Introduction
Organic and element carbon (OC and EC) aerosol are usu-ally concentrated in the fine size class and typicusu-ally constitute a significant, sometimes dominant, fraction of the total fine particle mass, especially in urban areas (Castro et al., 1999; Andrews et al., 2000). EC is released directly from the in-complete combustion of fossil fuels and biomass while OC, an aggregate of hundreds of individual compounds spanning
Correspondence to: K. He
(hekb@tsinghua.edu.cn)
a wide range of chemical and thermodynamic properties, is formed by a variety of processes, including combustion and secondary organic carbon (SOC) formation. Recently, in-creased attention has been focused on the carbonaceous com-ponent of fine particulate matter (PM) because of the role OC and EC play in visibility reduction, the radiative budget of the atmosphere (Malm and Day, 2000; Jacobson, 2001), and their potential to influence many heterogeneous reactions involving atmospheric aerosols and trace gases (Lary et al., 1999), and because of the suspected health effects of some of the individual OC components of known toxicity such as PAHs. Jacobson (2002) concludes, based on a global-model calculation, that control of fossil-fuel carbonaceous PM is possibly the most effective method of slowing global warm-ing, along with improving human health. In the meantime, China is of great concern because its high rates of usage of coal and biofuels, which are primarily responsible for high black (element) carbon (BC) emissions (Streets et al., 2001). Menon et al. (2002) suggest that the observed trend in China over the past several decades, with increased summer floods in the south and drought in the north, may be related to in-creased BC aerosols.
With recent rapid industrialization and urbanization, the city-clusters have formed in the three most developed regions in China through the connection of intensive economic activ-ities. These regions, all located in the eastern coast areas, are Pearl River Delta Region (PRDR), Yangtze River Delta Re-gion (including Shanghai, Jiangsu and Zhejiang provinces), and Beijing-Tianjin Region. Due to booming economic ac-tivities and fast increased vehicle population within the re-gions, high PM levels and poor visibility have become a com-mon serious problem. According to the 1997 China Envi-ronmental Situation Report (State EnviEnvi-ronmental Protection Administration of China, 1998), Guangzhou, Shanghai, and Beijing, the center in each of these regions, are the worst for
1450 F. Yang et al.: Organic and elemental carbon in Beijing and Shanghai
of over 100 µg m−3, implying vehicular pollution is getting
more and more serious while coal smoke pollution is still far to be under effective control. These two kinds of ma-jor sources are believed to emit abundant fine carbonaceous particles aside from biomass burning in the urban areas of China.
Cao et al. (2003) investigated the relative contribution of
carbonaceous aerosol to PM2.5/PM10and SOC production in
PRDR based on ambient sampling during 2002 winter pe-riod. Their study demonstrated that carbonaceous aerosol
was a significant contributor to PM2.5 and SOC was an
im-portant component of fine organic PM with an average frac-tion of 42.6%. To our knowledge, there are very limited re-searches focusing on fine carbonaceous particles reported to date for the urban areas of the latter two regions (He et al., 2004; Dan et al., 2004), which are based on short-term mea-surement with the overall sampling period rarely exceeding a
few weeks. We initiated a 1-year PM2.5monitoring program
in 1999 in Beijing and Shanghai. We showed that carbona-ceous and secondary ionic species (e.g., sulfate, nitrate, and
ammonium) dominated the PM2.5 in the two cities (He et
al., 2001; Ye et al., 2003). This study is a part of that pro-gram with a focus on the time series of carbonaceous species, their possible sources and comparison for the two urban ar-eas during a 1-year period. This information will provide a baseline to examine the reasons of heavy carbonaceous par-ticulate pollution and its trends and has implications for local and regional PM control effectiveness in China.
2 Sampling and analysis
Beijing, the capital of China, is located at the northwestern
border of the Great North China Plain at 39◦480N latitude
and 116◦280E longitude. The main terrain of Beijing is plain,
with mountain embaying in 3 directions, and on southeast, plain turns into a “dustpan” spreading forward. The area of planning district only takes 6% of the total area of Beijing, but 50% of the total population, 80% of buildings, 60% of the industrial output value and 80% of the energy consumption are concentrated here. Shanghai, a national commercial
cen-ter, is situated at the mouth of the Yangtze River at 31◦140N
latitude and 121◦190E longitude. It is bordered by the East
China Sea on the east and Hangzhou Bay on the south. Pop-ulation is also strongly concentrated in the inner urbanized area of Shanghai municipality. The special geographical en-vironment and deficient city planning of Beijing make the air pollution stagnant over the urban area, which can not be eas-ily expelled relative to that in Shanghai. The PM concentra-tion level in Beijing is usually about twice that in Shanghai. For example, the annual mean concentrations of the total
sus-pended particles (TSP) in 1999 were 364 and 188 µg m−3in
Beijing and Shanghai, respectively.
Ambient PM2.5 sampling was conducted simultaneously
at a pair of locations (Chegongzhuang and Tsinghua in
Bei-jing and Hainan Road and Tongji in Shanghai) from July 1999 to June 2000 in Beijing and in Shanghai from March 1999 to March 2000. Chegongzhuang lies in urban area in Beijing but not Tsinghua while the two Shanghai sites both locate in urban area. Our former papers have shown
impres-sive similarity in PM2.5 concentration and composition for
the two locations in each city of Beijing and Shanghai (He et al., 2001; Ye et al., 2003). In this study we therefore choose Chegongzhuang and Tongji sites to represent urban areas of each city for further comparative analysis since the sampling period was longer at the Tongji site than at Hainan Road (Ye et al., 2003). The sampling sites were about 3 m and 16 m above the ground in Beijing and Shanghai, respectively. Both sites were approximately 50 m from major roads. During the study period, 49 and 51 sets of samples were collected at each site in Beijing and Shanghai, respectively. More detailed in-troduction of the sampling locations, the ambient sampling
and chemical analyses of PM2.5, and the quality assurance
employed in this study are referred to He et al. (2001) and Ye et al. (2003).
Roughly, special low flow rate samplers equipped with
three cassettes for collecting PM2.5 for speciation
analy-sis, each at an identical flow rate of 0.4 l min−1, were used
(Aerosol Dynamics, USA). The total volume filtered for each
sample was about 4 m3 on average. Of the three parallel
sampling cassettes, a tandem-filter PM2.5 cassette
accom-modates two Gelman (Ann Arbor, MI) quartz-fiber filters (#2500 QAT-UP) for carbon analysis. These filters were
pre-fired at 900◦C in air for a minimum of three hours to remove
any carbon. The front quartz filter of the tandem-filter PM2.5
cassette was analyzed for OC and EC by the thermal/optical reflectance (TOR) method at the Desert Research Institute (DRI) in Reno, NV (Chow et al., 1993a). Measurement range of carbon mass analyzed per sample is 0.2–750 µg C and total carbon precision is ±3% for sample load ≥10 µg C and ±0.5 µg C for sample load <10 µg C. Uncertainties in
OC and EC measurements were both 0.8 µg m−3(He et al.,
2001). A subset of the backup quartz filters was also ana-lyzed for volatilized/adsorbed carbon.
Carbonate carbon is a minor fraction in fine particles and usually ignored (Chow et al., 1993b). Based on 13 TSP sam-ples collected during March-June 2001 in Beijing, Zhang and Dong (2002) reported that carbonate carbon amounted to 0.1–0.7% of TSP mass for common samples while the values were 1.0%, 1.3%, and 1.7% for 3 dust storm samples, respec-tively. It is expected that its mass percentages in fine particles are much less than this range, since it is dominantly in coarse
mode. This is also supported by the fact that PM2.5
consti-tuted only 8% of TSP for the week (6–13 April) of the most serious dust storm in 2000 compared to a whole year aver-age 29% (Yang et al., 2002). Given the total carbon
com-prises about 28% of PM2.5 mass as mentioned below, it is
presumed that carbonate carbon usually constitutes no more than 5% of the total carbon in fine particles even for the sam-ples impacted by dust storms. In addition, the mass ratio of
OC to EC in this week (3.0) is close to its annual mean (2.9), probably indicating carbonate should not represent a
signif-icant fraction of the PM2.5samples collected over one week
covering dust period. The carbonate procedure is therefore not applied in carbon analysis.
In a key review paper Turpin et al. (2000) comment on the sampling artifacts of OC. Mader et al. (2003) also investigate in a very recent work this issue for several different sampling configurations with sampling intervals from less than one hour to 24 h, and point out large difference between uncor-rected and properly coruncor-rected sampling. To our knowledge, there is no such investigation on a weeklong sampling config-uration adopted in this study, of which the 1-week sampling periods exacerbate the possible loss of semi-volatile organic compounds during sampling (He et al., 2001). It is uncertain to what extent the use of the backup quartz filter improves the accuracy of OC measurements. Therefore, the OC results re-ported in this paper are uncorrected, i.e. the front quartz-fiber filter only. It is noted, however, that we analyzed the backup quartz samples once every four weeks, and the backup filter average OC concentrations were about 35% of those on the front quartz samples in our Beijing study.
The Teflon-membrane filter of the single-filter PM2.5
cas-sette was also analyzed for mass by gravimetry and for ele-ments including K and Fe by x-ray fluorescence (XRF) us-ing standard methods at DRI (Chow and Watson, 1994). For a limited set of samples collected at Chegongzhuang using
the same sampler in 2001, they were analyzed for 14C at
the National Ocean Sciences Accelerator Mass Spectrome-try (NOSAMS) Facility at the Woods Hole Oceanographic Institution using standard NOSAMS procedures (McNichol et al., 1994; Pearson et al., 1998), aside from OC and EC at DRI using the TOR method. Briefly, weighed portions of filters were transferred to pre-combusted Vycor tubes con-taining CuO and Ag powder. After evacuation, samples were
sealed and combusted to CO2at 850◦C for 5 h. After
purifi-cation and quantifipurifi-cation, a split of the CO2was analyzed for
δ13C analysis, and the remainder was reduced to graphite for
14C analysis. For this AMS facility, the minimum nominal
sample size is 25 µg C (1 µg modern carbon equivalent), and total carbon processing blank value is small (ca. 0.6 µg) and is taken into account by the calculation procedures (Currie et al., 2000).
3 Results and discussion
3.1 Time series of OC and EC
As shown in Fig. 1, OC and EC exhibited similar weekly variations in both Beijing and Shanghai. Weekly
concentra-tions of OC ranged from 8.6 to 59 µg m−3 in Beijing and
from 5.1 to 38.4 µg m−3 in Shanghai, while those of EC
varied from 1.5 to 25.4 µg m−3in Beijing and from 2.3 to
13.0 µg m−3in Shanghai. OC and EC concentrations
expe-0 10 20 30 40 50 60 20/ 03-10/ 04-10/ 05-31/ 05-21/ 06-14/ 07-05/ 08-26/ 08-16/ 09-06/ 10-27/ 10-18/ 11-09/ 12-30/ 12-20/ 01-10/ 02-02/ 03-23/ 03-13/ 04-04/ 05-25/
05-Sampling starting date (dd/mm)
O C an d E C c o n c . ( µ g m -3) (a) OC EC 0 10 20 30 40 50 60 20/ 03-10/ 04-10/ 05-31/ 05-21/ 06-12/ 07-02/ 08-23/ 08-13/ 09-04/ 10-25/ 10-16/ 11-07/ 12-28/ 12-17/ 01-07/ 02-28/ 02-20/ 03-13/ 04-04/ 05-25/
05-Sampling starting date (dd/mm)
O C an d E C c o n c . ( µ g m -3) (b) OC EC
Fig. 1. Time series of weekly OC and EC concentrations in Beijing (a) and Shanghai (b).
rienced more or less significant variations from week to week in both Beijing and Shanghai. From late spring to early fall, weekly OC and EC concentrations varied in low magnitude relative to other times. This was reasonable since the local winds were usually mild during this period.
In Beijing, high weekly concentrations of OC and EC
(>30 µg m−3) occurred from the beginning of October
through the end of February, probably due to much enhanced combustion source emissions coupled with low dispersion meteorology. On the other hand, the prevailing northwest airflow could cause rapid dispersion of pollution-derived fine particles including carbonaceous particles from local emis-sions while increase regional and/or local soil dust (Yang et al., 2005), thereby resulting in their strong weekly variations. The week of 18–25 November saw the maximum OC and EC concentrations for the study period. Given space heating started on 15 November, it was evident that coal combus-tion emissions increased dramatically. In the meantime, low
daily wind speed (<1.4 m s−1except on 24 November) and
high relative humidity (65–91% from 20–23 November) fa-vored trapping pollutants since dispersion was low, thereby increasing the accumulation of fine carbonaceous particles. In the next week, the OC and EC concentrations dropped by 55% and 68%, respectively due to snowfall and much better meteorology for atmospheric dispersion.
In Shanghai, high weekly concentrations of OC and EC
(>20 µg m−3) corresponded to the period from late
1452 F. Yang et al.: Organic and elemental carbon in Beijing and Shanghai 0 10 20 30 40 50
Spring Summer Fall Winter
O C and E C c onc ent ra ti o n s ( µ g m -3 ) 0 1 2 3 4 5 OC /E C BJ OC BJ EC SH OC SH EC BJ OC/EC SH OC/EC
Fig. 2. Seasonal variations of OC and EC concentrations and OC/EC in Beijing (BJ) and Shanghai (SH).
and their weekly variations were much lower than those in Beijing. Though there is no official central space heating, combustion source emissions could also be enhanced due to cold weather with weekly average temperature ranging 0–
10◦C in this period (Ye et al., 2003). Compared to those in
Beijing, northerly cold fronts usually become much weaker even when they could reach Shanghai, thereby causing much less weekly variations in OC and EC concentrations. Owing to mixed influences of different processes on the loadings of ambient carbonaceous species, consecutive sampling with higher resolution would be more appropriate to interpret their temporal variations with meteorological episodes in different seasons.
As shown in Fig. 2, clear seasonal patterns in carbona-ceous species were observed in the two cities. OC and EC both exhibited much higher concentrations in fall and winter and much lower concentrations in spring and summer. It is noted that this seasonality also corresponded to that of their differences between Beijing and Shanghai to some degree. In Beijing, the average concentrations of OC and EC in the
winter were 30.2 and 10.5 µg m−3, 26% and 19% higher than
their annual means, respectively. In Shanghai, the winter av-erage concentration of OC was very close to the lowest sea-sonal OC value in Beijing while that of EC was intermediate between the high and low seasonal EC values in Beijing.
This seasonal variation is likely due to a combination of changes in emission rates and seasonal meteorology. Low summer concentrations can be explained in part by the fact that about three quarters of its annual precipitation (584 mm on average) in Beijing occurs in this season (Yang et al., 2004). Shanghai also receives abundant rains in the summer with about half of its annual precipitation (1040 mm on aver-age) falling during the May-September flood season. Given that it was the coldest winter in the last 23 years in Beijing,
during which weekly average temperatures were about 10◦C
lower than in Shanghai (He et al., 2001; Ye et al., 2003), the high concentrations of carbonaceous species could be due to
enhanced space heating activities as well as to longer vehicle cold starts (Chow et al., 1993b; Singer et al., 1999). In addi-tion, the low temperature and frequent inversion conditions were also likely favorable for the formation of secondary or-ganic aerosol according to the study by Sheehan and Bow-man (2001) using an absorptive-partitioning model.
3.2 Concentration levels of carbonaceous species
Descriptive statistics of the average concentrations of OC, EC, total carbon (TC, i.e. sum of OC and EC), particulate organic matter (POM), and the percentages of TC and POM
in PM2.5 for this study are summarized in Table 1.
Accord-ing to a recent work by Turpin and Lim (2001), urban POM may be better estimated by multiplying the amount of OC by 1.6±0.2. The factor of 1.6 is adopted in the current study. The literature values from urban areas of Guangzhou (Cao et al., 2003), Los Angeles (Kim et al., 2000), and Chongju in Korea (Lee et al., 2001) are also included for comparison. All these studies except Guangzhou study covered a period of about one year, and adopted the same method (TOR) and analyzer (DRI products) to measure carbonaceous species, thus these results are of high comparability. Chongju is a medium sized subtropical coastal city without serious atmo-spheric pollution problems, while Los Angeles is a megacity with air pollution mainly caused by vehicular emissions dur-ing the study period. Coal combustion is not a major source of PM in these two foreign cities.
The average concentrations of OC and EC in Beijing were 55% and 30% higher than those in Shanghai, respectively. It is noted that these concentration levels and the calculated amount and percentages of TC and POM were very close to those measured in the winter months of 2002 in Guangzhou,
which had the highest PM2.5 mass and carbonaceous
con-centrations among the urban areas of PRDR (Cao et al., 2003). These comparisons indicate that Beijing was heav-ily polluted by fine carbonaceous particles and their majori-ties likely originated from anthropogenic sources. Attention should also be paid to high OC and EC levels in Shanghai.
TC was the most abundant single species of PM2.5in both
Beijing and Shanghai. The fraction of PM2.5mass was
high-est in Shanghai and lowhigh-est in Chongju while Beijing and Guangzhou had intermediate values. POM accounted for
more than 30% of PM2.5 mass in all the listed
metropoli-tans. OC was the predominant contributor to TC with an average percentage of more than 70% in both Beijing and Shanghai. The average EC fractions of TC in the three Chi-nese megacities were very close (27–29%), much lower than in Los Angeles (39%) and Chongju (47%) but the measured EC concentrations were much higher. This is likely to be their difference in major sources for carbonaceous species.
Coal is used in both honeycomb briquette stoves and in-dustrial coal-burning boilers in Chinese cities including
Bei-jing and Shanghai. Both of these sources emitted
abun-dant carbonaceous particles as reported before by Chen et
Table 1. Statistical summary of the concentrations (µg m−3) and percentages of carbonaceous species in PM2.5in Beijing, Shanghai, and
other cities.
Locations Sampling period OC EC TC POM TC/PM2.5 POM/PM2.5
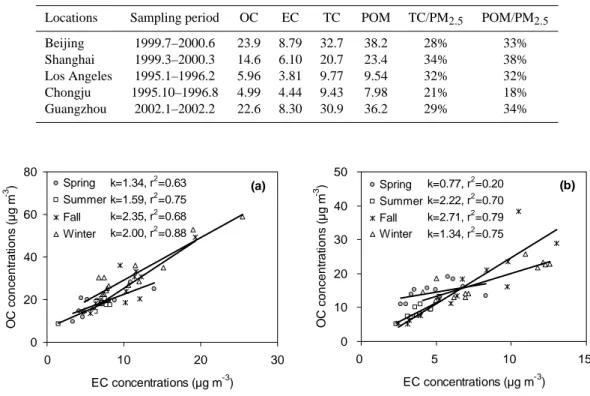
Beijing 1999.7–2000.6 23.9 8.79 32.7 38.2 28% 33% Shanghai 1999.3–2000.3 14.6 6.10 20.7 23.4 34% 38% Los Angeles 1995.1–1996.2 5.96 3.81 9.77 9.54 32% 32% Chongju 1995.10–1996.8 4.99 4.44 9.43 7.98 21% 18% Guangzhou 2002.1–2002.2 22.6 8.30 30.9 36.2 29% 34% 0 20 40 60 80 0 10 20 30 EC concentrations (µg m-3) O C c o nc e n tr at ions (µ g m -3 ) Spring Summer Fall Winter 0 10 20 30 40 50 0 5 10 15 EC concentrations (µg m-3) O C concent ra ti ons ( µ g m -3 ) Spring Summer Fall Winter k=0.77, r2=0.20 k=2.22, r2=0.70 k=2.71, r2=0.79 k=1.34, r2=0.75 (a) (b) k=1.34, r2=0.63 k=1.59, r2=0.75 k=2.35, r2=0.68 k=2.00, r2=0.88
Fig. 3. Seasonal correlations of OC and EC concentrations in Beijing (a) and Shanghai (b).
al. (1994) and Zhang et al. (2000), respectively. Consider-ing the annual coal consumption was much less in BeijConsider-ing than in Shanghai (26.5 and 39.6 million tons in 1999, re-spectively), it was expected that the emission intensities of fine carbonaceous particles were probably much higher in Beijing. Shanghai used its coal mainly in power plants and industrial sectors while Beijing consumed major its coal in winter due to residential heating (about 23% of coal was used for this purpose alone). Even in downtown area of Beijing there were many residential areas without central space heat-ing and gas supplyheat-ing system, where residents includheat-ing a significant migrant population (about 3 million in all) tended to burn low quality honeycomb briquettes or even raw coal for heating and cooking. Since the emissions from these coal combustion activities are emitted near ground level, and are likely to be higher per unit mass of coal than for boilers, their contribution to high winter levels of carbonaceous species in Beijing is likely to be significant. This is supported by the
fact that the abundance of OC in PM2.5 from a honeycomb
coal stove was one order of magnitude greater than that from a utility boiler (Chen et al., 1994).
In addition, it was popular to burn maize and wheat residue in situ especially in the northern rural areas. For this kind of biomass burning it was reported that over 60% was emitted as carbonaceous particulate (Watson and Chow, 2001). An-other possible factor was that the SOC contribution was
dif-ferent between Beijing and Shanghai due to their differences in both atmospheric oxidation ability and the amount of the gaseous organic pollutants that may transform into fine parti-cles. At last, the geographical and meteorological conditions could also be important reasons for different carbonaceous intensity in fine particles between Beijing and Shanghai as mentioned above. In the future study, an emission inventory and a source profile of carbonaceous particles will help ex-plain in a quantitative way the intercity difference or seasonal variability in OC and EC levels.
3.3 Relationship between OC and EC
As mentioned above, the obvious temporal coherence be-tween OC and EC was observed for both Beijing and Shang-hai samples. Further statistical analysis indicated they were strongly correlated with a correlation coefficient r=0.90 for 47 samples in Beijing and r=0.82 for 51 samples in
Shang-hai. These co-varying patterns suggested that the
ambi-ent concambi-entration levels of carbonaceous species were con-trolled by similar processes including source emissions and atmospheric dispersion, and that OC and EC were likely at-tributable to their common dominant sources of combustion such as coal burning.
When split seasonally, OC and EC presented somewhat different correlations (Fig. 3). In Beijing, they were highly
1454 F. Yang et al.: Organic and elemental carbon in Beijing and Shanghai
Table 2. Modern carbon fraction in 2001 PM2.5samples from Beijing.
Season Sampling duration dd/mm OC µg m−3 EC µg m−3 TC µg m−3 PM2.5µg m−3 Modern carbon fraction∗∗
Winter 11–18/01 43.2 7.8 50.9 160.5 33.7% Winter 15–22/02 37 12 50 208.4 33.0% Spring 08–15/03 26.6 6.4 33 137.8 38.1% Spring 15–22/03, 05–12/04∗ 16.3 6.6 22.9 99.2 39.4% Summer 14–21/06 18.7 9.1 27.8 105.4 48.1% Summer 12–19/07, 09–16/08∗ 15.4 6.9 22.3 83.3 38.9% Fall 20–27/09, 04–11/10∗ 19.3 9.4 28.7 79.4 42.3% Fall 08–15/11 22.6 11.9 34.4 105.2 45.7% ∗ 2-week sample. ∗∗Corrected for δ13C.
associated in all the seasons with r ranging from 0.79 to 0.94, while in Shanghai they were strongly correlated in the sum-mer through winter with r=0.75–0.93, but not distinctly cor-related in the spring with r=0.45. The wide variations in regression slopes with k=1.34–2.00 in Beijing and k=0.77– 2.71 in Shanghai probably indicated their seasonal variability and intercity difference in OC contributions from combustion sources.
The mass ratio of OC to EC (OC/EC) can be used to inter-pret the emission and transformation characteristics of car-bonaceous aerosol. Weekly OC/EC ranged from 1.7 to 5.8 with an average of 2.9 in Beijing, and from 1.6 to 4.3 with an average of 2.5 in Shanghai. The OC/EC ratios exhibited weekly variations while no clear seasonal trends were found for the study period in both Beijing and Shanghai (Fig. 2). For most of the samples, the weekly OC/EC ratios shifted between 2.0 and 4.0 in the two cities. As mentioned be-low, OC/EC ratios are quite different for different sources, of which the emissions are more or less seasonally different through out the year. We do not have an explanation now for the observed OC/EC results of varying impacts of dif-ferent sources, including regional transport of PM within the city clusters mentioned above. Additional work is ongoing to better understand the emission characteristics and activity levels for the major sources of carbonaceous species, and the regional contribution to the Beijing and Shanghai aerosols.
3.4 Sources of carbonaceous species
The fractions of organic aerosols from primary and sec-ondary sources are not generally known although modeling efforts are proceeding. Because EC originates solely as a pri-mary emission and is inert in the atmosphere, it is often used as a tracer of primary OC. Ambient ratios of OC/EC that are greater than the OC/EC ratio of the primary aerosol indi-cate times when secondary formation occurred. An OC/EC ratio exceeding 2.0–2.2 has been used to indicate the pres-ence of secondary organic aerosols in some studies (Turpin et al., 1990; Chow et al., 1996). If that was true for Beijing
and Shanghai aerosol, SOC was formed during most of the study period. However, it is difficult to conclude the pres-ence of SOC from the absolute values of OC/EC alone since OC/EC ratios are strongly source dependent and therefore quite variable (Watson et al., 2001; Na et al., 2004). Ac-cording to a source profile measured in Beijing by Chen et al. (1994), the OC/EC ratios for emissions from honeycomb coal stove, briquette stove, utility boiler, and industrial boiler were 8.54, 1.05, 2.32, and 2.51, respectively. For differ-ent tropical biomass burning, the OC/EC was as high as 9.0 (Cachier et al., 1989). Overall, the combustions of coal and biomass exhibited much higher OC/EC ratios than that for motor vehicle (1.1) measured by Watson et al. (2001), and thereby likely important contributors to high ambient OC/EC
ratios of PM2.5 in both Beijing and Shanghai, which were
much greater than those in Chongju (Lee et al., 2001) and Los Angeles (Kim et al., 2000).
EC production is uniquely related to combustion including both fossil fuel and biomass burning while the combustion of the fossil fuel, especially of petroleum products seems to
generate little non soil potassium Kexcess. Therefore,
An-dreae (1983) suggests the mass ratio of Kexcess to EC may
prove an important tracer in the source identification of pol-lutant aerosol. We estimate soil potassium using the mass ra-tio of K to Fe in Beijing and Shanghai crusts of 0.65 and 0.56, respectively (China Environmental Monitoring Center, 1990; Yang et al., 2005). Considering sea salt particles are usually
in coarse mode, we calculate Kexcessin PM2.5by subtracting
soil potassium from total potassium. In fact, sea salt had very limited impact even on aerosols and dry and wet depositions
in Beijing (Yang et al., 2003). The calculated Kexcess/EC
ranged between 0.10–0.51 with an average of 0.23±0.08 in Beijing. This average ratio were much higher than those ob-served in the United States (0.025 to 0.09) and close to the lower end of the values measured on aerosols dominated by brush-fire emissions collected in Brazil (0.21 to 0.46) (An-dreae, 1983), probably suggesting that biomass burning had important contribution to fine carbonaceous particles in
Bei-jing. In Shanghai, the Kexcess/EC ratio exhibited somewhat
lower average with much larger deviation (0.19±0.15) than that in Beijing, also implying that fine carbonaceous pollu-tion in Shanghai was also significantly affected by biomass burning. This argument is supported by the work of Xu et al. (2002), who claimed that a significantly fraction of
the high OC mass in PM2.5 (44 µg m−3)measured at Linan
in the rural Yangtze Delta Region was likely attributed to biomass burning activities after rice harvest.
14C analysis of a limited set of samples collected at
Chegongzhuang in different seasons of 2001 showed the fraction of modern carbon, which originates from modern sources such as biomass burning and restaurant emissions as opposed to the fraction that originates from fossil fuel sources such as coal or petroleum based products, ranged from 33% to 48% with an overall average of 40% (Table 2). Given close annual coal consumption in Beijing in recent years, the obvious similarities in the average OC and EC
con-centrations (25.8 and 8.73 µg m−3, respectively), the EC
centage of the total carbon (28%), and the total carbon
per-centage of the total PM2.5mass (27%) for these selected
sam-ples and those in this study, it is likely that modern carbon fraction determined for these samples is representative of the modern fraction for this study period as well. It is noted that the modern fraction tended to be higher in the later part of 2001 (summer and autumn), likely due to intensive biomass burning – whether of agricultural residues in the field after harvest or land clearing for production of new agricultural fields. Duan et al. (2004) report that biomass burning emis-sions may sometimes account for 43% of OC in TSP at an urban site of Beijing during the wheat harvest season and
suggest much more contribution for PM2.5 as biomass
burn-ing is almost entirely confined in the submicrometer sized-range. These authors conclude that Beijing aerosols may be heavily influenced by different types of biomass burning all the year long with the maximum influence in June, which corresponds to the date of our highest modern carbon frac-tion value. Overall, it is apparent that there is a significant contribution of modern carbon to the fine carbonaceous PM burden.
4 Conclusions
OC and EC were at quite high levels in Beijing with
an-nual concentration of 23.9 and 8.79 µg m−3, 55% and 30%
greater than those in Shanghai, respectively, indicating Bei-jing was heavily polluted by fine carbonaceous particles and their majorities likely originate from anthropogenic sources. In the two megacities, OC and EC exhibited both weekly and seasonal co-variation patterns though different combus-tion sources presented both different emission characteristics for carbonaceous species and seasonal variations in emis-sion amounts. Strong weekly changes and high levels of OC and EC concentrations occurred in heating season in Beijing, probably due to much enhanced combustion source
emis-sions coupled with frequent meteorological fluctuations
be-tween inversion and northerly cold front. The14C analysis
of limited samples suggests there was a significant contribu-tion (33–48%) of modern carbon to the total fine carbona-ceous PM burden in Beijing with higher fractions in the har-vest seasons. The comparative analysis of EC and excessive potassium also implies fine carbonaceous particulate pollu-tion in both Beijing and Shanghai was strongly influenced by biomass burning throughout the year.
Acknowledgements. This study was funded by the project (20322203) jointly supported by National Natural Science Foun-dation of China and General Motors Corporation, and the “863” project (2003AA641030) from Ministry of Science and Technol-ogy, P.R. China. The authors thank Q. Zhang and Y. Ma for their help in experiment. Thanks are also due to Y. Yan and D. Yao from the GM China Office for their help in handling samples and interfacing with the participants, and J. C. Chow at DRI and A. P. McNichols at WHOI for their timely TOR and 14C analyses, respectively. We thank two anonymous reviewers for providing constructive reviews.
Edited by: R. Hitzenberger
References
Andreae, M. O.: Soot carbon and excess fine potassium: long-range transport of combustion-derived aerosols, Science, 220, 1148– 1151, 1983.
Andrews, E., Saxena, P., Musarra, S., Hildemann, L. M., Koutrakis, P., McMurry, P. H., Olmez, I., and White, W. H.: Concentration and composition of atmospheric aerosols from the 1995 SEAVS experiment and a review of the closure between chemical and gravimetric measurements, J. Air & Waste Manag. Assoc., 50, 648–664, 2000.
Cachier, H., Bremond, M. P., and Buat-Menard, P.: Carbonaceous aerosols from different tropical biomass burning sources, Nature, 340, 371–373, 1989.
Cao, J. J., Lee, S. C., Ho, K. F., Zhang, X. Y., Zou, S. C., Fung, K., Chow, J. C., and Watson, J. G.: Characteristics of carbonaceous aerosol in Pearl River Delta Region, China during 2001 winter period, Atmos. Environ., 37, 1451–1460, 2003.
Castro, L. M., Pio, C. A., Harrison, R. M., and Smith, D. J. T.: Carbonaceous aerosol in urban and rural European atmospheres: estimation of secondary organic carbon concentrations, Atmos. Environ., 33, 2771–2781, 1999.
Chen, Z. L., Ge, S., and Zhang, J.: Measurement and analysis for atmospheric aerosol particulates in Beijing, (in Chinese with En-glish abstract), Res. Environ. Sci., 7 (3), 1–9, 1994.
China National Environmental Monitoring Center: Background values of crustal elements in China, (in Chinese), China Envi-ronmental Science Press, Beijing, 1990.
Chow J. C. and Watson J. G.: Guidelines for PM10Sampling and
Analysis Applicable to Receptor Modeling, US EPA, Office of Air Quality Planning and Standards, Washington D. C., EPA-452/R-94-009, 1994.
Chow, J. C., Watson, J. G., Pritchett, L. C., Pierson, W. R., Frazier, C. A., and Purcell, R. G.: The DRI thermal/optical reflectance
1456 F. Yang et al.: Organic and elemental carbon in Beijing and Shanghai
carbon analysis system: Description, evaluation and applications in U.S. air-quality studies, Atmos. Environ., 27A, 1185–1201, 1993a.
Chow, J. C., Watson, J. G., Lowenthal, D. H., Solomon, P. A., Magliano, K. L., Ziman, S. D., and Richards, L. W.: PM10and
PM2.5 composition in California’s San Joaquin Valley, Aerosol
Sci. Technol., 18, 105–128, 1993b.
Chow, J. C., Watson, J. G., Lu, Z., Lowenthal, D. H., Frazier, C. A., Solomon, P. A., and Thuillier, R. H.: Descriptive analysis of PM2.5and PM10at regionally representative locations during SJVAQS/AUSPEX, Atmos. Environ., 30, 2079–2112, 1996. Currie, L. A., Kessler, J. D., Marolf, J. V., McNichol, A. P., Stuart,
D. R., Donoghue, J. C., Donahue, D. J., Burr, G. S., and Bid-dulph, D.: Low-level (submicromole) environmental14C metrol-ogy, Nucl. Instr. and Meth. B, 172, 440–448, 2000.
Dan, M., Zhuang, G., Li, X., Tao, H., and Zhuang, Y.: The char-acteristics of carbonaceous species and their sources in PM2.5in
Beijing, Atmos. Environ., 38, 3443–3452, 2004.
Duan, F., Liu, X., Yu, T., and Cachier H.: Identification and estimate of biomass burning contribution to the urban aerosol organic car-bon concentrations in Beijing, Atmos. Environ., 38, 1275–1282, 2004.
He, K., Yang, F., Ma, Y., Zhang, Q., Yao, X., Chan, C. K., Cadle, S., Chan, T., and Mulawa, P.: The characteristics of PM2.5 in
Beijing, China, Atmos. Environ., 35, 4959–4970, 2001. He, Z., Kim, Y. J., Ogunjobi, K. O., Kim, J. E., and Ryu, S. Y.:
Car-bonaceous aerosol characteristics of PM2.5 particles in
North-eastern Asia in summer, Atmos. Environ., 38, 1795–1800, 2004. Jacobson, M. Z.: Strong radiative heating due to the mixing state of black carbon in atmospheric aerosols, Nature, 409, 672–695, 2001.
Jacobson, M. Z.: Control of fossil-fuel particulate black car-bon and organic matter, possibly the most effective method of slowing global warming, J. Geophys. Res., 107(D19), 4410, doi:10.1029/2001JD001376, 2002.
Kim, B. M., Teffera, S., and Zeldin, M. D.: Characterization of PM2.5and PM10in the South Coast Air Basin of southern
Cali-fornia: part 1–Spatial variations, J. Air & Waste Manag. Assoc., 50, 2034–2044, 2000.
Lary, D. J., Shallcross, D. E., and Toumi, R.: Carbonaceous aerosols and their potential role in atmospheric chemistry. J. Geophys. Res., 104, 15 929–15 940, 1999.
Lee, H. S. and Kang, B.: Chemical characteristics of principal PM2.5 species in Chongju, South Korea, Atmos. Environ., 35, 739–746, 2001.
Lin, J. J. and Tai, H. S.: Concentrations and distributions of car-bonaceous species in ambient particles in Kaohsiung City, Tai-wan, Atmos. Environ., 35, 2627–2636, 2001.
Mader, B. T., Schauer, J. J., Seinfeld, J. H., Flagan, R. C., Yu, J. Z., Yang, H., Lim, Ho-Jin, Turpin, B. J., Deminter, J. T., Heidemann, G., Bae, M. S., Quinn, P., Bates, T., Eatough, D. J., Huebert, B. J., Bertram, T., and Howell, S.: Sampling methods used for the collection of particle-phase organic and elemental carbon during ACE-Asia, Atmos. Environ., 37, 1435–1449, 2003.
Malm, W. C. and Day, D. E.: Optical properties of aerosols at Grand Canyon national park, Atmos. Environ., 34, 3373–3391, 2000.
McNichol, A. P., Jones G. A., Hutton D. L., Gagnon A. R., and Key R. M.: Rapid analysis of seawater samples at the National Ocean Sciences Accelerator Mass Spectrometry Facility, Woods Hole, MA, Radiocarbon, 36, 237–246, 1994.
Menon, S., Hansen, J., Nazarenko, L., Luo, Y.: Climate effects of black carbon aerosols in China and India, Science, 297, 2250– 2253, 2002.
Na, K., Sawant, A. A., Song, C., and Cocker, D. R.: Primary and secondary carbonaceous species in the atmosphere of Western Riverside County, California, Atmos. Environ., 38, 1345–1355, 2004.
Pearson, A., McNichol, A. P., Schneider, R. J., von Reden, K. F., and Zheng, Y.: Microscale AMS 14C measurements at NOSAMS, Radiocarbon, 40, 61–75, 1998.
Sheehan, P. E. and Bowman, F. M.: Estimated effects on tempera-ture on secondary organic aerosol concentrations, Environ. Sci. Technol., 35, 2129–2134, 2001.
State Environmental Protection Administration of China: The 1997 China Environmental Situation Report, (in Chinese), www.zhb. gov.cn/eic/649368290304458752/index.shtml, 1998.
Singer, B. C., Kirchstetter, T. W., Harley, R. A., Kendall, G. R., and Hesson, J. M.: A fuel-based approach to estimating motor vehicle cold-start emissions, J. Air & Waste Manag. Assoc., 49, 125–135, 1999.
Streets, D. G., Gupta, S., Waldhoff, S. T., Wang, M. Q., Bond, T. C., and Bo, Y.: Black carbon emissions in China, Atmos. Environ., 35, 4281–4296, 2001.
Turpin, B. J. and Lim, H. J.: Species contributions to PM2.5mass concentrations: revisting common assumptions for estimating or-ganic mass, Aerosol Sci. Technol. 35, 602–610, 2001.
Turpin, B. J., Cary R. A., and Huntzicker J. J.: Identification of sec-ondary organic aerosol episodes and quantification of primary and secondary organic aerosol concentrations during SCAQS, Aerosol Sci. Technol., 12, 161–171, 1990.
Turpin, B. J., Saxena, P., and Andrews, E.: Measuring and sim-ulating particulate organics in the atmosphere: problems and prospects, Atmos. Environ., 34, 2983–3013, 2000.
Watson, J. G. and Chow, J. C.: Source characterization of major emission sources in the Imperial and Mexicali Valleys along the US/Mexico border, Sci. Total Environ., 276, 33–47, 2001. Watson, J. G., Chow, J. C., and Houck, J. E.: PM2.5chemical source
profiles for vehicle exhaust, vegetative burning, geological mate-rial, and coal burning in Northwestern Colorado during 1995, Chemosphere, 43, 1141–1151, 2001.
Xu, J., Bergin, M. H., Yu, X., Liu, G., Zhao, J., Marrico, C. M., and Baumann, K.: Measurement of aerosol chemical, physical, and radiative properties in the Yangtze delta region of China, Atmos. Environ., 36, 161–173, 2002.
Yang, F., He, K., Ma, Y., Zhang, Q., and Yu, X.: Variation Char-acteristics of PM2.5mass concentration and its relationship with
PM10 and TSP in Beijing, (in Chinese with English abstract), China Environ. Sci., 22, 506–510, 2002.
Yang, F., He, K., Ma, Y., Lei, Y., Yu, X., Tanaka, S., Okuda, T., Kato, J., Iwase, T., Mori, J., Ueda, H., and Tenmoku, H.: Char-acterization of chemical composition of aerosol, dry and wet at-mospheric deposition in Beijing, China, in: Abstracts of The 8th International Conference on Atmospheric Science and Applica-tion to Air Quality, edited by: Takeuchi K., 204, Tsukuba Science City, Japan, 2003.
Yang, F., He, K., Lei, Y., Ma, Y., Yu, X., Tanaka, S., Okuda, K., and Iwase, T.: Chemical characters of atmospheric precipitation in Beijing in years of 2001–2003, (in Chinese with English ab-stract), China Environ. Sci., 24, 538–541, 2004.
Yang, F., Ye, B., He, K., Ma, Y., Cadle, S. H., Chan, T., and Mulawa, P. A.: Characterization of Atmospheric Mineral Components of PM2.5in Beijing and Shanghai, China, Sci. Total Environ., 343,
221–230, 2005.
Ye, B., Ji, X., Yang, H., Yao, X., Chan, C. K., Cadle, S. H., Chan, T., and Mulawa, P. A.: Concentration and chemical composition of PM2.5 in Shanghai for a 1-year period, Atmos. Environ., 37,
499–510, 2003.
Zhang, J., Smith, K. R., Ma, Y., Ye, S., Jiang, F., Qi, W., Liu P., Khalil, M. A. K., Rasmussen, R. A., and Thorneloe, S. A.: Greenhouse gases and other airborne pollutants from household stoves in China: a database for emission factors, Atmos. Envi-ron., 34, 4537–4549, 2000.
Zhang, T. and Dong, X.: Carbonate carbon measurement in sand storm and dust storm source identification, (in Chinese with En-glish abstract), China Environmental Monitoring, 18(2), 11–15, 2002.