HAL Id: hal-03027100
https://hal.archives-ouvertes.fr/hal-03027100
Submitted on 27 Nov 2020HAL is a multi-disciplinary open access archive for the deposit and dissemination of sci-entific research documents, whether they are pub-lished or not. The documents may come from teaching and research institutions in France or abroad, or from public or private research centers.
L’archive ouverte pluridisciplinaire HAL, est destinée au dépôt et à la diffusion de documents scientifiques de niveau recherche, publiés ou non, émanant des établissements d’enseignement et de recherche français ou étrangers, des laboratoires publics ou privés.
Cell stretching is amplified by active actin remodelling
to deform and recruit proteins in mechanosensitive
structures
Sophie Massou, Filipe Nunes Vicente, Franziska Wetzel, Amine Mehidi, Dan
Strehle, Cecile Leduc, Raphaël Voituriez, Olivier Rossier, Pierre Nassoy,
Grégory Giannone
To cite this version:
Sophie Massou, Filipe Nunes Vicente, Franziska Wetzel, Amine Mehidi, Dan Strehle, et al.. Cell stretching is amplified by active actin remodelling to deform and recruit proteins in mechanosen-sitive structures. Nature Cell Biology, Nature Publishing Group, 2020, 22 (8), pp.1011-1023. �10.1038/s41556-020-0548-2�. �hal-03027100�
1
Cell stretching is amplified by active actin remodeling to deform and
recruit proteins in mechano-sensitive structures
Sophie Massou1,2,*,Filipe Nunes Vicente1,2,*, Franziska Wetzel3,4*, Amine Mehidi1,2,Dan Strehle3,4,
Cecile Leduc5, Raphaël Voituriez,6,7,8,9, Olivier Rossier1,2, Pierre, Nassoy3,4 and Gregory Giannone1,2,†
1 Univ. Bordeaux, Interdisciplinary Institute for Neuroscience, UMR 5297, F-33000 Bordeaux, France. 2 CNRS, Interdisciplinary Institute for Neuroscience, UMR 5297, F-33000 Bordeaux, France.
3. Univ. Bordeaux, Laboratoire Photonique Numérique et Nanosciences, UMR 5298, F-33400 Talence,
France
4 Institut d’Optique & CNRS, Laboratoire Photonique Numérique et Nanosciences, UMR 5298, F-33400
Talence, France
5 Institut Pasteur Paris CNRS UMR3691, Cell Polarity, Migration and Cancer Unit, 25 rue du Dr Roux
75724, Paris Cedex 15, France.
6 Univ. Pierre et Marie Curie, Laboratoire de Physique Théorique de la Matière Condensée, UMR 7600,
F-75005 Paris, France
7 CNRS, Laboratoire de Physique Théorique de la Matière Condensée, UMR 7600, F-75005 Paris,
France
8 Univ. Pierre et Marie Curie, Laboratoire Jean Perrin, UMR 8237 F-75005 Paris, France 9 CNRS, Laboratoire Jean Perrin, UMR 8237 F-75005 Paris, France
* These authors contributed equally to this work
† Correspondence to: [email protected]
2 Abstract
Detection and conversion of mechanical forces into biochemical signals control cell functions during physiological and pathological processes. Mechano-sensing is based on protein deformations and reorganizations, yet the molecular mechanisms in cells are still unclear. Using a cell stretching device compatible with super-resolution microscopy (SRM) and single protein tracking (SPT), we explored the nanoscale deformations and reorganizations of individual proteins inside mechano-sensitive structures. We achieved SRM after live stretching on intermediate filaments, microtubules and integrin adhesions. Simultaneous SPT and stretching showed that while integrins follow the elastic deformation of the substrate, actin filaments and talin also displayed lagged and transient inelastic responses associated with active acto-myosin remodeling and talin deformations. Capturing acute reorganizations of single-molecule during stretching showed that force-dependent vinculin recruitment is delayed and depends on the maturation state of integrin adhesions. Thus, cells respond to external forces by amplifying transiently and locally cytoskeleton displacements enabling protein deformation and recruitment in mechano-sensitive structures.
3 INTRODUCTION:
Growing evidence demonstrates that macromolecular assemblies driving critical cellular functions are regulated by mechanical forces. Mechanical tensions in cells are
generated by their extracellular environment1, the plasma membrane2 and the cytoskeleton,
including microtubules3, intermediate filaments4 and actin filaments5,6. Among
mechano-sensitive structures including cadherin cell/cell adhesions5, kinetochores3, caveolae2 or the
nucleus7, integrin-based adhesions provide an intensively studied model6,8.
A variety of innovative techniques have been designed to measure and generate forces
on proteins in vitro or within cells6,9–11, especially for adhesive and cytoskeletal proteins. For
instance, forces applied by magnetic tweezers to purified talin, which connects integrins to the
actin cytoskeleton, trigger unfolding that reveals hidden binding sites for vinculin12,13.
Techniques such as atomic force microscopy or optical tweezers demonstrated that forces
exerted directly on proteins stabilize or destabilize interactions14,15. But whether those
principles can be applied to proteins in the cellular context is still unclear. These techniques are
also used to study biomechanical processes directly in living cells with molecular resolution6,16.
However, they can only probe proteins on the dorsal surface of cells, and not in crowded macromolecular structures inside cells or confined at the cell interface with the extracellular environment.
Super-resolution microscopy (SRM) techniques and single protein tracking (SPT) revolutionized cell imaging. By delivering optical images with spatial resolutions below the diffraction limit of light, these techniques created possibilities to study the architecture and
dynamics of biological structures at the protein level in cells17–20. There are two major classes
of SRM: stochastic approaches based on Single Molecule Localization Microscopy (SMLM:
PALM, STORM, PAINT) that use time and space decorrelation of single molecules emission17–
19; or targeted light-structuring techniques that control the emission states at precisely defined
positions in the sample (STED, RESOLFT)17–19. Scrutinizing sub-cellular structures using SRM
unraveled new protein organizations and showed that proteins are spatially segregated into distinct functional nano-domains. SPT techniques unveiled the correlation between protein dynamics and protein activation and/or binding states. The recent application of SRM and SPT lead to a drastic rethinking of macromolecular assemblies including cadherin-based
adhesions21, axons22, dendritic spines23,24, actin-based lamellipodium25 and integrin-based focal
4
Within FAs, SPT enabled to study the fast diffusive behaviors of proteins or their slow
motions driven by intracellular force transmission1,27. SRM and SPT confirmed, together with
fluorescent tension-sensors, that proteins are stretched under mechanical tension10,26,28,29. For
example, talin within mature FAs adopts an extended and polarized conformation (50-350 nm)
with the integrin-binding site directed outward and the actin-binding sites oriented inwards26,
possibly by the actin flow. Cellular force fluctuations within mature FAs were proposed to
mediate substrate rigidity-sensing30, which in turn could be correlated with talin
stretch-relaxation cycles31, and vinculin recruitment12,13,32. However, the molecular rules underlying
mechano-sensing in integrin-based adhesions or other mechano-sensitive structures are hidden by complex spatiotemporal force patterns generated by the cell. One way to decipher those rules is to actively apply external stretch to cells while monitoring with SRM and SPT the nanoscale reorganizations and deformations of protein assembly or individual proteins inside mechano-sensitive structures.
5 RESULTS
Combining cell stretching with super resolution microscopy or single molecule tracking
Stretchable substrates of Polydimethylsiloxane (PDMS) have been coupled with optical
imaging to investigate cell responses to external forces2,9,33. However, the simultaneous
combination of SRM/SPT and cell stretching has never been achieved due to technical limitations (see Extended Discussion). Here, we designed a micromechanical device composed of an ultra-thin PDMS layer (10 µm) providing glass-like optical properties compatible with SRM/SPT (Fig. 1, 2). To simultaneously perform substrate stretching and ensure flatness upon deformation, the PDMS sheet was gliding on a glycerol-lubricated glass cover-slip (Figure 1a,b). To generate uniaxial stretch, we designed a 3D-printed micromechanical device composed of a fixed holding arm and a mobile arm connected to a piezoelectric translator (Fig. 1a and Supplementary Video 1). Controlled and homogeneous strain was achieved over the entire observation chamber for deformations up to 90%, as demonstrated both numerically and experimentally (Extended Data Fig. 1 and Supplementary Video 2).
Then we demonstrated that our stretching device is compatible with the two major classes of SRM: coordinate stochastic (SMLM) and coordinate targeted (e.g. STED/RESOLFT). We used cytoskeleton structures that control cell shape and reorganize during external cell stretching, while serving as gold standards for SRM in cell biology. We acquired low resolution epifluorescence images, before live large stretching (30-50 %) followed by rapid cell fixation (Fig. 1c). Cells were labelled for SRM and imaged after stretching, first at low resolution and then with SRM. Our strategy allowed to acquire long lasting acquisitions
required to obtain DNA-PAINT34 super-resolution images of vimentin intermediate filaments
after live stretching of Mouse embryonic fibroblasts (MEFs) spread on fibronectin coated
PDMS (Fig. 1d,e, Extended Data Fig. 2). We could also perform STED18 SRM of microtubules
after live stretching, fixation and labelling (Fig. 1f,g, Extended Data Fig. 2). In addition, we demonstrated that our stretching device could be used to acquire STED images of live cells that
experience stretching, using live labelling with SiR-tubulin and SiR-actin35 (Extended Data Fig.
2). These results prove that our stretching device is compatible with the two main modalities of SRM, enabling to obtain state of the art super-resolved images of protein reorganization after stretching.
6
Then, we tested whether our stretching device allowed to localize photo-activatable fluorescent proteins (e.g. mEos2, PA-GFP), which possess lower photon budgets reducing
localization precision36, compared to synthetic dyes used for PAINT and STORM (e.g.
ATTO-dyes, Cy-ATTO-dyes, Alexa-dyes). This design enabled to localize individual purified mEos2 and to perform live Photo-activated localization microscopy (PALM) as well as single protein tracking
PALM (sptPALM) acquisitions in cells with resolutions comparable to glass27,37 (Extended
Data Fig. 3). We generated live PALM (Fig. 2a,b) and SPT (Fig. 2a,c) before and after
stretching of MEFs expressing β3-integrin-mEos2 and paxillin-GFP. Large stretching ( 30 %)
induced FAs expansion, as reported by paxillin-GFP images (Fig. 2d). Importantly, the area of β3-integrin-mEos2 immobilizations grew accordingly to FAs expansion (Fig. 2b). Mechanical
activation of integrins should lead to increased immobilization inside and outside FAs1,15,27,38.
However, the fraction of immobile β3-integrin was similar before and after stretching (Fig. 2c,e,f), suggesting that force-induced integrin activation dissipates rapidly after stretching. In conclusion, the stretchable elastic substrate we designed is compatible with SRM and SPT and enables to investigate at the nanoscale the overall changes induced by mechanical forces.
The acute mechanical response of β3-integrins to external forces is elastic.
Assessing the acute mechanical response of proteins to force required maintaining the cell strictly in focus and in the field of observation during stretching. To compensate for the XYZ displacements, we used an autofocus system (Z) and manual or automated stage repositioning (XY). To test the strain homogeneity at nanometer scales, we tracked fluorescent beads adsorbed on the PDMS during trapeze-like patterns, composed of stretch-plateau-relax phases (Fig. 3a). All images were registered on an arbitrarily chosen origin bead, seen as
immobile in super-resolved time-lapses27. Bead displacements, measured from kymographs,
increased proportionally with the distance to the origin bead (Fig. 3b), attesting for the purely elastic and homogeneous response of our device. Accordingly, these displacements could be superimposed after normalization on the position of any given reference bead (Fig. 3c). Likewise, we could extrapolate PDMS displacements at any given positions in the observation field (Figure 3c). Live XYZ repositioning was possible up to 6 % stretching. These performances allowed us to perform an in-depth investigation of the mechanical response of individual proteins during adhesion mechano-sensing, which has been reported to occur
between 2 % and 10 % stretching33,39.
Using SPT, we previously measured integrins, actin and talin displacements driven by
7
stationary within FAs, while most actin filaments are moving rearward (2-10 nm.s-1). Here we
applied trapeze-like patterns to MEFs co-transfected with β3-integrin-mEos2 and paxillin-GFP (Fig. 3d-f, Supplementary Video 3). We then generated super-resolved time-lapses at 2 Hz to analyze the acute mechanical response of individual β3-integrins in and out FAs. The displacement pattern of integrins mirrored the shape of the trapeze-like substrate deformation (Fig. 3d, Supplementary Video 4,5). In addition, after normalization on a reference bead (Fig. 3e) the mean response was superimposed on the displacement of the stretchable substrate. Reciprocally, because the PDMS substrate is purely elastic and the deformation is homogeneous (Fig. 3c and Extended Data Fig. 1), we could extrapolate the theoretical displacements of the substrate at the position of each integrin. In this reference frame the mean local displacement of β3-integrin-mEos2 was similar to the PDMS (Fig. 3f). Thus, integrin displacements closely followed the elastic displacements of the substrate (Fig. 3g). This indicates that most stationary integrins in and out FAs remained connected to fibronectin when challenged mechanically by stretching (2-5 %). Furthermore, this allowed us to test whether
proteins mediating a dynamic mechanical coupling of integrins to F-actin40 follow or deviate
from the elastic behavior of integrins.
The inelastic mechanical response of talin to external forces correspond to talin unfolding.
Among proteins that compose this mechanical coupling talin is critical since it activates
integrins, directly connects them to F-actin and supports integrin force-sensing12,13,41–43. Using
SPT we previously showed that a large fraction of F-actin (74 %) is moving rearward compared
to talin (25 %) and β3-integrins (8 %)27. These findings suggest that stationary talins are bound
to stationary β-integrins in FAs, probably via their amino terminal FERM domain43. But
whether these talins are also simultaneously connected to F-actin via carboxy terminal actin-binding sites, fully extended or prompt to be extended by external forces is unknown. To test the mechanical status of individual talins, we applied trapeze-like patterns to MEFs transfected with talin tagged with tdEOS at the carboxy (talin-C) or amino (talin-N) terminus (Fig. 4). A fraction of individual talin-C (35 %) mirrored the deformation of the substrate (Fig. 4a,b,d). The average talin-C response was superimposed on substrate displacement after bead normalization (Fig. 4b) and the mean local displacement was close to PDMS displacement (Fig. 4e). Thus, like integrins, a subset of Talin-C displayed an elastic behavior. Importantly, a larger fraction of Talin-C (65 %) exhibited a complex displacement incompatible with an elastic response (Fig. 4a,c,d, Supplementary Video 6,7). Immediately after interruption of the stretching, during the plateau phase, Talin-C movements persisted towards the cell center, as
8
shown by the measured arched-shaped kymographs. After reaching their maximal amplitude and before the relaxation, talin-C recoiled back towards the cell periphery (Fig. 4a,c). These inelastic, lagged and transient displacements were not due to atypical strains of the stretchable substrate, since elastic and inelastic responses could occur within very short distances (Fig. 4a, Supplementary Video 6). Bead normalization showed that the inelastic displacements overshot the expected elastic displacements (Fig. 4c). These deviations from the elastic regime caused additional local displacements (330 ± 30 nm), which we measured by subtracting the theoretical displacement of the elastic substrate at positions of detected Talin-C (Fig. 4e). Talin stretching should translate into distinct responses of Talin-C versus Talin-N, because they respectively bind F-actin and integrins (Fig. 4f). Like talin-C, talin-N displayed elastic and inelastic responses to trapeze-like patterns (Extended Data Fig. 4). However, in contrast to talin-C, the fraction of elastic responses (72 %) was higher compared to inelastic responses (28 %) (Fig. 4d), reflecting binding to integrins.
Like talin-C, the C-terminal domain of talin (mEos2-talin-THATCH) which binds and
flows with actin in the same upper layer in FAs26,27, displayed a larger fraction of inelastic
response (Fig. 4d). This suggests that inelastic responses of talin depend on displacements of the actin cytoskeleton. To test this hypothesis, we applied the same trapeze-like patterns to MEFs transfected with actin-mEos2 (Fig. 5). Actin-mEos2 mechanical responses were also partitioned between elastic and inelastic displacements (Fig. 5a-d, Supplementary Video 8). Like Talin-C, inelastic displacements (62 %) were predominant over elastic ones (Fig. 5d). The average elastic response of actin-mEos2 was superimposed on substrate displacement after bead normalization (Fig. 5b,e). In addition, amplitudes of the local extra displacements measured for the inelastic responses were in the same range as talin displacements (260 ± 20 nm) (Fig. 5c,e).
The characteristic rise time of inelastic responses for actin-mEos2 (1.6 ± 0.1 s) and talin-C (1.7
± 0.1 s) was similar, and corresponded to maximal instantaneous displacement rates ( 100
nm.s-1) faster than the flow of talin or actin in adhesive structures or the lamella ( 5-10 nm.s
-1)27,40, suggesting that the actin flow is not driving inelastic responses.In order to compare the
rise time from the recoil time, we applied single stretch-plateau patterns to examine the recoil
phase independently from the relaxation (Extended Data Fig. 5, and Extended Discussion). The
characteristic recoil time of actin-mEos2 was longer (4.6 ± 0.6 s) than the rise time, suggesting that they were triggered by distinct mechanisms. Overall, talin-N displayed mechanical responses similar to integrins, while talin-C behaves like the actin cytoskeleton. These results indicate that a significant fraction of inelastic displacements for talin-C correspond to talin
9
stretching. Importantly, amplitudes of local extra displacements ( 200-300 nm) are in
agreement with talin extension lengths measured in vitro13. Thus, our results suggest that
molecular displacements induced by small (2-5 %) cell stretching are transiently ( 5 s) and
locally amplified by the inelastic response of F-actin, hence triggering talin unfolding.
Transient and active remodeling of the acto-myosin network drives the inelastic response of actin.
Deviations from purely elastic responses, and in particular arched-shaped displacements during the plateau phase (Fig. 5g), could either reflect the passive viscoelastic properties of the cell, which can induce lagged responses in both rising and recoil phases, or an active cell
response44–47. On general grounds a cell can be modeled as a mechanical transducer composed
of several elements, which is locally pinned to the elastic PDMS via integrins. If the cell is homogenously elastic (Fig. 5g), 3 % stretch would result in minute local extra displacements
(x) of talin, inconsistent with domain unfolding12,13 (e.g. talin initial length 50 nm; x = 1.5
nm). Assuming that the cell is heterogeneously elastic (Fig. 5g) and composed of softer elements (e.g. talin) in series with stiffer elements (e.g. integrin and actin), it is found that under an imposed strain, the softer elements will undergo larger displacements than their corresponding reference point in the underlying homogeneous substrate. Deformation of talin
from 50 nm to the measured 300 nm corresponds to an effective strain of 600 %, which
implies a cell composed of 99.5 % rigid versus soft elements (see Extended Discussion). Thus,
extra displacements of 200-300 nm (Fig. 4e, 5e) could be attributed to a passive mechanism
only if the cell is essentially unable to deform. However, micro-rheology studies demonstrate
that cells could be rapidly deformed44,48,49. This suggests that large effective strains cannot be
attributed solely to passive effects, but involve an active contraction of actin structures in response to imposed strains (Fig. 5g).
To test whether an active process generated by the cell drives the inelastic displacements of actin, we performed the same experiments in fixed and permeabilized cells (Fig. 5 and Extended Data Fig. 6). This treatment transforms the actin cytoskeleton into a non-dynamic cross-linked network, preventing reorganization of actin cross-linkers, active actin polymerization or active contraction by myosin motors. Fixation/permeabilization decreased the fraction and mean amplitude of actin-mEos2 inelastic responses (Fig. 5d,e and Extended Data Fig. 6), supporting that they are driven by a dynamic or active response of the cell.
10
amplitude of actin-mEos2 inelastic responses (Fig. 5d,e and Extended Data Fig. 6), suggesting that forces generated by myosin II on actin filaments actively drives these displacements (Fig. 5g).
Molecular vinculin recruitment is delayed and depends on the maturation state of integrin-based adhesions
Until here, we applied cell stretching combined with SRM/SPT to study force-dependent protein unfolding or deformations. Next we tested whether our approach could be used to study protein reorganizations within mechano-sensitive structures during external stress (Fig. 6; Fig.7). We used as a paradigm the force-dependent recruitment of protein inside integrin-based adhesions. Within FAs, the association of proteins containing the
zinc-finger-type LIM domain is particularly sensitive to mechanical tension51,52. The recruitment of LIM
proteins zyxin and paxillin to FAs is induced by cell stretching33,53,54. We applied 4 %
trapeze-like patterns to MEFs co-transfected with zyxin-mEos3.2 and paxillin-GFP (Fig. 6a,b, Supplementary Video 9). To measure the acute zyxin-mEos3.2 molecular recruitment in mature
FAs, we quantified the density of trajectories (trc/µm2) before, during, and after the stretching
plateau (Fig. 6c). Cell stretching triggered an increase in zyxin-mEos3.2 trajectories in mature FAs for 50 % (4/8) of the cells, while the remaining cells displayed no detectable variations. This recruitment was reversible since cell relaxation resulted in a decrease of trajectories to levels found before stretching (Fig. 6c). Zyxin molecular recruitment analyzed from kymographs or color-coding of super-resolved time-lapses (2 Hz) did not show obvious zyxin association in selective FAs regions (tip, center, rear) (Fig. 6d,e). Force-induced talin unfolding exposes vinculin binding sites, as demonstrated at the single molecule and ensemble level in in
vitro system using purified proteins12,13,32. Furthermore, vinculin turnover within integrin-based
adhesions is tuned by mechanical forces55,56. Hence, we tested whether acute vinculin
recruitment in mature FAs is triggered by external forces. We applied ~ 4% trapeze-like patterns to MEFs co-transfected with vinculin-mEos3.2 and paxillin-GFP (Fig. 6f,g). In contrast to zyxin, the density of vinculin trajectories during the stretching plateau did not increase significantly in mature FAs (0/7 cells) (Fig. 6h). The same result was found after larger stretches (~ 10 %) (0/5 cells) (Extended Data Fig. 7). One possible interpretation for this surprising result is that force-dependent recruitment occurs simultaneously with force-dependent dissociation,
as demonstrated in vitro13,57. Alternatively, force-induced vinculin recruitment could depend on
11
Consistent with the latter hypothesis, initiation and maturation of nascent adhesions (NAs)
depend on forces generated on early integrin-talin-actin connections42,58 triggering vinculin
recruitment42,59 and connection to F-actin flows10,60. Thus, we performed experiments on NAs
which form in protrusive structures of spreading and migrating cells61,62. We applied ~ 4%
trapeze-like patterns to spreading MEFs co-transfected with vinculin-mEos2 and paxillin-GFP (Fig. 7a,b, Supplementary Video 11). By contrast with mature FAs, the density of vinculin-mEos2 trajectories in NAs increased in ~ 70 % (7/10) of the analyzed cells (Fig. 7c). Cell relaxation induced a reduction of trajectories but still above the levels measured before stretching (Fig. 7c). The density of talin-C trajectories in NAs did not exhibit large increase upon stretching (responding cells: 28 %; 2/7) (Fig. 7j), suggesting that vinculin recruitment occurs mainly on talin residing in NAs, and not by the recruitment of additional talin. Furthermore, the fraction of talin-C displaying inelastic responses in NAs was similar to the one observed for mature FAs (Extended Data Fig. 8). Importantly, molecular vinculin-mEos2 recruitment did not reach its maximum immediately after stretching, but progressively or transiently increased during the plateau phase (Fig. 7f). This delayed vinculin recruitment in response to stretch is consistent with the lagged talin-C inelastic response occurring during the plateau (Fig. 4, Extended Data Fig. 8) and associated with talin unfolding (Fig. 4). Kymographs analysis and color-coding of super-resolved time-lapses revealed no region-selective recruitment of vinculin-mEos2 in NAs (Fig. 7d,e; Extended Data Fig. 9).
12 Discussion
A molecular understanding of mechano-sensing has emerged from in vitro mechanical
manipulations of proteins12–14. These studies performed by applying force on purified proteins
showed that mechano-sensing relies on protein unfolding and reorganization. The general consensus is that external stresses applied to cells are directly and instantaneously transmitted to proteins to trigger their deformation and reorganization in mechano-sensitive structures. However, no experimental strategies were able to apply external forces to cells while simultaneously capturing the mechanical response of individual proteins. Here, by combining cell stretching with SRM and SPT, we could reveal at the nanoscale the mechanical response of mechano-sensitive structures. This provides the opportunity to study how polarized
macromolecular complexes, composed of distinct functional nano-domains22,24,26, reorganize
upon external stretch.
We found that protein deformations inside integrin-based adhesions are not triggered by direct transmission of the external stretch. Upon small (2-5%) stretching, actin filaments and
talin displayed both elastic and inelastic responses. The inelastic responses lead to transient (
5 s) and local displacements ( 250 nm) associated with talin deformations, as suggested by the
larger fraction of inelastic responses for talin-C compared to talin-N. These distinct responses could also be interpreted as talin cleavage by calpain in integrin-based adhesions, a process
triggering FAs disassembly63 or NAs growth64. Importantly, inelastic responses were decreased
by cell fixation and myosin II inhibition, indicating a mechanism driven by active remodeling of the actin cytoskeleton. Thus, cells actively react to external forces, amplifying transiently and locally actin cytoskeleton displacements to trigger protein deformation in mechano-sensitive structures.
The inelastic responses of the actin cytoskeleton and talin could also involve local ruptures of the actin cystoskeleton, in particular actin stress fibers (SFs). SFs are repaired by
recruitment of actin binding proteins including zyxin, α-actinin, and VASP65,66. Likewise,
stimulation of myosin II contractility, using optogenetic activation of RhoA, leads to local
recruitment of zyxin to SFs67. Thus, zyxin-mediated SFs repair or mechanical homeostasis
might be involved in inelastic responses. However, we showed that 4 % stretching did not
cause major SFs ruptures or recruitment of zyxin and α-actinin to SFs (Extended Data Fig. 10, and Extended Discussion). Therefore, rupture/repair events are rare during ~ 4 % stretching and thus could not account for the inelastic responses of talin and actin. Nevertheless, micron-scale
13
SFs homeostasis triggered by cell contractility67 and the inelastic responses of actin and talin
could have common molecular players although at different spatiotemporal scales.
At the molecular level, mechanical force could reinforce14,15,38,42 or destabilize2,41
interactions and expose hidden binding sites fostering protein recruitment, as demonstrated for
integrin-based12,13,32 and cadherin-based68 adhesions. Combining cell stretching with SRM or
SPT yields molecular resolution on protein reorganization which can be spatially and temporally heterogeneous within mechano-sensitive structures. For instance, molecular vinculin recruitment induced by stretching is delayed and depends on the maturation state of the integrin-talin-cytoskeleton connections. This supports the hypothesis that substrate stretching is not directly driving talin unfolding. Instead, our results would be consistent with a model where external stresses applied to cells trigger subsequent cellular active responses, e.g. active actin reorganization, leading to protein unfolding and recruitment. The ability of talin to recruit vinculin might depend on its force history and initial tensional state, which might differ
in NAs versus FAs69. This is consistent with experiments performed in vitro using purified talin
rod domains and vinculin. Vinculin-unloaded talin recruits vinculin upon an initial stretch, while vinculin-loaded talin will still be stretched by external forces without recruitment of
additional vinculin13,57. Larger stretching of already extended talin might further unfold
vinculin binding domains leading to vinculin dissociation13,57. Thus the undetectable molecular
recruitment of vinculin in mature FAs might be explained by simultaneous recruitment and dissociation upon cell stretching. By contrast, newly recruited talin into NAs might be in lower tensional sates, free from any previous stretching, with all vinculin binding sites available for vinculin recruitment to trigger maturation to FAs. This idea is consistent with the axial
redistribution of vinculin observed in NAs using tridimensional SRM iPALM in fixed cells70.
Micro-rheology studies have demonstrated that mechanical stability of actin networks relies on their elastic properties which are prevalent at short time-scale. Conversely, remodeling occurs through inelastic or non-linear responses leading to stress stiffening or weakening over
timescales of seconds to tens of seconds44–46. However, conventional micro-rheology methods
average over any heterogeneity, inelasticity and time fluctuations occurring at the molecular level. Combining cell stretching and SRM/SPT, our approach paves the way to nano-rheology of the cell. We have captured the excitable nature of the acto-myosin cytoskeleton at the nanoscale, which transiently amplifies displacements induced by extracellular forces, leading to local protein stretching and recruitment. Thus, our findings suggest that mechano-sensing must occur within a few seconds, during the local displacement amplification. Substrate
14
mechano-sensing could be mediated by fluctuations of intracellular and extracellular
forces9,30,39, hence the transient nature of this amplification might reset the capability of the cell
to respond to successive mechanical stimuli. Spatiotemporal force fluctuation in FAs30 probably
emerges from the heterogeneous tensional/connective states of proteins at the nanoscale8. Each
stationary protein detected by conventional SRM/SPT conceals its tensional and connectional states, which we unveiled by challenging proteins through a uniform mechanical perturbation. We expect that our approach will be applied to decipher at the molecular level the growing
number of mechano-sensitive structures or organelles such as caveolae2, kinetochores3,
15 Methods
16 Supplementary Information:
Methods
Extended Data Figures
Extended Data Figure 1. Mechanical properties of the stretchable substrate compatible with SRM and SPT.
Extended Data Figure 2. The stretchable elastic substrate enables to acquire SRM images of cellular structures deeper into the cells and live STED images on cells that experience stretching.
Extended Data Figure 3: The stretchable elastic substrate is compatible with single molecule localization microscopy.
Extended Data Figure 4. Elastic and inelastic mechanical response of talin-N to trapeze-like patterns.
Extended Data Figure 5. Elastic and inelastic mechanical responses of actin and talin-C to single stretch-plateau patterns.
Extended Data Figure 6. Elastic and inelastic mechanical response of actin to trapeze-like patterns after fixation and blebbistatin treatment.
Extended Data Figure 7. Vinculin is not recruited to mature integrin-based adhesions by larger scale (10 %) stretching.
Extended Data Figure 8. Elastic and inelastic mechanical response of talin-C to trapeze-like patterns in nascent integrin-based adhesions.
Extended Data Figure 9. Vinculin does not exhibit region-selective recruitment in nascent adhesions after small-scale (4 %) stretching.
Extended Data Figure 10. Trapeze-like patterns (4 %) are not triggering stress fiber ruptures and repair.
17 Supplementary Tables
Supplementary Table 1Pointing accuracies and densities of mEos2 detection.
Supplementary Table 2. Results obtained using sptPALM acquisitions at 50 Hz. Supplementary Table 3. Fractions elastic/inelastic, inside/outside FAs. Amplitudes elastic/inelastic merged and inside outside FAs
Supplementary Table 4. Rise time and recoil time
Supplementary Table 5. Individual track density variations for protein recruitment
Supplementary Videos
Supplementary Video 1. Assembly of the micromechanical device. Supplementary Video 2. Fluorescent micro-patterns stretching.
Supplementary Video 3. Unprocessed sptPALM-stretching acquisition of β3-integrin-mEos2 during a trapeze-like pattern.
Supplementary Video 4. Super-resolution time-lapse of β3-integrin-mEos2 during a trapeze-like pattern, entire imaged field.
Supplementary Video 5. Super-resolution time-lapse of β3-integrin-mEos2 during a trapeze-like pattern, higher magnification.
Supplementary Video 6. Super-resolution time-lapse of talin-C-tdEos during a trapeze-like pattern, close elastic and inelastic responses.
Supplementary Video 7. Super-resolution time-lapse of talin-C-tdEos during a trapeze-like pattern, remote elastic and inelastic responses.
Supplementary Video 8. Super-resolution time-lapse of actin-mEos2 during a trapeze-like pattern.
Supplementary Video 9. Super-resolution time-lapse of zyxin-mEos3.2 in mature FAs during a trapeze-like pattern.
Supplementary Video 10. Super-resolution time-lapse of Vinculin-mEos2 in mature FAs during a trapeze-like pattern.
Supplementary Video 11. Super-resolution time-lapse of Vinculin-mEos2 in NAs during a stretch-plateau like pattern.
18 Acknowledgments: We thank Z. Karatas, M. Fabre, R. Sterling, J. Carrere for technical
assistance; T. Orré for helpful discussions. C. Poujol, S. Marais (Bordeaux Imaging Center, BIC) for technical help; F. Cordelières. (BIC) for support in kymograph analysis (Kymo Tool Box). We thank J. B. Sibarita (IINS, Bordeaux, France) for his support in sptPALM analysis; V. Studer (IINS, Bordeaux, France) and P.O. Strale (alvéole) for important discussions on microfabrication; M. Cabilic (IINS, Bordeaux, France) for the repositioning plugin developed
in Metamorph; T. Schlichthärle, L. Fischer, R. Jungmann (MPI Biochemistry, Munich,
Germany) and C. Grashoff (Institute for Molecular Cell Biology, Münster, Germany) for providing materials, support and important discussions on DNA-PAINT; P. Kanchanawong (MBI, NUS, Singapore) for providing the talin1-22–tdEOS C), tdEOS-18–Talin1 (Talin-N), mEos2-7–TalinABS (THATCH) constructs. We acknowledge financial support from the French Ministry of Research and CNRS, ANR grant Integractome (GG), ANR grant FastNano (GG), ANR grant IntegrinNanoPlan (GG), ANR Decav-Recav (PN, ANR MecanoCav (PN), Fondation pour la Recherche Médicale (GG), and the Institut National du Cancer (PN). Authors declare no competing interests.
Author Contributions:
G.G. conceived and coordinated the project. G.G, P.N. and O.R. conceptualized the experiments and the stretching device. F.W., S.M., D.S. and F.N.V. developed and characterized the optical and mechanical properties the stretching device. F.N.V. performed and analysed the experiments combining cell stretching and STED on microtubules and the actin cytoskeleton. F.N.V. and C.L performed and analysed the experiments combining cell stretching and DNA-PAINT on vimentin intermediate filaments. F.N.V., S.M., and F.W. performed the experiments combining cell stretching and SRM/SPT on mature FAs. F.N.V. and G.G. analysed the experiments combining cell stretching and SRM/SPT on mature FAs. F.N.V performed and analysed the experiments combining cell stretching and SRM/SPT on early NAs. A.M. developed analysis routines for kymographs. R.V. conceptualized the physical model. G.G and P.N. wrote the manuscript with input from all authors.
Conflict of interest statement:
19 Figures:
Figure 1: Combining cell stretching with super resolution microscopy.
a, Schematic view of the 3D-printed micromechanical stretching device composed of a holding
arm and a stretching arm connected to a piezo motor (up). Schematic top view of the stretching device showing the positions and dimensions of the stretching chamber (bottom). b, Schematic side view of the glass-glycerol-PDMS assembly formed by the supporting glass (170 µm), the glycerol gliding layer (0.7 µm), the suspended thin (10 µm) PDMS framed by the thick (40 µm) elastomer (arbitrary scales). All uniaxial stretches are displayed towards the right (white arrows). c, Schematic representation of the experimental workflow. Low resolution epifluorescence images were acquired live before large stretching (30-50 %) followed by rapid cell fixation. Cells were labelled for SRM and imaged after stretching at low resolution and SRM. d, Low resolution fluorescence image of vimentin-GFP in a vimentin Knock Out MEF (left) on the PDMS stretching device before (green) and after (magenta) a 35% large stretching, followed by rapid cell fixation. Outlines correspond to the cell contour. DNA-PAINT super-resolution image of vimentin after 35% stretching (right), corresponding to the outlined area in the left panel. Scale bar, 10 µm. e. Low resolution fluorescence image (right) and DNA-PAINT super-resolution image (left) of vimentin for the outlined area in the right panel of d displayed at a higher magnification. Scale bar, 1 µm. f, Low resolution fluorescence image of Tubulin-GFP in a MEF (left) on the PDMS stretching device before (green) and after (magenta) 35% large stretching followed by rapid cell fixation. Scale bars: 10 µm and 3 µm, respectively. Outlines define the nucleus. STED super-resolution image of tubulin labelled with ATTO-647N after 35% stretching (right). The region is out of the field of view displayed in the left panel. Corresponding confocal image of tubulin labelled with ATTO-647N (inset). g, Low resolution confocal image (right) and STED super-resolution image (left) of tubulin for the outlined area in the right panel of f displayed at a higher magnification. Scale bar, 1 µm. d-g, Data are representative of 3 independent experiments.
20 Figure 2: Combining cell stretching with live super resolution microscopy or single molecule tracking.
a, Schematic representation of the experimental workflow. Cells were co-transfected with
proteins of FAs fused with photoactivatable/photoconvertible fluorescent proteins (e.g. mEos2, mEos3.2) and a reporter of FAs (e.g. paxillin-GFP). Low resolution epifluorescence images were acquired live before and after large stretching (30-50 %). Sequences of live SRM or SPT could be acquired before and after stretching. b, Super-resolution intensity images of β3-integrin-mEos2 in MEFs before (left) and after (right) a 34% stretch (image acquisition rate 50 Hz, duration > 240 s). Outlines correspond to FAs, labelled by GFP-paxillin (greyscale), before (green) and after (magenta) stretching. Scale bar, 5 µm. Fluorescent beads adsorbed on the stretching chamber were used to measure PDMS deformation. c, Corresponding color-coded trajectories before (left) and after (right) the 34% stretch, overlaid on FAs labelled by GFP-paxillin (greyscale), showing the diffusion modes: free diffusion (magenta), confined diffusion (green) and immobilization (red) (right). Scale bars, 5 µm. d, Corresponding low resolution
image of GFP-paxillin before (green) and after (magenta) the 34 % stretch. Scale bar, 5 µm. e,
Distributions of the diffusion coefficient D computed from mEos2‐β3-integrin trajectories
inside (left) and outside (right) FAs, before (green) and after (magenta) 30 % stretches. D
values inferior to 0.017 µm2.s-1 corresponds to immobilized proteins. Values represent the
average of the distributions obtained from 5 different cells (see Supplementary Table 2). f, Fraction of proteins undergoing free diffusion, confined diffusion or immobilization inside (left)
and outside (right) FAs before (green) and after (magenta) 30 % stretching. Values represent
the average of the fractions obtained from 5 different cells (see Supplementary table 2; mean ± s.e.m. for cells). b-d, Data are representative of 5 independent experiments. e-f, All results for each condition correspond to pooled data from 5 independent experiments (cells/trajectories): before stretch (5/4643), after stretch (5/3071). Statistical significances were obtained using two-tailed paired Student’s t-tests.
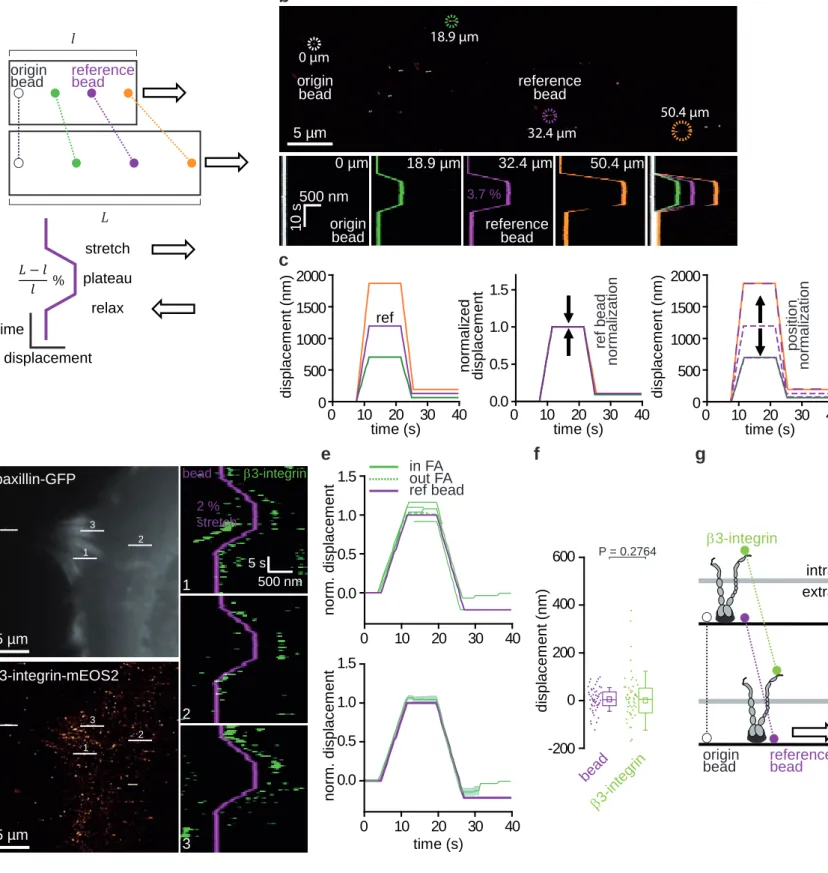
21 Figure 3: The acute mechanical response of β3-integrins to external forces is elastic. a, Schematic representation of PDMS mechanical response to trapeze-like patterns (right
direction). The origin bead (white) is used for registration and the reference bead (magenta) is used for displacement and position normalizations. b, Mechanical response of a 10 µm PDMS assembly during a trapeze-like pattern measured using adsorbed fluorescent beads. Projection of all the images of a super-resolved time-lapse (stretching 3.7 %, 2 Hz, 40 s) (top). Positions on the PDMS of the origin bead (white), the reference bead (magenta), and two other beads (green, orange). Scale bar, 5 µm. Bead displacements were measured using kymographs (bottom) generated from the super-resolved time-lapse. Horizontal axis, space (500 nm); vertical axis, time (10 s). c, Displacement versus time plot for the beads corresponding to b (left). Displacement versus time plot for the orange and green beads after normalization to the initial position of magenta reference bead (middle). Displacement versus time plot for magenta bead after normalization to the initial positions of orange or green beads (right). Same procedure was applied to individual mEos2 labelled proteins (see e and f). d, Fluorescence image of paxillin-GFP in a MEF on the PDMS stretching device before stretching (up left). Projection of all β3-integrin-mEos2 super-resolution intensity images of a trapeze-like pattern time-lapse (stretching 2 %, 2 Hz, 40 s) (bottom left). Scale bar, 5 µm. Right, β3-integrin-mEos2 kymographs generated from the trapeze-like pattern time-lapse (as shown in the left panels, dashed lines). Horizontal axis, space (500 nm); vertical axis, time (5 s). The magenta kymograph corresponds to the reference bead, and the green kymographs correspond to β3-integrin-mEos2. In between signal intermittencies result from on–off blinking characteristic of single mEos2 molecules. e, Displacement versus time plot for β3-integrin-mEos2 (green lines) after normalization to the initial position of the reference bead (magenta line) (up). Mean displacement ± SEM (bottom). f, Box plots displaying the median (line) and mean (square) ± percentile (25%–75%) of local displacements for β3-integrin-mEos2 after subtraction of the extrapolated PDMS displacements, using the magenta bead after normalization to the initial positions of each β3-integrin-mEos2. The same procedure was applied for beads adsorbed on PDMS, as displayed in c. e,f, Data pooled from 3 independent experiments (see Supplementary Table 3): β3-integrin-mEos2 (n = 3 independent experiments, 51 kymographs); beads (n = 3 independent experiments, 52 kymographs). g, Schematic representation of the acute mechanical response of β3-integrin. Statistical significances were obtained using two-tailed unpaired Student’s t-tests.
22 Figure 4: The inelastic mechanical response of talin to external forces correspond to talin unfolding.
a, Fluorescence image of paxillin-GFP in a MEF on the PDMS stretching device before
stretching (right direction) (up left). Projection of all talin-C-tdEos super-resolution intensity images of a trapeze-like pattern time-lapse (stretching 3.7 %, 2 Hz, 40 s) (bottom left). Scale bar, 5 µm. Right, talin-C-tdEos kymographs generated from the trapeze-like pattern time-lapse (as shown in the left panels, dashed lines). Horizontal axis, space (500 nm); vertical axis, time (5 s). The magenta kymograph corresponds to the reference bead, and the green kymographs correspond to tdEos. b, Displacement versus time plot for elastic responses of talin-C-tdEos (green lines) after normalization to the initial position of the magenta reference bead (magenta line) (up). Corresponding mean displacement ± SEM (bottom). c, Same as b for inelastic responses of talin-C-tdEos. d, Fractions of elastic and inelastic responses inside and outside FAs for β3-integrin-mEos2, tdEos-talin-N, talin-C-tdEos, mEos2-talin-THATCH. Values represent the average of fractions obtained from at least three independent experiments (see Supplementary table 3; mean ± s.e.m. for cells). e, Box plots displaying the median (line) and mean (square) ± percentile (25%–75%) of local displacements for β3-integrin-mEos2, tdEos-talin-N, talin-C-tdEos, mEos2-talin-THATCH for elastic (E) and inelastic (IE) responses after subtraction of the extrapolated PDMS displacements. f, Schematic representation of the acute mechanical response of talin-N and talin-C compared to β3-integrin. b-e, Data pooled from several independent experiments (see Supplementary Table 3): beads (n = 3 independent experiments, 52 kymographs), β3-integrin-mEos2 (n = 3 independent experiments, 51 kymographs); tdEos-talin-N (n = 4 independent experiments, 98 kymographs); talin-C-tdEos (n = 3 independent experiments, 117 kymographs); mEos2-talin-THATCH (n = 3 independent experiments, 66 kymographs). Statistical significances were obtained using two-tailed unpaired Student’s t-tests.
23 Figure 5: Transient and active remodeling of the acto-myosin network drives the inelastic response of actin.
a, Fluorescence image of paxillin-GFP in a MEF on the PDMS stretching device before
stretching (right direction) (up left). Projection of all actin-mEos2 super-resolution intensity images of a trapeze-like pattern time-lapse (stretching 2.9 %, 2 Hz, 40 s) (bottom left). Scale bar, 5 µm. Right, actin-mEos2 kymographs generated from the trapeze-like pattern time-lapse (as shown in the left panels, dashed lines). Horizontal axis, space (500 nm); vertical axis, time (5 s). The magenta kymograph corresponds to the reference bead, and the green kymographs correspond to mEos2. b, Displacement versus time plot for elastic responses of actin-mEos2 (green lines) after normalization to the initial position of the magenta reference bead (magenta line) (up). Corresponding mean displacement ± SEM (bottom). c, Same as b for inelastic responses of actin-mEos2. d, Fractions of elastic and inelastic responses inside and outside FAs for actin-mEos2 in control, fixed/permeabilized cells and cells treated with blebbistatin. Values represent the average of fractions obtained from at least three independent experiments (see Supplementary table 3; mean ± s.e.m. for cells). e, Box plots displaying the median (line) and mean (square) ± percentile (25%–75%) of local displacements for actin-mEos2 in control, fixed/permeabilized cells and cells treated with blebbistatin for elastic (E) and inelastic (IE) responses after subtraction of the extrapolated PDMS displacements. b-e, Data pooled from several independent experiments (see Supplementary table 3): beads (n = 3 independent experiments, 52 kymographs); actin-mEos2 (n = 3 independent experiments, 65 kymographs); actin-mEos2 fixed/permeabilized (n = 3 independent experiments, 85 kymographs); actin-mEos2 blebbistatin (n = 2 independent experiments, 4 stretches, 83 kymographs) . f, Schematic representation of the acute mechanical response of actin. g, Model of displacements amplification by transient active remodelling of the actin cytoskeleton. Statistical significances were obtained using two-tailed unpaired Student’s t-tests.
24 Figure 6. Small-scale stretching triggers zyxin reorganization but has no effect on vinculin recruitment in mature FAs
a, Fluorescence image of paxillin-GFP in a MEF on the PDMS stretching device before
stretching (right direction). b, Projection of zyxin-mEos3.2 super-resolution intensity images for the three phases of a trapeze-like pattern time-lapse (stretching 4.3 %, 2 Hz, 8s per phase): before (left), plateau (middle) and relax (right). The dotted region represents the area used to
generate the kymograph in d. Scale bar = 3 µm. c, Variation of trajectory density (trc/µm2) for
Zyxin-mEos3.2 (n = 8 cells, 4 independent experiments) throughout trapeze-like patterns (mean ± s.d.). The density of trajectories was normalized to the value obtained before stretching. Individual cells (orange), mean trajectory ratio ± s.d. (bold orange), increase > 1.1 (plain), < 1.1 (dotted). Scale bar = 3 µm. d, Zyxin-mEos3.2 kymograph generated from the trapeze-like pattern time-lapse. Horizontal axis, space (2 µm); vertical axis, time (10s). The magenta kymograph corresponds to the reference bead; the green kymographs correspond to zyxin-mEos3.2. e, Color-coded projection of zyxin-mEos 3.2 intensity images during the plateau phase (red 0-3 s, green 4-7s, blue 8-11s, yellow 11-15s). f, Fluorescence image of paxillin-GFP in a MEF on the PDMS stretching device before stretching (right direction). g, Projection of vinculin-mEos2 super-resolution intensity images for the three phases of a trapeze-like pattern time-lapse (stretching 5 %, 2 Hz, 8s per phase): before (left), plateau (middle) and relax (right). The dotted region represents the area used to generate the kymograph in i. Scale bar = 3 µm. h,
Variation of trajectory density (trc/µm2) for vinculin-mEos2 (n = 7 cells, 3 independent
experiments) throughout trapeze-like patterns (mean ± s.d.). The density of trajectories was normalized to the value obtained before stretching. Individual cells (green), mean trajectory ratio ± s.d. (bold green), increase > 1.1 (plain), < 1.1 (dotted). i, vinculin-mEos2 kymographs generated from trapeze-like pattern time-lapse. Horizontal axis, space (2 µm); vertical axis, time (10s). The magenta kymograph corresponds to the reference bead; green kymographs correspond to vinculin-mEos2. j, Schematic representation of zyxin recruitment in mature FAs.
a,b,d,e, Data representative of 4 independent experiments; f,g,j, data representative of 3
independent experiments (see Supplementary Table 5). Statistical significance was calculated using two-tailed Wilcoxon matched-pairs signed rank tests.
25 Figure 7. Small-scale stretching triggers vinculin recruitment in nascent adhesions without the recruitment of additional talin.
a, Fluorescence image of paxillin-GFP in a spreading MEF on the stretching device before
stretching (right direction). b, Projection of vinculin-mEos2 super-resolution intensity images for the three phases of a trapeze-like pattern time-lapse (stretching 4.2 %, 2 Hz, 40s per phase): before (left), plateau (middle) and relax (right). The dotted region represents the area used to
generate the kymograph in d. Scale bar = 3 µm. c, Variation of trajectory density (trc/µm2) for
vinculin-mEos2 (n = 10 cells, 4 independent experiments) throughout trapeze-like patterns (mean ± s.d.). The density of trajectories was normalized to the value obtained before stretching. Individual cells (green), mean trajectory ratio ± s.d. (bold green), increase > 1.1 (plain), < 1.1 (dotted). d, vinculin-mEos2 kymograph generated from trapeze-like pattern time-lapse. Horizontal axis, space (2 µm); vertical axis, time (10s). The magenta kymograph corresponds to the reference bead, and the green kymograph corresponds to vinculin-mEos2. e, Color-coded projection of all vinculin-mEos2 intensity images during the plateau phase (red 0-15 s, green 15-30s, blue 30-45s, yellow 45-60s). f, Temporal molecular recruitment of vinculin-mEos2 during the plateau phase. Each line represents an individual cell (green shades). The number of vinculin-mEos2 detections in NAs was normalized to the value obtained before stretching. g, Schematic representation of vinculin recruitment in early NAs. h, Fluorescence image of paxillin-GFP in a spreading MEF on the stretching device before stretching (right direction). i, Projection of talin-C-tdEos super-resolution intensity images for the three phases of a trapeze-like pattern time-lapse (stretching 3.7 %, 2 Hz, 8 s per phase): before (left), plateau (middle) and relax (right). The dotted region in h and i represents the area used to generate the kymograph
in k. Scale bar = 3 µm. j, Variation of trajectory density (trc/µm2) for talin-C-tdEos (n = 7 cells,
3 independent experiments) throughout trapeze-like patterns (mean ± s.d.). The density of trajectories was normalized to the value obtained before stretching. Individual cells (green),
mean trajectory ratio ± s.d. (bold green), increase > 1.1 (plain), < 1.1 (dotted). k, talin-C-tdEos
kymographs generated from trapeze-like pattern time-lapse. Horizontal axis, space (2 µm); vertical axis, time (10s). The magenta kymograph corresponds to the reference bead, and the green kymograph corresponds to talin-C-tdEos. a,b,d,e Data representative of 4 independent experiments; h,i,k, data representative of 3 independent experiments (see Supplementary Table 5). Statistical significance was calculated using two-tailed Wilcoxon matched-pairs signed rank tests.
26 References:
1. Paszek, M. J. et al. The cancer glycocalyx mechanically primes integrin-mediated
growth and survival. Nature 511, 319–325 (2014).
2. Sinha, B. et al. Cells respond to mechanical stress by rapid disassembly of caveolae.
Cell 144, 402–413 (2011).
3. Dumont, S., Salmon, E. D. & Mitchison, T. J. Deformations within moving
kinetochores reveal different sites of active and passive force generation. Science 337,
355–8 (2012).
4. Zhang, H. et al. A tension-induced mechanotransduction pathway promotes epithelial
morphogenesis. Nature 471, 99–103 (2011).
5. Ladoux, B. & Mège, R. M. Mechanobiology of collective cell behaviours. Nat. Rev.
Mol. Cell Biol. 18, 743–757 (2017).
6. Iskratsch, T., Wolfenson, H. & Sheetz, M. P. Appreciating force and shape — the rise
of mechanotransduction in cell biology. Nat. Rev. Mol. Cell Biol. 15, 825–833 (2014).
7. Cho, S., Irianto, J. & Discher, D. E. Mechanosensing by the nucleus: From pathways to
scaling relationships. J. Cell Biol. 216, 305–315 (2017).
8. Oria, R. et al. Force loading explains spatial sensing of ligands by cells. Nature 552,
219–224 (2017).
9. Goldyn, A. M., Rioja, B. A., Spatz, J. P., Ballestrem, C. & Kemkemer, R.
Force-induced cell polarisation is linked to RhoA-driven microtubule-independent focal-adhesion sliding. J Cell Sci 122, 3644–3651 (2009).
10. Grashoff, C. et al. Measuring mechanical tension across vinculin reveals regulation of focal adhesion dynamics. Nature 466, 263–266 (2010).
11. Polacheck, W. J. & Chen, C. S. Measuring cell-generated forces: A guide to the available tools. Nat. Methods 13, 415–423 (2016).
12. del Rio, A. et al. Stretching Single Talin Rod Molecules Activates Vinculin Binding.
Science (80-. ). 323, 638–641 (2009).
13. Yao, M. et al. The mechanical response of talin. Nat. Commun. 7, 11966 (2016). 14. Huang, D. L., Bax, N. A., Buckley, C. D., Weis, W. I. & Dunn, A. R. Vinculin forms a
directionally asymmetric catch bond with F-actin. Science (80-. ). 357, 703–706 (2017).
15. Kong, F. et al. Demonstration of catch bonds between an integrin and its ligand. J Cell
Biol 185, 1275–1284 (2009).
16. Müller, D. J. & Dufrêne, Y. F. Atomic force microscopy: A nanoscopic window on the cell surface. Trends Cell Biol. 21, 461–469 (2011).
17. Liu, Z., Lavis, L. D. & Betzig, E. Imaging Live-Cell Dynamics and Structure at the Single-Molecule Level. Mol. Cell 58, 644–659 (2015).
18. Sahl, S. J., Hell, S. W. & Jakobs, S. Fluorescence nanoscopy in cell biology. Nat. Rev.
Mol. Cell Biol. 18, 685–701 (2017).
19. Huang, B., Bates, M. & Zhuang, X. Super-resolution fluorescence microscopy. Annu
27
20. Rossier, O. & Giannone, G. The journey of integrins and partners in a complex interactions landscape studied by super-resolution microscopy and single protein tracking. Exp. Cell Res. 343, 28–34 (2016).
21. Bertocchi, C. et al. Nanoscale architecture of cadherin-based cell adhesions. Nat. Cell
Biol. 19, 28–37 (2017).
22. Xu, K., Zhong, G. & Zhuang, X. Actin, spectrin, and associated proteins form a periodic cytoskeletal structure in axons. Science 339, 452–6 (2013).
23. Nair, D. et al. Super-resolution imaging reveals that AMPA receptors inside synapses
are dynamically organized in nanodomains regulated by PSD95. J. Neurosci. 33,
13204–24 (2013).
24. Chazeau, A. et al. Nanoscale segregation of actin nucleation and elongation factors determines dendritic spine protrusion. EMBO J. 33, 2745–2764 (2014).
25. Mehidi, A. et al. Transient Activations of Rac1 at the Lamellipodium Tip Trigger
Membrane Protrusion. Curr. Biol. 29, 2852-2866.e5 (2019).
26. Kanchanawong, P. et al. Nanoscale architecture of integrin-based cell adhesions.
Nature 468, 580–584 (2010).
27. Rossier, O. et al. Integrins β 1 and β 3 exhibit distinct dynamic nanoscale organizations inside focal adhesions. Nat. Cell Biol. 14, 1057–1067 (2012).
28. Morimatsu, M., Mekhdjian, A. H., Adhikari, A. S. & Dunn, A. R. Molecular tension sensors report forces generated by single integrin molecules in living cells. Nano Lett.
13, 3985–9 (2013).
29. Stabley, D. R., Jurchenko, C., Marshall, S. S. & Salaita, K. S. Visualizing mechanical tension across membrane receptors with a fluorescent sensor. Nat Methods 9, 64–67 (2011).
30. Plotnikov, S. V, Pasapera, A. M., Sabass, B. & Waterman, C. M. Force Fluctuations within Focal Adhesions Mediate ECM-Rigidity Sensing to Guide Directed Cell Migration. Cell 151, 1513–1527 (2012).
31. Margadant, F. et al. Mechanotransduction in vivo by repeated talin stretch-relaxation events depends upon vinculin. PLoS Biol 9, e1001223 (2011).
32. Ciobanasu, C., Faivre, B. & Le Clainche, C. Actomyosin-dependent formation of the mechanosensitive talin-vinculin complex reinforces actin anchoring. Nat. Commun. 5, 3095 (2014).
33. Chen, Y., Pasapera, A. M., Koretsky, A. P. & Waterman, C. M. Orientation-specific responses to sustained uniaxial stretching in focal adhesion growth and turnover. Proc.
Natl. Acad. Sci. U. S. A. 110, E2352-61 (2013).
34. Schnitzbauer, J., Strauss, M. T., Schlichthaerle, T., Schueder, F. & Jungmann, R. Super-resolution microscopy with DNA-PAINT. Nat. Protoc. 12, 1198–1228 (2017). 35. Lukinavičius, G. et al. Fluorogenic probes for live-cell imaging of the cytoskeleton.
Nat. Methods 11, 731–733 (2014).
36. Dempsey, G. T., Vaughan, J. C., Chen, K. H., Bates, M. & Zhuang, X. Evaluation of fluorophores for optimal performance in localization-based super-resolution imaging.
Nat. Methods 8, 1027–1040 (2011).
28
Science (80-. ). 313, 1642–1645 (2006).
38. Friedland, J. C., Lee, M. H. & Boettiger, D. Mechanically activated integrin switch controls alpha5beta1 function. Science (80-. ). 323, 642–644 (2009).
39. Cui, Y. et al. Cyclic stretching of soft substrates induces spreading and growth. Nat.
Commun. 6, 1–8 (2015).
40. Hu, K., Ji, L., Applegate, K. T., Danuser, G. & Waterman-Storer, C. M. Differential transmission of actin motion within focal adhesions. Science (80-. ). 315, 111–115 (2007).
41. Jiang, G., Giannone, G., Critchley, D. R., Fukumoto, E. & Sheetz, M. P. Two-piconewton slip bond between fibronectin and the cytoskeleton depends on talin.
Nature 424, 334–337 (2003).
42. Giannone, G., Jiang, G., Sutton, D. H., Critchley, D. R. & Sheetz, M. P. Talin1 is critical for force-dependent reinforcement of initial integrin-cytoskeleton bonds but not tyrosine kinase activation. J. Cell Biol. 163, 409–419 (2003).
43. Calderwood, D. a, Campbell, I. D. & Critchley, D. R. Talins and kindlins: partners in integrin-mediated adhesion. Nat. Rev. Mol. Cell Biol. 14, 503–17 (2013).
44. Trepat, X. et al. Universal physical responses to stretch in the living cell. Nature 447, 592–595 (2007).
45. Mizuno, D., Tardin, C., Schmidt, C. F. & MacKintosh, F. C. Nonequilibrium mechanics of active cytoskeletal networks. Science (80-. ). 315, 370–373 (2007). 46. Gardel, M. L. et al. Elastic behavior of cross-linked and bundled actin networks.
Science (80-. ). 304, 1301–1305 (2004).
47. Bausch, A. R., Ziemann, F., Boulbitch, A. A., Jacobson, K. & Sackmann, E. Local measurements of viscoelastic parameters of adherent cell surfaces by magnetic bead microrheometry. Biophys J 75, 2038–2049 (1998).
48. Desprat, N., Richert, A., Simeon, J. & Asnacios, A. Creep function of a single living cell. Biophys. J. 88, 2224–2233 (2005).
49. Wu, P.-H. et al. A comparison of methods to assess cell mechanical properties. Nat.
Methods 15, 491–498 (2018).
50. Várkuti, B. H. et al. A highly soluble, non-phototoxic, non-fluorescent blebbistatin derivative. Sci. Rep. 6, 26141 (2016).
51. Schiller, H. B. & Fässler, R. Mechanosensitivity and compositional dynamics of cell-matrix adhesions. EMBO Rep. 14, 509–19 (2013).
52. Horton, E. R. et al. Definition of a consensus integrin adhesome and its dynamics during adhesion complex assembly and disassembly. Nat. Cell Biol. 17, 1577–1587 (2015).
53. Sawada, Y. & Sheetz, M. P. Force transduction by Triton cytoskeletons. J Cell Biol
156, 609–615 (2002).
54. Hirata, H., Tatsumi, H. & Sokabe, M. Mechanical forces facilitate actin polymerization at focal adhesions in a zyxin-dependent manner. J. Cell Sci. 121, 2795–2804 (2008). 55. Dumbauld, D. W. et al. How vinculin regulates force transmission. Proc. Natl. Acad.
29
56. Rothenberg, K. E., Scott, D. W., Christoforou, N. & Hoffman, B. D. Vinculin Force-Sensitive Dynamics at Focal Adhesions Enable Effective Directed Cell Migration.
Biophys. J. 114, 1680–1694 (2018).
57. Yao, M. et al. Mechanical activation of vinculin binding to talin locks talin in an unfolded conformation. Sci. Rep. 4, 4610 (2014).
58. Zhang, X. et al. Talin depletion reveals independence of initial cell spreading from integrin activation and traction. Nat Cell Biol 10, 1062–1068 (2008).
59. Galbraith, C. G., Yamada, K. M. & Sheetz, M. P. The relationship between force and
focal complex development. J Cell Biol 159, 695-705. (2002).
60. Thievessen, I. et al. Vinculin-actin interaction couples actin retrograde flow to focal
adhesions, but is dispensable for focal adhesion growth. J. Cell Biol. 202, 163–177
(2013).
61. Giannone, G. et al. Lamellipodial actin mechanically links myosin activity with
adhesion-site formation. Cell 128, 561–575 (2007).
62. Choi, C. K. et al. Actin and alpha-actinin orchestrate the assembly and maturation of nascent adhesions in a myosin II motor-independent manner. Nat Cell Biol 10, 1039– 1050 (2008).
63. Franco, S. J. et al. Calpain-mediated proteolysis of talin regulates adhesion dynamics.
Nat. Cell Biol. 6, 977–983 (2004).
64. Saxena, M., Changede, R., Hone, J., Wolfenson, H. & Sheetz, M. P. Force-Induced Calpain Cleavage of Talin Is Critical for Growth, Adhesion Development, and Rigidity Sensing. Nano Lett. 17, 7242–7251 (2017).
65. Smith, M. A. et al. A zyxin-mediated mechanism for actin stress fiber maintenance and repair. Dev Cell 19, 365–376
66. Smith, M. A. et al. LIM Domains Target Actin Regulators Paxillin and Zyxin to Sites of Stress Fiber Strain. PLoS One 8, 1–12 (2013).
67. Oakes, P. W. et al. Optogenetic control of RhoA reveals zyxin-mediated elasticity of stress fibres. Nat. Commun. 8, (2017).
68. Yonemura, S., Wada, Y., Watanabe, T., Nagafuchi, A. & Shibata, M. alpha-Catenin as a tension transducer that induces adherens junction development. Nat. Cell Biol. 12, 533–42 (2010).
69. Ringer, P. et al. Multiplexing molecular tension sensors reveals piconewton force gradient across talin-1. Nat. Methods 14, 1090–1096 (2017).
70. Case, L. B. et al. Molecular mechanism of vinculin activation and nanoscale spatial organization in focal adhesions. Nat. Cell Biol. 17, (2015).
objective
Figure 1
b
vimentin-GFP vimentin DNA-PAINT tubulin confocal tubulin STED
stretching
chamber stretchingarm
holding arm 40 mm 24 mm 3x3 mm PDMS (1.41) 40 µm 10 µm 0.7 µm 170 µm glass (1.52) glycerol (1.47) oil (1.52) a d uniaxial stretch e vimentin-GFP f tubulin-GFP
before / after stretch 35%
tubulin STED after stretch 35% 35 %
before / afterstretch 35%
35 % vimentin DNA-PAINT after stretch 35% 1 µm 1 µm 10 µm vimentin-GFP 10 µm 10 µm g 1 µm 1 µm 3 µm
after stretch 35% after stretch 35%
confocal
after stretch 35% after stretch 35%
c
low resolution
fixation
SRM after fixation: PAINT, STED, PALM
low resolution live 30-50%