DESIGN AND ANALYSIS OF ARTIFACT-RESISTIVE
FINGER PHOTOPLETHYSMOGRAPHIC SENSORS
FOR VITAL SIGN MONITORING
by
Sokwoo Rhee
B.S., Mechanical Engineering Seoul National University, Korea (1995)M.S., Mechanical Engineering
Massachusetts Institute of Technology (1997) Submitted to the Department of Mechanical Engineering in Partial Fulfillment of the Requirements for the Degree of
Doctor of Philosophy
at the
BARKER
Massachusetts Institute of TechnologyJune 2000 MASSACHUSE1fT TC
OF TECHNOLOGY
©2000 Massachusetts Institute of Technology
All rights reserved
LIBRARIES
Signature of Author
Department of Mechanical Engineering May 8, 2000 Certified by ' YHarry H. Asada --7 Professor>fMechanical Engineering Thesis Supervisor Certified by Boo-Ho Yang Lntist of Mechanical Engineering rhesis Co-supervisor
Accepted by____________ ________
Ain A. Sonin Chairman, Department Committee on Graduate Students
DESIGN AND ANALYSIS OF ARTIFACT-RESISTANT FINGER
PHOTOPLETHYSMOGRAPHIC SENSORS FOR VITAL SIGN MONITORING
by
Sokwoo Rhee
Submitted to the Department of Mechanical Engineering On May 8, 2000, in Partial Fulfillment of the Requirements for the Degree of Doctor of Philosophy
in Mechanical Engineering
ABSTRACT
A miniaturized, telemetric, photoplethysmograph sensor for long-term, continuous monitoring is
presented in this thesis. The sensor, called a "ring sensor," is attached to a finger base for monitoring beat-to-beat pulsation, and the data is sent to a host computer via a RF transmitter. Two major design issues are addressed: one is to minimize motion artifact and the other is to minimize the consumption of battery power. An efficient double ring design is developed to lower the influence of external force, acceleration, and ambient light, and to hold the sensor gently and securely on the skin, so that the circulation at the finger may not be obstructed. To better understand the mechanism of motion artifact by external forces, a comprehensive mathematical model describing the finger photoplethysmography was developed and verified by finite element method, numerical simulation and experiments. Total power consumption is analyzed in relation to the characteristics of the individual components, sampling rate, and CPU clock speed. Optimal operating conditions are obtained for minimizing the power budget. A prototype ring sensor is designed and built based on the power budget analysis and the artifact-resistive attachment method. It is verified through experiments that the ring sensor is resistant to interfering forces and acceleration acting on the ring body. It is also shown that the device meets diverse and conflicting requirements, including compactness, motion artifact reduction, minimum loading effects, and low battery power consumption. Benchmarking tests with FDA-approved photoplethysmograph and EKG reveal that the ring sensor is comparable to those devices in detecting beat-to-beat pulsation despite disturbances. The long-term monitoring experiment shows that this device can effectively provide a considerable amount of artifact-free vital sign information in everyday life. Finally, guidelines for designing the ring sensor are proposed based on the analyses and the experiment results.
Thesis Committee Members:
Professor Harry H. Asada, Chairman Professor Roger D. Kamm
Professor Roger G. Mark Dr. Boo-Ho Yang
Acknowledgements
It has already been five years since I stood in front of the main gate of MIT for the first time. During that time, so many things have happened to me. Some of them were very exciting and delighting, and some of them were sad and discouraging. After all, I am so glad that I could finish my Ph.D. work and write this thesis.
Most of all, I would like to express my best and sincere thanks to my thesis advisor, Professor Harry H. Asada, for his constant encouragement and guidance. His profound insight and splendid wide vision gave me a great chance to get into the world of new research directions. His valuable support and advice were the greatest factor that enabled me to write this thesis. I also would like to express deep gratitude to the thesis committee members: Professor Roger D. Kamm, Professor Roger G. Mark, and Dr Boo-Ho Yang. They guided and helped me a lot in my research, and contributed greatly to my thesis.
I would like to express thanks to all my lab-mates in d'Arbeloff Laboratory who showed me sincere
friendship and care. Also I would like to express deep thanks to the continuous support of my good friends, especially Sangjun Han and Andy S. Kim. They made my life more energetic and enjoyable while I was going through a hard time struggling to make progress in my research. In addition, I would like to say thanks to all my friends at MIT.
Finally, I would like to give my best appreciation to my lovely wife, Eunkyoung Um. She has always been a great supporter of my work. I also would like to say thanks to my parents and my sister, who have been watching me with great love. Their love and care have been the main source of energy that has encouraged me throughout my life at MIT.
Even after I graduate from MIT, I will not be able to forget this wonderful school, and I think what MIT has taught me these five years will be the major thrust that will guide me through the rest of my life.
Contents
1. IN TR O D U C TIO N ... 9
1.1 BACKGROUND AND OBJECTIVES ... 9
1.2 PRIOR W ORK IN THE FIELD... 10
1.3 OUTLINE OF THESIS ... 11
2. TH E R IN G SEN SO R ... 14
2.1 BASIC DESCRIPTION OF THE RING SENSOR ... 14
2 .2 IS S U E S ... 15
3. A R TIFA C T -R E SISTA N T D ESIG N ... 17
3.1 ISOLATING RING ARCHITECTURE ... 17
3.2 M OVEMENT DETECTION BY SOFTWARE ... 19
3.3 M OVEMENT DETECTION USING ACCELEROMETER ... 19
4. POWER SAVING ELECTRONICS DESIGN... 21
4.1 DESCRIPTION OF THE BASIC CIRCUITRY... 21
4.2 POW ER BUDGET...22
5. THEORETICAL ANALYSIS OF FINGER PHOTOPLETHYSMOGRAPHY WITH R IN G SEN SO R ... 26
5.1 BACKGROUND...26
5.2 APPROACH ... 27
5.3 M ODELING ... 29
5.3.1 Optical M odel... 29
5.3.2 Tissue M echanical M odel...32
5.3.3 Dynam ics of the Arterial Wall ... 36
5.3.4 Param eter Calibration and Estimation ... 39
5.3.4.1 Validation of the Model and Determination of Stiffness of the Tissue by FEM...39
5.3.4.2 Determ ination of Optical Properties : Capillaries and Veins ... 41
5.3.5 Completing the Blood Vessel M odel... 46
5.4 VERIFICATION BY FINITE ELEMENT METHOD, NUMERICAL SIMULATION AND EXPERIMENT ... 47
5.4.1 Analysis of the Sim ulation and Experiment.: Case 1... 48
5.4.2 Analysis of the Simulation and Experiment: Case 2... 51
5.5 VERIFICATION OF ADVANTAGES OF THE ISOLATING RING SENSOR BY FINITE ELEMENT METHOD .... 53
6. SIGNAL PROCESSING WITH CORRELATION FUNCTIONS... ... 57
6.1 BACKGROUND...57
6 .2 T H E O R Y ... 5 8 6.2.1 General D escription of the Signal Conditioning Process ... 58
6.2.2 Theoretical D escription of the Autocorrelation Function... 59
6.3 NUMERICAL SIM ULATION... 63
6.4 EXPERIMENT ... 65
6.4.2 Experiment Results...67
7. PROTOTYPING AND FABRICATION ... 68
7 .1 P A C K A G IN G ... 6 8 7.2 ELECTRONIC COMPONENT SELECTION...69
7.3 THE POWER-OPTIMAL CLOCK FREQUENCY ... 70
7.4 SOFTWARE DESIGN ... 72
7.4.1 Software for the M icroprocessor on the Ring Side... 72
7.4.2 Software for the Host Computer with Artifact Detection ... 72
8. M INIATURIZATION ... 74
8 .1 B A C K G R O U N D ... 74
8.2 ISSUES OF M INIATURIZATION ... 75
8.2.1 How do we reduce size? ... 75
8.2.2 What kind of circuit boards will we use? ... 77
8.2.3 How do we reduce the power consumption from the viewpoint of hardware?... 77
8.3 PROCESS OF FABRICATION...78
8.3.1 Finalize the circuit and collect the necessary components. ... 78
8.3.2 Design a conducting pattern to be put on the ceramic substrate or the printed circuit board. . 79
8.3.3 M ake the circuit board using gold as the conducting material... 79
8.3.4 Put the components on the board and make connections... 79
8.3.5 Do external wirings and debugging ... 80
8.3.6 Software - In circuit Programming... 80
9. VERIFICATION AND BENCHM ARKING ... 82
9.1 SOFTWARE-BASED ARTIFACT DETECTION ... 82
9.2 ADJUSTMENT OF INNER RING TENSION AND CONTACT PRESSURE... 83
9.3 COMPARISON BETWEEN THE ISOLATING RING AND A NON-ISOLATING RING ... 85
9.4 BENCHMARKING ... 87
9.5 LONG-TERM M ONITORING EXPERIMENT... 91
9.6 DESIGN GUIDELINES FOR THE RING SENSOR ... 92
10. CONCLUSIONS ... 96
List of Figures & Tables
Figure 2-1 Conceptual diagram of the ring sensor
Figure 3-1 Dislocation of ring sensors due to external load Figure 3-2 Construction of isolating ring
Figure 3-3 Various Signals Detected by the Ring
Figure 3-4 Detection of movement by 3-D accelerometer Figure 4-1 Block diagram of electronic circuit
Figure 5-1 (a) Uncompressed finger under no external force (d=0). (b) Finger compressed by the ring due to an external force.(d>0)
Figure 5-2 Optical model of the finger and optical elements. Blood vessels have different optical properties from the tissue.
Figure 5-3 (a) Initial state of the ring with LED and photodetector (b) When the finger moves in the ring (Finger tissue is deformed.)
Figure 5-4 Geometry of the LED, the photodetector, artery 1, and the skin capillary layer Figure 5-5 Change of arterial wall radius (Rr) with transmural pressure (Pt)
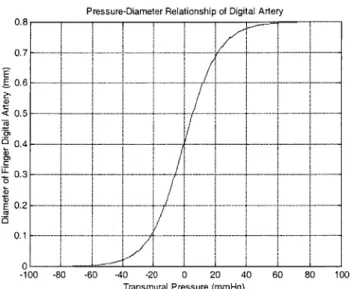
Figure 5-6 Pressure-diameter relationship of human digital artery
Figure 5-7 Pressure-diameter relation curve described by sigmoid function
Figure 5-8 Finite element analysis of the finger segment under constant pressure of 120 mmHg. Figure 5-9 Deformed finger segment under external pressure, generated by FEM.
Figure 5-10 Volumetric changes of the finger segment with various values for Young's modulus.
Figure 5-11 FEM Analysis: Single Ring: E=20000, v=0.49, disp=2mm, angle=90 deg Figure 5-12 FEM Analysis: Single Ring : E=20000, v=0.49, disp=2mm, angle=20 deg
Figure 5-13 Single Ring : E=20000, v=0.49, disp=2mm, angle=90 deg, 3-D View
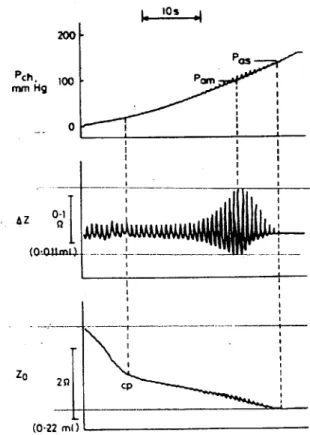
Figure 5-14 Single Ring : E=20000, v=0.49, disp=2mm, angle=90 deg, Cross Sectional View at x=0 Figure 5-15 Simultaneous recordings of chamber pressure (Pch), AC components of impedance variation
(AZ), and DC components of the impedance variation (Z0).
Figure 5-16 Numerical simulation result of the volume change (AC components) of 1 cm finger segment under external pressure
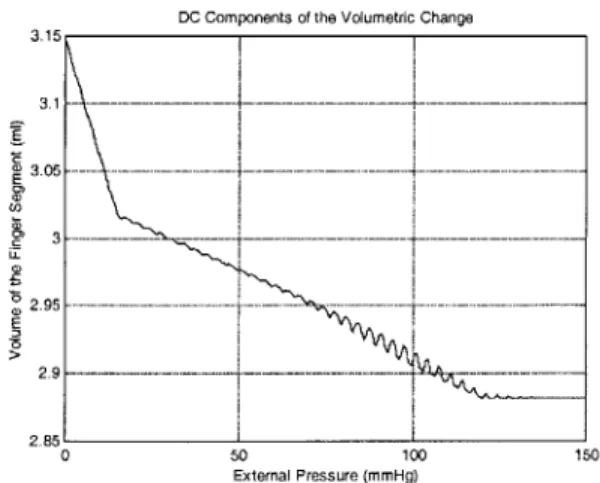
Figure 5-17 Numerical simulation result of the volume change (DC components) of 1 cm finger segment under external pressure
Figure 5-18 Two cases of finger movements in the ring Figure 5-19 Visualization of movement at case 1
Figure 5-20 Single Ring - 3-D View : E=20000, v=0.49, disp=2mm, angle=20 deg
Figure 5-21 Single Ring : E=20000, v=0.49, disp=2mm, angle=20 deg, Cross sectional view at x=0 Figure 5-22 Pressure distribution as a function of angle in the finger cross section generated by the
lumped parameter model.
Figure 5-23 Pressure distribution as a function of angle in the finger cross section generated by finite element method.
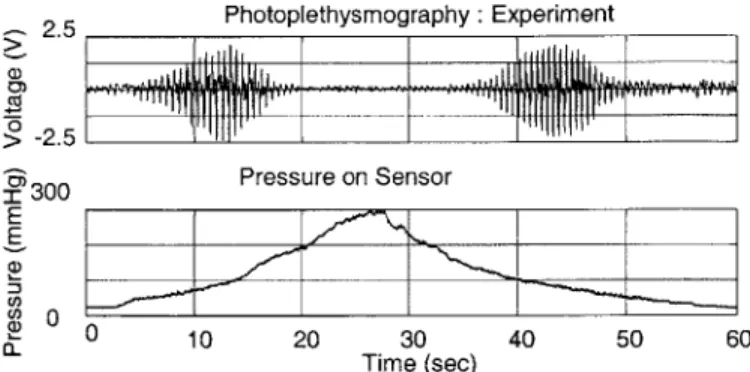
Figure 5-24 Photoplethysmography and pressure at sensor unit from experiment in case 1
Figure 5-25 Photoplethysmography and pressure at sensor unit from numerical simulation in case 1 Figure 5-26 Pressure distribution as a function of angle in the finger cross section generated by the
lumped parameter model.
Figure 5-27 Pressure distribution as a function of angle in the finger cross section generated by finite element method.
Figure 5-28 Visualization of movement at case 2.
Figure 5-29 Photoplethysmography and pressure at sensor unit from experiment in case 2
Figure 5-31 FEM Analysis: Isolating Ring: E=20000, v=0.49, disp=2mm, angle=90 deg Figure 5-32 FEM Analysis : Isolating Ring : E=20000, v=0.49, disp=2mm, angle=20 deg Figure 5-33 Isolating Ring: E=20000, v=0.49, disp=2mm, angle=90 deg, 3-D View
Figure 5-34 Isolating Ring: E=20000, v=0.49, disp=2mm, angle=90 deg, Cross Sectional View at x=0
Figure 5-35 Isolating Ring : E=20000, v=0.49, disp=2mm, angle=90 deg, Cross Sectional View at the Outer Ring
Figure 5-36 Isolating Ring : E=20000, v=0.49, disp=2mm, angle=90 deg, Longitudinal View Figure 5-37 Isolating Ring : E=20000, v=0.49, disp=2mm, angle=20 deg, 3-D View
Figure 5-38 Isolating Ring: E=20000, v=0.49, disp=2mm, angle=20 deg, Cross Sectional View at x=0
Figure 5-39 Isolating Ring : E=20000, v=0.49, disp=2mm, angle=20 deg, Cross Sectional View at the
Outer Ring
Figure 5-40 Isolating Ring: E=20000, v=0.49, disp=2mm, angle=20 deg, Longitudinal Cut-Plane View Figure 5-41 Isolating Ring : E=20000, v=0.49, disp=2mm, angle=90 deg, Wide Ring, 3-D View
Figure 5-42 Isolating Ring : E=20000, v=0.49, disp=2mm, angle=90 deg, Wide Ring, Cross Sectional
View at x=0
Figure 6-1 Signal Processing Flow Chart
Figure 6-2 Periodic Source with 1 Hz Frequency s[n] Figure 6-3 Random Noise d[n]
Figure 6-4 Combined Signal x[n]
Figure 6-5 Autocorrelation function of x[n] Figure 6-6 Second autocorrelation function of x[n] Figure 6-7 Experiment Setup
Figure 6-8 Original ring sensor signal and the result after autocorrelation Figure 6-9 Autocorrelation function showing the second peak of the heartbeat Figure 7-1 Isolating ring sensor designed for motion artifact minimization Figure 7-2 Comparison of Power Budget
Figure 8-1 First Prototype Ring Sensor
Figure 8-2 Ring Sensor with One or Two Circuit Boards Figure 8-3 Wire Bonding Machine
Figure 8-4 Dimensions of Components
Figure 8-5 Pictures of the miniaturized circuit boards Figure 8-6 Miniaturized ring sensors
Figure 9-1 Signal contaminated by motion artifact
Figure 9-2 Signal contaminated by ambient light influence.
Figure 9-3 Experiment of pulsation amplitude and skin contact pressure Figure 9-4 Experiment of tension-strain characteristics of inner ring band Figure 9-5 Static force experiment
Figure 9-6 Comparison between the ring sensor of the single body design and the isolating ring sensor under external static force.
Figure 9-7 Comparison between the ring sensor of the single body design and the isolating ring sensor under acceleration.
Figure 9-8 No external static force with contact pressure of 75 mmHg. Figure 9-9 Static force experiment with 75 mmHg contact pressure. Figure 9-10 Static force experiment with 11 mmHg contact pressure.
Figure 9-11 Heart rate monitored by EKG, Fingertip PPG device, ring sensor Figure 9-12 A part of the two-hour monitoring test result
Figure 9-13 Guidelines for the design of the ring sensor.
Table 9-1 RMS error (beats/min) of the heart rates from the ring sensor compared with those from the EKG and fingertip PPG device
1. INTRODUCTION
1.1 Background and Objectives
Ambulatory patient care makes up the bulk of medical care and affords the best opportunity for preventive medicine. The renaissance of interest in ambulatory care in general, and for the hi-risk cardiac patient in particular, is gaining ever-increasing momentum. With the aid of modem technology and a better understanding of physiological processes, medical care is experiencing a rapid evolution in both diagnostics and therapeutics. This technical progress now provides the potential for improved care of the patient in the ambulatory environment. From the administrative and economic aspects, moving the focus of care from the hospital to the ambulatory environment can bring about considerable economic benefits. From the patients' viewpoint, they can avoid being confined in the hospital environment solely to guard against any future outbreak, but still protected from those possibilities by online observation [1].
Vital sign monitoring is becoming increasingly important for securing independent lives as the population of aged people increases. Online, continuous monitoring allows us to detect emergencies and abrupt changes in the patient's condition. Especially for cardiac patients, online, long-term monitoring plays a pivotal role. It provides critical information for long-term assessment and preventive diagnosis for which long-term trends and signal patterns are of special importance. Such trends and patterns can hardly be identified by traditional examinations. Those cardiac problems that occur frequently during normal daily activities may disappear the moment the patient is hospitalized, causing diagnostic difficulties and consequently possible therapeutic errors. In this sense, continuous and ambulatory monitoring systems are needed to detect the traits.
Although there have been many ambulatory monitoring systems developed and discussed, none of them have reached the level that can fully cover the patients' everyday lives, mostly due to the fact that those devices are bulky and inconvenient to carry. When taking a shower, for example, people tend to remove any ambulatory monitoring devices. Bathrooms, however, are one of the most dangerous places in the home. More than 10,000 people, mostly hypertensives and the elderly, die in bathrooms every year. Therefore, it is important that the ambulatory monitoring devices should be easy to wear in everyday life. Such long-term, ambulatory devices must be compact, lightweight,
and comfortable to wear at all times. They must be designed for low power consumption for long term use. Furthermore, they must be able to detect signals reliably and stably in the face of motion artifact and various disturbances. Unlike traditional monitoring systems, these devices are used under no supervision of clinicians. Data is collected from the daily lives of patients in an unstructured environment.
The goal of this thesis is to develop the technology for obtaining reliable measurements of vital signs for long-term use. A miniaturized photoplethysmograph (PPG) device in a ring configuration will be designed and tested, which will be used for continuously measuring valuable information such as heart rate. It will be shown that the device meets diverse and conflicting requirements, including compactness, motion artifact reduction, minimum loading effects, and low battery power consumption. Mathematical modeling of the finger under external forces will help understand the underlying principle of vital sign monitoring by the ring sensor. Its benchmarking tests with the
FDA approved PPG and EKG will show the validity of the technology.
1.2 Prior Work in the Field
The ambulatory ECG (Holter) device, one of the most widely accepted ambulatory monitoring systems, was developed and extensively studied by N.J. Holter [2]. Bellet also devised a continuous 2-hour tape recording system using a similar device [3]. When the ambulatory ECG device was first introduced, the device was not immediately widespread due to concerns over the lack of previous documentation of coronary artery disease, the device's reliance upon T-wave changes, and the lack of recorder fidelity [1]. After many improvements and validity tests, the ambulatory ECG technology has gained increasing popularity. The ambulatory ECG, however, is not applicable to long-term monitoring for a period of several weeks or months. The machine is bulky, heavy, and uncomfortable to wear due to cumbersome wires and patches. Recently, a variety of vital sign sensors have been developed that are compact and easy to wear. Yamashita, et al. [4] attempted to develop a simple telemetry device for monitoring the pulse at a finger. Wristwatch-type pulse oximetry and blood pressure sensors have been developed and commercialized by several companies including Casio (BP-100 and JP200W-1V) and Omron (HEM-608 and HEM-609). These devices, although much easier to wear, have not yet been used clinically. Many technical issues still need to be solved prior to clinical use. In general, long-term, ambulatory monitoring
systems have not yet reached a technical level that is widely accepted by both clinicians and patients. These devices are still unsatisfactory in size, and cannot provide long-term use due to a lack of battery power. In addition, since the collected data is either erased or recorded in restricted memory space included in the devices, creating a patient history over a long period of time is practically impossible. For long-term use, power consumption should be minimized and a method of archiving the obtained data developed. For example, if the data can be continuously transferred wirelessly elsewhere and stored someplace other than the ambulatory monitoring device itself, its size can be further reduced and its weight become light.
As for the effect of motion artifact on ambulatory monitoring devices, there have been many attempts to analyze and reduce the influence of motion on the monitored signals. Many researchers have attempted to quantify the movement artifact in pulse and oxygen saturation measurements
[5][6], and some researchers have used advanced filtering techniques such as an adaptive noise canceler to reduce the impact of motion [7]. In terms of the modeling of photoplethysmography, Higgins, J. L. and Fronek, A. derived a mathematical formulation of reflectance photoplethysmography to evaluate the relationship between skin reflectance and skin blood flow
[8]. Their model was based on the modeling of cutaneous blood flow. Yamakoshi [9][10] and
Wesseling [11] have conducted numerous experiments about finger photoplethysmography, mainly focusing on the cuff-based pressure measurement technique.
Although there exist many experimental results and mathematical models that can help understand the principles of finger photoplethysmography, they cannot be directly applied to the case of the ring sensor since they have mostly focused on the response of finger photoplethysmography under uniform pressure applied around the finger. In case of the ring sensor, "local pressure" is applied to the finger as the ring moves. Therefore, to deal with the movement of the ring sensor, we need a new mathematical model that can explain the photoplethysmography when the finger is under non-uniformly distributed pressure.
1.3 Outline of Thesis
This thesis will discuss the design and analysis of the ring sensor. The issues involved in the design of the ring sensor, including motion artifact minimization, power consumption minimization, and loading effect problems, will be dealt with both theoretically and experimentally. To assess the
conditions that contribute to the variations of the signal in the presence of mechanical disturbances, a mathematical model of finger photoplethysmography that can explain the variations under external forces will be developed and discussed in detail. Many other practical issues involved in prototyping and signal processing will be depicted.
In chapter 2, the ring sensor concept is introduced and the issues involved are presented. These issues will be further discussed in the later chapters. Chapter 3 is dedicated to an in-depth discussion of one of the major issues: motion artifact. A unique design called the "Isolating ring sensor design" will be presented and its advantages will be discussed. Methods for detecting the signals contaminated by artifacts will be also presented in this chapter. In chapter 4, the issue of power consumption minimization is presented. The basic circuitry of the ring sensor is explained. A mathematical analysis of power consumption is addressed and its minimization process is described. In chapter 5, a theoretical analysis of the response of the finger photoplethysmography under external force is thoroughly discussed. A new mathematical model that includes an optical model, a tissue mechanics model, and a blood vessel model is developed. Using this model, a variation of the finger photoplethysmography with external pressure applied to the ring will be analyzed and predicted. In particular, this model will be able to deal with the effect of local pressure on the finger. Eventually, this model will be used to assess the conditions that can make the ring sensor less sensitive to mechanical disturbances. This mathematical model will be verified by numerical simulations and experiment results. Chapter 6 will discuss signal processing techniques used for extracting the pulse wave from distorted photoplethysmographic signals. A crosscorrelation method will be used to obtain the periodic pulse signal from the noise-dominating signal. Its effectiveness will be discussed in terms of numerical simulations and an analysis of the experiment results. In chapter 7, the prototyping of the ring sensor will be described in detail. The packaging of the device and the selection of electronic components, considering size and power consumption, will be discussed. The actual derivation of the optimal clock frequency of the CPU for power consumption minimization will be given, and the design of the software including the PC monitoring program and the micro code for the ring sensor CPU, will be introduced. In chapter 8, practical issues concerning the miniaturization of the whole circuitry to the size of a real finger ring will be presented. The usage of die form chips, the wire bonding technique and miniature components will be discussed. In chapter 9, extensive experiment results will be presented and analyzed. The ring sensor will be benchmarked to other monitoring devices such as the EKG and FDA-approved
fingertip photoplethysmographic sensors. In addition, the effectiveness of the isolating ring design will be verified by experiments.
2. THE RING SENSOR
2.1 Basic Description of the Ring Sensor
The ring sensor is a miniaturized, telemetric, monitoring device worn by a patient as a finger ring. The ring encapsulates photoplethysmographic, pulse oximetry combined with wireless communication and miniaturization technologies. This device optically captures the pulsation and oxygen saturation of the arterial blood flow, and transmits the signals to a host computer via an RF transmitter. Figure 2-1 shows a conceptual diagram of the ring sensor [12][13]. The ring sensor consists of optoelectronic components, a CPU, an RF transmitter, a battery, and a ring chassis. The optoelectronic components, i.e. micro photodiodes and LEDs, detect the blood volume waveforms and oxygen saturation level in the patient's digital artery. The CPU controls the LED lighting sequence as well as the data acquisition and transmission process. These signals are locally processed by the on-board CPU and transmitted to a host computer for diagnosis of the patient's cardiovascular conditions. The ring sensor is completely wireless and miniaturized so that the patient can wear the device comfortably twenty-four hours a day.
Battery
RF Transmitter CPU
Photo Diode
LEDs
Figure 2-1 Conceptual diagram of the ring sensor
For continuous patient monitoring, the device must be compact, easy to wear, non-intrusive, and non-invasive. It also must be equipped with wireless communication technology since the data must be transferred to base stations without physical wiring. The miniaturized sensor in a ring configuration is a rational design choice for twenty-four hour continuous monitoring, since a finger ring is probably the only thing that a majority of people will be willing to wear at all times. Other personal ornaments and portable instruments, such as earrings and wristwatches, are not continually worn in daily living. Miniature ring sensors provide a promising approach to monitoring a patient at all times. Also, a ring configuration provides the anatomical advantage of being able to use the
transparent skin and tissue at the finger, so that it becomes feasible to monitor arterial blood volume at the finger base using an optoelectronic sensor. Subsequently, a variety of simple cardiac and circulatory disorders may be detected by monitoring arterial blood volume at the finger base.
2.2
Issues
The ring sensor, however, is inevitably susceptive to a variety of disturbances such as a patient's motion and ambient lighting. When the patient moves, the inertia force created at his/her finger causes the ring to move relative to the skin surface and, as a result, measurement may be distorted or even ruined completely. When the ring touches an environment surface, the contact force may cause a distortion of the measurement due to the relative displacement of the sensor to the finger. In addition, ambient lighting is another major source of artifact for optical measurement. These kinds of disturbances degrade the quality of measurement and can make the ring sensor an unreliable device.
Another important issue with this type of wearable sensor is the possible necrosis of finger tissues, or ulcers caused by local ischemia. To attain stable photoplethysmograph signals, it is necessary to apply a certain magnitude of pressure to the skin surface. Such pressure application is nothing harmful for short-term monitoring, but would be a problem for long-term use. With a constant, prolonged pressure at the finger base, the arteriovenous and cutaneous circulation in the finger can be obstructed, and possibly result in subsequent tissue sphacelation. Numerous studies have dealt with the effect of ischemia on tissue and other types of pressure sores, and a few have addressed the critical pressure and duration problem [14][15][16]. These have found that an inverse relationship exists between the critical pressure and duration. Some have also investigated ischemic hyperemia on the finger, which may eventually result in tissue injury [17]. In the case of the finger, blocking the venous return will cause serious problems even at a relatively low pressure since the circulation will be obstructed by the pressure. Therefore, the ring sensor should be designed for minimum circular obstruction by keeping the tissue pressure at a low level.
In addition, the whole electronic circuit must be designed for minimum power consumption in order to operate it for a long time without changing or recharging the battery. Among others, LED is one of the most power-consuming parts involved in the ring sensor. Therefore, the intensity of the LEDs must be lowered, along with a reduction of the duty cycle. This, however, incurs a poor
signal-to-noise ratio problem. The signals obtained with dark LEDs are weak and must therefore be amplified many thousand times. As a result, it becomes susceptive to any disturbance.
There are a number of existing techniques for dealing with artifact and disturbance rejection. The most common is signal processing, as reviewed by [18]. Another standard method is to identify and reject corrupt signals by comparing pulse features with a predetermined template. Other methods use modulation by controlling the power level of multiple lighting sources [18]. All of these methods, however, involve the modification and conditioning of received signals, and do not eliminate or reduce the influence of the sources of the artifact. The artifact problem of the ring sensor is primarily due to the difficulties of attaching the sensor to the skin. This source of artifact must be removed before applying those signal processing methods.
In the following sections, a new design having a double ring configuration will be developed in order to minimize the influence of both mechanical and optical disturbances, while avoiding excessive pressure on the finger.
3. ARTIFACT-RESISTANT DESIGN
3.1 Isolating Ring Architecture
Figure 3-1(a) shows the cross-sectional view of the original ring sensor where the optoelectronic sensor unit, i.e. the LEDs and photodiodes, is attached directly to the body of the ring. (previously developed by the authors [12] [13]) The problems with this design are:
* When the ring touches the environment surface, the ring is pushed to one side, creating an air gap between the sensor unit and the skin, or increasing the pressure with which the sensor unit is attached. This causes significant fluctuation in the sensor reading.
" The body of the ring sensor, including the battery and circuitry, tends to be heavy. A small
acceleration of the finger and even gravity affecting the ring itself may cause a displacement relative to the skin surface. Securing the ring body requires a large force applied to the finger skin.
" It is difficult to shield the sensor unit from ambient lighting.
To resolve these problems of the original ring design, a new design is presented in this section. The new design, called an "isolating ring configuration," is illustrated in Figure 3-2. The main idea of this design is to separate the sensor unit from the rest of the ring body, which is much heavier than the optical sensor unit alone. The separation is achieved by having two rings that are mechanically decoupled to each other. The inner ring shown in the figure holds the sensor unit alone, while the outer ring contains the CPU, signal processing unit, battery, and RF transmitter. Only a thin, flexible cable assembly connects the two rings. This decoupled design has the following advantages.
Alleviating the influence of external forces applied to the ring
Forces due to mechanical contacts are borne by the outer ring, and are not directly transmitted to the sensor unit on the inner ring. As shown in Figure 3-1(b), the load of the external force is bypassed
Circuit Board Outer Ring (CPU, RF Transmitter)
Ring Inner Ring
Finger
_ _-i----i-- Displacement _ of the ring
ptical Sensor Unit
(LED, Photodetector) External
Finger External Force
(a) Force (b)
Figure 3-1 Dislocation of ring sensors due to external load (a) Traditional single body design under external force (b) New isolating ring sensor under external force
Circuit Board
(CPU, RF Transmitter, etc.)
Outer Ring (Housing)
/
I
Flexible wires connecting the inner ring and the outer ring
Inner Ring (With Optical Sensor Unit)
Figure 3-2 Construction of isolating ring
to the finger bone and is supported by the two feet of the bridge-like outer ring. Thereby the force does not directly influence the actual sensor unit attached to the inner ring.
Alleviating the effect of acceleration on the sensor
The inertia of the sensor unit is very small since it contains only a few LEDs and photodiodes. Due to the small inertia of the inner ring, the inertia force acting on the sensor unit is negligibly small. In consequence, the position of the optical sensor does not change significantly when the finger is accelerated.
Reducing skin contact pressure
The outer ring doesn't have to be secured tightly, while the inner ring doesn't need a great pressure to secure it to the body, since it is light. Therefore, the possibility of necrosis caused by local ischemia and occlusion is lowered. This solves a critical problem of wearable sensors and long-term monitoring systems such as the ring sensor.
Reducing the influence of ambient lighting
The outer ring shields the sensor unit and thereby reduces optical disturbances from ambient lighting. The isolating ring structure provides the sensor unit with an optical shield.
Thus the isolating ring structure alleviates those critical problems of the original single-body ring sensor.
3.2
Movement Detection by Software
Transmitted photoplethysmograms are received and analyzed by a home computer. Although the signal is already filtered and refined by the analog signal conditioner in the ring sensor, it still contains high frequency noise due to ambient light sources and motion artifacts. For example, Figure 3(a) shows a steady photoplethysmogram with no artifact, whereas Figures 3(b) and 3-3(c) show the signal contaminated by the influence of ambient light and motion artifact,
100 (a) 50 AVVV W 0 2 4 6 8 10 12 100 80 (b) 60 0 2 4 6 8 10 12 150 100 (C) 50A 0 2 4 68 10 12 time(sec)
Figure 3-3 Various Signals Detected by the Ring
respectively. It is clearly seen that the contaminated signal carries high frequency noise even though it has already passed through a hardware lowpass filter. When the host computer detects high-frequency noise, the computer does not display the waveforms on the screen.
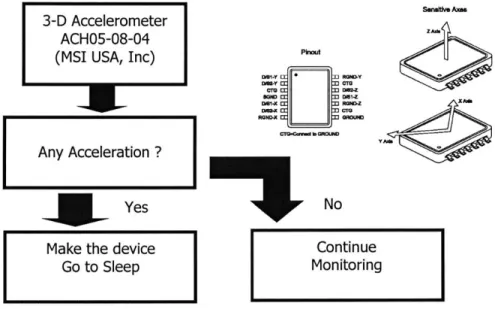
3.3 Movement Detection using Accelerometer
When the finger moves dynamically, the signal from the ring sensor is drastically distorted and even saturated. In this case, it is almost impossible to recover the original plethysmographic signal.
Therefore, it is better to ignore the monitored signal under heavy motion. Although it is possible to detect the motion to some extent with simple signal processing techniques, software-based motion artifact detection is rather indirect and less accurate. Since most of the motion can be effectively detected with an accelerometer, using a MEMS accelerometer is a good method. Figure 3-4 shows a diagram of the algorithm. Since the monitored signal is just ignored when the ring sensor is moving, it can effectively reject any signal contaminated with artifact from dynamics motion.
3-D Accelerometer ACH05-08-04
(MSI USA, Inc)
Yes Make the device
Go to Sleep PhkA DW62-Y -E ] R=0N -ACc 3ROND-I No SanaM Axes Continue Monitoring
Figure 3-4 Detection of movement by 3-D accelerometer
4. POWER SAVING ELECTRONICS DESIGN
4.1 Description of the Basic Circuitry
Since the device has to be worn for a long time without an external power supply, it is critical to minimize power use as much as possible. The whole circuit must be designed with a consideration of maximum power saving. Figure 4-1 shows a block diagram of the ring sensor circuitry. The basic circuit configuration is a standard photoplethysmographic circuit combined with a wireless transmitter. There are LEDs of two different wavelengths, red and near infrared, and a single photodiode involved in the circuit. The output from the photodiode is amplified and conditioned at the first stage operational amplifier. While the red and infrared LEDs are alternately turned on and off, the signal from the first stage op-amp is sampled by the two sample-and-hold circuits at different timings in order to obtain the reflected light intensity from each LED. Each channel of the signal is conditioned and converted to a digital signal with an AD converter. Using the standard
RS-232 protocol, the two channels of digital signals are transmitted via an RF transmitter.
This circuit is a standard one, but the whole system is designed and operated for low-power consumption. Since the battery cell is the dominant factor determining the dimension and weight of the device, large batteries cannot be used for the ring sensor; hence the reduction of power consumption is critically important for miniaturizing the sensor. Each component has to be selected for low-power consumption, and the whole system must operate with a minimum of power consumption. The microprocessor coordinates the whole operation so that reliable measurements
Red LED
Amplifier Sample Signal AD \/7
& Switch .. & Hold Conditioner Converter
Power-Saving Wireless
Protocol Transmission
IR LED
LSample Signai AD
& AHold MConditioner Convre
Schedruling
and |Clock
Alternation | |
are taken with minimum power. The total power consumption depends both on the individual component characteristics and on the way that the components are controlled and operated. In the following section, a power consumption model will be derived in order to obtain guidelines for selecting components as well as for operating the system.
4.2 Power Budget
Among the many components involved in the ring sensor, the LEDs and the RF transmitter consume over 70% of the total power; hence a saving in the power consumption of these components contributes significantly to the overall power saving. The objectives of this section are to provide a detailed power budget of the ring sensor, and to present an approach to minimize the power consumption pf the LEDs and the RF transmitter while satisfying the specifications of the ring sensor. The power budget may differ depending on the specific algorithms and control schemes needed to operate the LEDs and RF transmitter. In the following, a power budget will be obtained for a specific control algorithm that is simple and feasible for implementing on a miniaturized ring sensor. For different algorithms, a power budget can be obtained without difficulty in the same way as the following formulation.
LED
LEDs consume a large amount of power when emitting light continuously. Therefore they must be switched on only for the short interval when light must be emitted. Namely, the LEDs must be on only when the photodiode is detecting the reflected light that measures the pulsation. Synchronizing the sampling of the photodetector with the LED switching reduces the duty ratio of the LEDs, and thereby reduces the power consumption. In the prototype system, this coordination is performed by the microprocessor. First the LEDs are turned on, second the photo detector signal is sampled at the next CPU cycle, and the LEDs are switched off at the third CPU cycle. This sequence control is performed for both red and infrared LEDs. As the CPU clock cycle increases, the duty ratio of the LEDs decreases, and hence the power consumption decreases. However, the CPU consumes more power as the clock frequency increases. Therefore, a trade-off must be made between the CPU power and the LED power in order to minimize the overall power consumption.
q: internal clock frequency of the microprocessor (Hz)
f:
sample-and-hold frequency (Hz)r: duty ratio of LEDs
C,: total power consumption of the red LED circuit per second Ci: total power consumption of the infrared LED circuit per second
In the above lighting sequence, both red and infrared LEDs are turned on for three internal CPU clock cycles, that is, 3 / q seconds. Therefore the duty ratio of the LEDs is r = 3f / q. The average
power consumption of the LEDs is given by
P1 (q)= r(Cr + Ci)- 3f(Cr +c) (4-1)
q
Microprocessor
In general, the power consumption of a microprocessor increases with the clock speed. In the prototype ring sensor, a linear relationship exists between the power consumption and clock speed
q:
Pm(q)= aq +b (4-2)
where the coefficients a and b can empirically be determined.
RF Transmitter
The sampled analog signals are converted to digital signals by an A/D converter and transmitted through the RF transmitter controlled by the same microprocessor. The transmission protocol is the standard RS-232 using simple on-off keying. The most power-consuming part of the digital RF transmitter is an oscillatory circuit involving a CMOS power transistor, which consumes a significant amount of power only when the output is high, i.e. 1-bit. In other words, the power consumption is virtually zero when the output is low, i.e. 0-bit. Therefore, power can be saved by reducing the pulse width of each 1-bit. In the standard RS-232 protocol, the width can be reduced
simply by increasing the baud rate. As the baud rate increases, transmission is completed in a shorter period of time, leaving a longer time for the transmitter to be in an idle state with no power consumption. However, a higher baud rate of the transmitter requires a higher clock frequency for the microprocessor, which results in larger power consumption. Similar to the previous case, a trade-off must be made between the CPU power and the transmitter power. We now formulate the power budget of the transmission circuit and optimize the power consumption in terms of the clock frequency.
Key parameters associated with RF transmission are:
d: baud rate of transmission (bps)
n : number of sample points to be transmitted per second (Hz) m: average number of high bits to be transmitted per second (bps) Ct: total power consumption of the transmission circuit per second
Transmission of one bit needs at least 6 CPU instructions, including branching, port setting, carrier setting, and bit-shifting instructions. Therefore it takes 6 internal CPU clock cycles. Namely, the fastest baud rate that can be achieved for a given clock frequency is d = q /6. In the prototype ring
sensor, the resolution of the A/D converter is 8 bits; hence one sample point is one byte of data. Including the start bit and the stop bit, the standard RS-232 protocol needs five high bits to transmit on average per sample point (one byte), resulting in m = 5n. Therefore, the average duty ratio of the
RF transmitter transmitting a high bit is m / d = 30n / q. The average power consumption due to RF
transmission is therefore given by
Pt (q)= 30nCt (4-3)
q
The total average power consumption of the LEDs, RF transmitter, and microprocessor is
PT (q)= P (q)+ Pt (q)+ Pm(q)= 3f(Cr +ic)+ 3nCt + aq+b (4-4)
The optimal internal clock frequency q* can be obtained by differentiating the above equation and equating it to zero: dPT 3f (C, +Ci 3 30nC tOf+ --- q- + a = 0 (4-5) dqq2 Namely, * 3f (Cr + Ci)+30nCt (4-6) a
5.
THEORETICAL ANALYSIS OF FINGER
PHOTOPLETHYSMOGRAPHY WITH RING SENSOR
5.1 Background
Real-time, continuous monitoring with the ring sensor allows not only for emergency detection but also for long-term monitoring of otherwise difficult and noncompliant patients such as demented elderly people. However, as a wearable ambulatory sensor, the ring sensor is inevitably subject to measurement noise due to the everyday activities of a patient. In particular, the relative displacement and the rotation of the sensor probe on the finger is a major cause of loss of accuracy, and a common problem for all other photoplethysmographic sensors such as pulse oximeters. The objective of this chapter is to quantify the mechanism of the motion artifact of finger photoplethysmography based on an opto-physiological model of the finger and to facilitate a development of the ring sensor which is less affected by the relative displacement of the finger to the ring.
There have been many attempts to analyze the influence of mechanical interference on the photoplethysmography. Although the experiments and models from those studies help in understanding the principles of finger photoplethysmography, they cannot be directly applied to the case of the ring sensor since they were mostly focused on the analysis of finger photoplethysmography under uniform pressure applied around the finger. In case of the ring sensor, "local pressure" is applied to the finger as the ring moves. Therefore, to deal with the movement of the ring sensor, we need a mathematical model that can explain the photoplethysmography when the finger is under non-uniformly distributed pressure.
In this chapter, we first examine and categorize a variety of movements that influence the photoplethysmographic signals of the ring sensor. To articulate and analyze the influence of each movement, we build a mathematical model of the finger photoplethysmography. The main feature of the model is the integration of multiple domains such as the ring mechanics, finger tissue kinematics, digital arterial wall dynamics and biomechanical optics. In particular, the nonlinear behavior of the arterial wall in response to external pressure, which is the basis of the oscillometric method of blood pressure measurement, is intensively addressed. Also, the optical property of the finger tissue is discussed. The resultant opto-physiological model of the finger and the ring sensor
allows for a simulation of the influence of mechanical displacement of the finger on photoplethysmographic signals. The finite element method is used to verify the tissue model; extensive simulation is conducted and the numerical results are compared with the experimental data for the validation of the model. With this model, the advantage of the isolating ring sensor design is validated with the finite element method.
5.2 Approach
One of the most important issues of wearable sensors is the reduction of noise caused by motion artifacts. Many kinds of motion artifacts, such as fast and vivid motion of the finger, static relative displacement, and rotation of the ring relative to the finger, can interfere with the measurements of the ring sensor. However, since the ring sensor is mainly to be worn by elderly patients and potential patients of cardiovascular disorders, it is reasonable to assume that, of these three things, the static displacement and/or rotation of the ring will predominate over fast movements with large accelerations. For example, if any external static force is applied to the ring so that the center point of the ring deviates from that of the finger, the photoplethysmographic signal will change. The rotation of the ring around the finger will also cause a change in the signal. A mathematical model of the finger and the ring will be very useful in understanding and analyzing the variations of the photoplethysmographic signal due to the displacement and the rotation of the ring. This model has to integrate all of the optical, mechanical and physiological properties of the ring sensor. In other words, the optics of the finger tissue and blood, finger tissue kinematics, geometry of the ring, and dynamics of the arteries and the capillaries must all be incorporated into one model to describe the photoplethysmographic behavior. In particular, the dynamics of the arterial wall should be modeled carefully since the compliance of the arterial wall exhibits nonlinear behavior [11]. The modeling of the optical properties is another point that has to be dealt with very carefully.
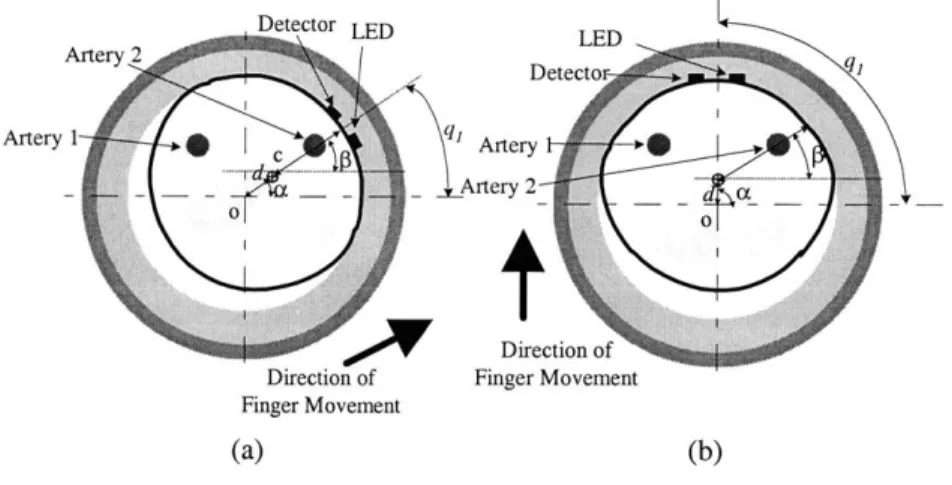
Figure 5-1 shows a cross-sectional view of the finger. The cross section of a finger is assumed to be a circle when there are no external forces. Although there are four digital arteries in the finger, we only describe two proper palmar digital arteries in this model since dorsal digital arteries are located far away from the optical sensor. These two proper palmar digital arteries are both positioned at a distance ho away from the center of the finger. The tissue is considered as a compliant material with stiffness kt. To alleviate the sensitivity of the photoplethysmographic signal variation due to
Uncompressed Finger Finger Compressed with Ring A 2 I Arer
ri=(x,,y,)
Solid Detector L D r2=(X2,Y2)
Digital Digital Rine" artery artery 2 Aty
Tissue
ro Artery T17-,
h Banana Shaped
_ _ --- --- L ight Paths
Reference
bone Bone r() ont
Finger SO
Finger Tissue Compliant
(a) Tissue (Stiffness k,) M(te Light Source Light Detector
(Stiffness k,) (b) (Stiffness kb) ro=(OO) rd=(l,O) Figure 5-1 (a) Uncompressed finger under no external
force (d=O). (b) Finger compressed by the ring due to an Figure 5-2 Optical model of the finger and
external force.(d>O) optical elements. Blood vessels have different
optical properties from the tissue.
movement of the finger, a compliant material of stiffness kb is attached inside the solid ring. A light source (LED) and a photodetector are located on the compliant material inside the solid ring. When any external force is applied to the ring, it moves in a certain direction at an angle a by a certain relative displacement d. Because of this movement, the pressure at the contact point increases and the relative locations of the digital arteries to the optical elements (the LED and photodetector) change, which leads to a variation in the photoplethysmographic signal. At the same time, a deformation of the finger surface occurs and the cross section of the finger is no longer a circle. Due to this deformation of the tissue, the pressure applied to each of the two digital arteries also changes, which results in a change in the volumetric pulsation of the blood vessel. In addition, the volume of the capillaries in the finger cross section also changes due to the change in pressure. The capillaries occlude more easily than the digital arteries since the internal pressure of a capillary is much lower than that of the arteries. In this research, it will be assumed that the tissue consists of two uniformly distributed materials, whole blood and the blood-free tissue, although it is realized that in most tissues the red blood cells are inhomogeneously distributed to some extent [19]. Under this assumption, the tissue's absorption and scattering coefficients can be determined by combinations of the absorption and scattering coefficients of the whole blood and the blood-free tissue depending on the volume fraction of the blood in the tissue. In this context, the average value of the absorption coefficient of human tissue decreases as the blood is squeezed out of the tissue since the absorption coefficient of blood is much higher than that of blood-free tissue. At systole, the volume fraction of the blood in tissue becomes the maximum, while it falls to the minimum at diastole. Meanwhile, the overall volume fraction of blood in the capillaries decreases in the tissue as the external pressure
around the finger increases, resulting in the decrease of the overall absorption coefficient of the tissue. Thus, the occlusion of capillaries is represented as the overall decrease of absorption and scattering coefficients of the tissue. The pulsating signal of photoplethysmograph is caused by the volumetric change of the digital arteries and capillaries due to the change in the blood pressure.
5.3 Modeling
5.3.1 Optical Model
The light emitted from the LED passes into the tissue and the number of the paths of photons is almost infinite, which makes it difficult to obtain a good optical model. The light absorption, multiple scattering, and diffusion processes all occur at the same time. It is known that the average photon migration path in the tissue is a banana shape [20]. Assuming that the tissue is optically homogeneous, the cross section of a finger can be divided into four regions : two digital arteries, capillaries, veins, and all other regions (We will generically call these regions "blood-free tissue"). The blood that flows in the arteries has different optical properties from that which is in the tissue. Looking at the cross section of the finger, it is possible to consider the digital arteries as two circular regions with different optical properties from the surrounding material. Using the analogy with electrostatics, the photon flux density at the detector can be expressed as a function of the positions of the two arteries, the radii of the arteries, the position of the photodetector, and the optical properties of the tissue and the blood. Feng, S., Zeng, F., and Chance, B. derived an analytical formulation of the photon path distributions in the presence of a spherical region with different absorption and scattering properties from the surroundings in semi-infinite geometry [20]. Figure 5-2 shows the geometry of the light source, the photodetector, the arteries and the capillary layer. The light source is in the steady-state condition (constant source intensity of light So) and is located at the origin ro=(OO) of the x-y coordinates. The photon flux density at the detector which is located at
rd=(l,O) is denoted as J. Although the LED and the photodetector are placed along a circular ring surface, it is assumed that they are located on a straight line y=O. This assumption is valid as long as
1 is much smaller than the internal perimeter of the ring. The pulsation of capillaries is counted by
the dynamic change of the optical properties of the tissue surrounding the arteries. Under the assumption that the capillaries are uniformly distributed in the tissue, these optical properties are
determined by the fraction of whole blood in the tissue. Since both the absorption and scattering coefficients of blood are larger than those of blood-free tissue, the combined optical coefficients generally increase at systole, resulting in a decrease of the photon flux density at the photodetector. The blood in the vein also contributes to the variation of the optical coefficients of the tissue. However, it only influences the DC part of the variation since the AC part of the venous pulsation is much smaller than that of the arteries and capillaries. From this insight, the effect of venous blood is included as a DC-level modulation factor of the optical constants of the tissue, and the effect of the volumetric concentration of the veins similar to the arteries is neglected in this model. Consequently, the overall optical constants of the tissue must be determined based on the fractions of blood-free tissue, blood in the capillaries, and blood in the veins.
In an analogy with electrostatics, the arteries are similar to the dielectric material in the electrical field. Noting the presence of two digital arteries which are located at r1=(xi ,yi) and r2=(x2 ,Y2) with
radii of Rrn and Rr2 respectively, the relationship between the light intensity So and the photon flux
density J at the detector is described as follows.
J = 0 + exp(- Kd)+ J,(r,, R,j)+ J,(r2, R,2) (5-1)
where the function J1(r,R) is as follows.
t (Kcf I +l)Ye(Kfc1Or .Ji(r, R)= 2Dq(R) eXp3(- K 0 i (f (5-2) 2Dq(R)[f -E
(r)](lf+
3)y EoY(r)exp( Kf) if I, where r =(x, y), f = r -rd (5-3) (1)0r) oY ' (Kr +±i) (Do(r)=
exp(- kr) (5-4) 2weD jr3 where yo =0.7 lusEo(r)= (Ex, EOY)
y0S0 3Kyr 3yr K y + K yrex(-
|
(55)2rD + r5 r 2 H3 r exp Kr)
q(R) =-R exp(KR? bB(1 - pa I a ) (5-6)
D( + KR)sinh(kR)I(kR)+ DB}
p (R)= R 3 ex p(Kri) bA - DB (5-7 )
DA(1+-KR)+ DB 2+2KR + (KR )} ())
where the coefficients A and B are given respectively,
A = 2sinh
)(R)
- 2 cosh(R)
(5-8)sinhR)R
B = cosh(kR)- inh(R) (5-9)
Pa : Absorption coefficient of tissue (a combination of the absorption coefficients of whole blood
and blood-free tissue : determined by the volume fraction of blood in the tissue)
p,: Transport scattering coefficient of tissue (a combination of the absorption coefficients of whole blood and blood-free tissue : determined by the volume fraction of blood in the tissue)
, : Absorption coefficient of blood
' : Transport scattering coefficient of blood
D: Diffusion constant of tissue (=1113(pa +,Us
5: Diffusion constant of blood
(=1113(ga
+sv :Inverse diffusive absorption distance of tissue
(p
/ D)1/2)k :Jnverse diffusive absorption distance of blood
(a
/ 1)/2)
Detector LED P(O) q.2 "q Solid 4V Material c r RO Compliant Material Stiffness kb (a) (b)
Figure 5-3 (a) Initial state of the ring with LED and photodetector (b) When the finger moves in the ring (Finger tissue is deformed.)
Since the absorption coefficient of blood is larger than that of tissue, the DC value of J increases as the two arteries are located farther from the origin, since more photons reach the detector without passing through the digital arteries. It is also natural that J increases as the radii of the arteries decrease. However, the amplitude of the AC component of J decreases as the distance of the arteries from the origin increases, since the change of the diameters of the arteries (which eventually results in a change of the extent of photon absorption) at distant locations does not influence significantly the photons that reach the detector.
5.3.2 Tissue Mechanical Model
The initial shape of the ring is shown in Figure 5-3(a). The LED and the detector are placed such that their mid-point is at an angle q, (rad) from the horizontal axis, and both the LED and the detector are at an angle q2 (rad) from the radial line that intersects the mid point. As the finger moves inside the ring, the pressure at the contact point increases and both the finger tissue and the compliant material inside the ring go through deformation. This is shown in Figure 5-3(b).
o
is the center of the ring and c is the reference point (the initial center point) of the finger located at the bone. As the reference point of the finger moves by displacement d at an angle a, the distancer (represented as a function of y) from the reference point of the finger to the skin changes from its
initial value ro. At the same time, the compliant material inside the ring also deforms and the distance R (represented as a function of 6) from the center of the ring to the ring inner material also deviates from its initial value Ro. Denoting the pressure at the contact point as P, we can get the force equilibrium equation,