HAL Id: halshs-00562642
https://halshs.archives-ouvertes.fr/halshs-00562642
Preprint submitted on 3 Feb 2011
HAL is a multi-disciplinary open access archive for the deposit and dissemination of sci-entific research documents, whether they are pub-lished or not. The documents may come from teaching and research institutions in France or abroad, or from public or private research centers.
L’archive ouverte pluridisciplinaire HAL, est destinée au dépôt et à la diffusion de documents scientifiques de niveau recherche, publiés ou non, émanant des établissements d’enseignement et de recherche français ou étrangers, des laboratoires publics ou privés.
sectors: measurement, determinants and convergence
towards OECD countries
Mohamed Chaffai, Patrick Plane
To cite this version:
Mohamed Chaffai, Patrick Plane. Total Factor Productivity of Tunisia’s manufacturing sectors: mea-surement, determinants and convergence towards OECD countries. 2011. �halshs-00562642�
Document de travail de la série Etudes et Documents
E 2006.22
Total Factor Productivity of Tunisia’s manufacturing sectors:
measurement, determinants and convergence towards
OECD countries
Mohamed El Arbi Chaffai Patrick Plane
UREP CERDI-CNRS
University of Sfax University of Clermont1
novembre 2006 27 p.
Abstract:
The purpose of this paper is twofold. First, sector-based Total Factor Productivity (TFP) is calculated for six Tunisian manufacturing sectors over the period 1983-2002. Economic determinants of the productive performance are also investigated. In doing so, we take care of the direction of the causality by using a panel data Granger type-test. The recent literature in international economics has placed a particular emphasis on the relation between TFP and variables reflecting the potential impact of both trade and financial openness. Sector-based TFPs proved to be sensitive to some of these variables, highlighting a causality that does not reject the stimulating impact of exports and foreign direct investments. Second, the paper implements some panel data unit root tests to investigate the statistical hypothesis of TFP catching up of Tunisia with OECD members. In benchmarking each of the six Tunisian sectors by those of the most developed countries, panel data unit root tests do not reject the hypothesis of an overall catching- up for five of them.
I. Introduction
In November 1995, the Barcelona Declaration established a global framework geared toward strengthening a multidimensional partnership between the European Union and twelve South and East Mediterranean (SEM) countries, including Tunisia. The main objective of this Declaration is to promote a shared prosperity on both sides of the Mediterranean Sea, mainly through the development of regional trade. The gradual creation of a Free Trade Zone, which is to be finalized before the end of 2010, will be the central instrument in achieving this result. This regional policy remains fully consistent with the principles of multilateral integration in the world economy, as required by WTO membership.
The pace of trade liberalization will depend on the ability of the SEM countries to promote deep structural reforms in their respective manufacturing industries. Indeed, until the beginning of the nineties, SEM manufactured goods benefited from significant unilateral trade advantages in entering the EU markets. The relative scope of these advantages has gradually faded with the extension of similar facilities to eastern European countries which recently joined the European community. In addition, the creation of the Free Trade Zone will rely on the reciprocity rule. This means that the SEM products will have to compete with European goods on their own national markets whereas until now, most of them were sheltered from European exports. Therefore, international competition will increase dramatically on both domestic and traditional export markets, necessitating a greater productive efficiency of manufacturing firms. In the SEM countries, there is reason to believe that the ongoing process should particularly affect Tunisia. In 1999, the industrial sector accounted for 18% of the GDP, the highest percentage in North Africa and the Middle East, after Egypt. Moreover, not only is the EU a traditional selling market for Tunisian exporters, but most manufactured goods are also still highly protected on the national market.1
1
In 1995, when the principles of the partnership were accepted, and ratified in early 1998 by the Association Agreement with the EU (AAEU), 28% of public revenue resulted from import tariffs. The removal of Tunisian trade restrictions is therefore a highly important measure for the government as well as the manufacturing producers. Its macroeconomic and social impacts explain why the public programme of “mise à niveau” was launched.
In this paper we focus on the long-run Total Factor Productivity (TFP) of six Tunisian manufacturing sectors over the period 1983-2002 and investigate the hypothesis of an international convergence process with the productive performance of OECD members. The paper is organised as follows. In section II, TFPs are calculated for food processing (FOOD); electrical and metal products (ELEMET); chemical activities (CHEM); textiles, clothing and leather (TCL); building materials and ceramics (BGC); other manufacturing products (OTHER). Then, TFP levels are regressed on a vector of potential determinants including those reflecting the economic and financial impact of openness. Before running the regression we control for the direction of the causality. Section III is devoted to the analysis of international TFP convergence. Tunisian sectors are then compared with those of OECD members’. The hypothesis of a stochastic convergence is not rejected for five sectors, but proved to be somewhat sensitive to the panel data unit root test as well as the OECD sample we refer to. In section IV, we summarise the results and discuss avenues for further research.
II- Tunisian TFP manufacturing sectors: levels and determinants
II.1 The sector-based evolution of the Total Factor Productivity
For several decades after independence (1956), Tunisia supported an inward-oriented productive industry. In 1970, a first watershed occurred with the provision of fiscal incentives to export activities. Textiles, clothing and leather (TGL) benefited greatly from this policy change, which contributed to strengthening light industry beyond traditional food processing activities. At the beginning of the eighties, the whole manufacturing sector accounted for 15% of the GDP. Over four decades, the structure of the industry changed significantly with an increasing share taken by chemical and textile exports. The relative importance of exports continued to increase, first as a result of the structural adjustment policy (1986) and later, with the Barcelona Declaration (1995). With tariffs on imports being progressively eliminated, international competition gradually increases and forces Tunisian firms to raise the level of their productivity.
The performance of the whole industry can be appreciated both, in the long run and for sub-periods in light of trade policy changes. Over the 1983-1987 period, the effects of the second oil crisis were still being felt. Tunisia faced a severe economic and financial crisis resulting from the decline in oil export earnings and the slowdown in net worker’s remittances (cf. Morrisson
and Talbi, 1986). A more restrictive external trade policy was implemented to cope with the balance of payments crisis and the sharp fall in external reserves. The period 1987-1995 reflects the consequences of the structural adjustment policy and the move toward a more market-friendly economy. During this period, Tunisia joined the GATT (1990), became a founding member of the World Trade Organization (WTO) and adopted current account convertibility (1993). Besides the multilateral approach to trade policy, the Euro-Mediterranean partnership also developed and was institutionalized through the Barcelona Declaration (1995). The last sub-period (1995-2000) reflects the gradual preparation for the establishment of the Free Trade Agreement and the strengthening of competition on both domestic and external markets.
For each of the six sectors, Total Factor Productivity, (TFP) has been measured by considering the value added at constant market prices. Production technology is defined assuming constant returns to scale with two primary inputs: the number of permanent employees (L) and the capital stock (K). With regard to the labour force, the data for the number of hours worked is not available. However, although the labour market became more flexible over the entire period, public regulations for hours worked did not change. Thus, we can reasonably assume that TFP is not biased when using the number of employees. The capital stock has been calculated, at constant prices, using the perpetual-inventory method for annual investment flows. As we refer to aggregate data with no information about the composition of the capital stock, two average annual depreciation rates have been considered: 5% and 10%.2 The stock has been constructed as follows, with (t) denoting the end of year.
Kt = It + (1-δ) Kt-1 (1)
When measuring productivity, one assumes constant returns to scale and remuneration of production factors at their marginal product. As the relative contribution of the labour force (α) was calculated by considering the share of wages in the sector value added, we infer the capital share (1-α).
=
α (1−α) t t tK
L
Q
TFP
t (2) 2In his analysis of Chilean trade liberalization and its aftermath, James Tybout (1996) retains different depreciation rates: 5% for building, 10% for machinery and 20% for vehicles.
There is an extensive literature discussing the advantages and disadvantages of using growth accounting techniques to estimate TFP. The non-parametric procedure is preferred for it better serves our purpose of identifying TFP level determinants. Indeed, in adopting this method we do not have to face the simultaneous equation problem resulting from the endogeneity of inputs. We do not have to estimate the input elasticities by regression techniques, but derive them from the observed cost shares. Therefore the non-parametric procedure allows us to analyse the TFP effects of the variables reflecting openness in two steps. In the first step we generate the “Solow residuals” while in the second step, we use a regression analysis to evaluate TFP determinants.
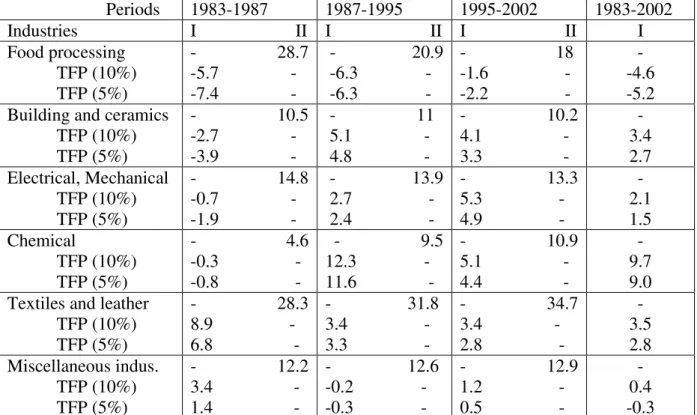
In Table 1, we present the TFP growth rates over the entire period and relevant sub-periods under the two above-mentioned hypotheses regarding the depreciation rate of the capital stock. TFP does not prove to be very sensitive to these rates, especially after 1987. Therefore, in the rest of the paper we will only use the 5% depreciation rate. For three sectors: electrical and mechanical (ELEMET), building and ceramics (BGC), textiles and leather (TCL), the long-run annual average rate of TFP growth, ranges between 1.5% for electrical and mechanical activities and 3.5% for textiles and leather over the period 1983-2002. The evolution is somewhat different for the two other sectors. After 1987, TFP strongly increases in the chemical industry (CHEM), by about 9% per year. In the food sector (FOOD), TFP falls sharply, with some deceleration over the 1995-2002 period. Understanding this empirical evolution would require a sub-sector-based analysis with disaggregated data, which unfortunately are unavailable3. A simple breakdown of TFP gains and losses according to the growth of the respective value added and input use shows that the change in inputs has been the prevailing determinant.
3
In an applied study of 21manufacturing industries from 16 OECD countries over the 1971-1994 period, Funk and Strauss (2003) have highlighted a high level of international heterogeneity in the sectoral productivities. The average growth rate of TFP is about 1.35% and 1.14% for iron and steel, and non-ferrous metals, respectively. For the same sectors, the maximum growth rate is 11.5% and 9.9% while the minimum stands at -0.07 and -0.15
Table 1: Sector-based TFP growth and the relative share of the Tunisian manufacturing sectors 1983-2002 period (%)
Periods 1983-1987 1987-1995 1995-2002 1983-2002 Industries I II I II I II I Food processing TFP (10%) TFP (5%) - 28.7 -5.7 - -7.4 - - 20.9 -6.3 - -6.3 - - 18 -1.6 - -2.2 - - -4.6 -5.2 Building and ceramics
TFP (10%) TFP (5%) - 10.5 -2.7 - -3.9 - - 11 5.1 - 4.8 - - 10.2 4.1 - 3.3 - - 3.4 2.7 Electrical, Mechanical TFP (10%) TFP (5%) - 14.8 -0.7 - -1.9 - - 13.9 2.7 - 2.4 - - 13.3 5.3 - 4.9 - - 2.1 1.5 Chemical TFP (10%) TFP (5%) - 4.6 -0.3 - -0.8 - - 9.5 12.3 - 11.6 - - 10.9 5.1 - 4.4 - - 9.7 9.0 Textiles and leather
TFP (10%) TFP (5%) - 28.3 8.9 - 6.8 - - 31.8 3.4 - 3.3 - - 34.7 3.4 - 2.8 - - 3.5 2.8 Miscellaneous indus. TFP (10%) TFP (5%) - 12.2 3.4 - 1.4 - - 12.6 -0.2 - -0.3 - - 12.9 1.2 - 0.5 - - 0.4 -0.3
I: Annual average growth rate of TFP for each period. Figures refer to two different depreciation rates of the capital stock, 10% and 5%, respectively; II: Relative share of the sector-based value added over the period for all Tunisian manufactured goods.
Except for TCL and miscellaneous manufacturing industries, which exhibit a good productive performance, the 1983-1987 sub-period is characterized by negative sector growth rates. This poor performance results from difficulties in adjusting inputs in an adverse macroeconomic context. Cumbersome regulations governing the labour market hampered the rapid restructuring of enterprises whilst some of them also had to manage the overinvestment of the previous period. Thus, TFP suffers from the under-utilisation of productive capacities. The next sub-period, stretching from 1987 to 1995, was much more favourable. The macroeconomic recovery as well as the combination of trade openness and local deregulations contributed to a more efficient management of inputs. Firms benefited 4 from the previous investments and were able to expand their production without a proportional increase in inputs.
4
Textiles, clothing and leather account for nearly 35% of the manufacturing value added and the economic health of
this sector is crucial for thousands of Tunisian workers. Its future will be narrowly conditioned by the ability of local producers to overcome the impact of foreign competition and its implications in terms of international prices and costs.
In the last sub-period, the TFP growth rate slows down in the chemical industry and does not significantly differ from the growth rates of other manufacturing sectors. For textiles, clothing and leather, although the value added growth remained dynamic, about 5% a year, the growth of the sectoral TFP was far lower than the highest values reached in the eighties. The relative stability of the real exchange rate has contributed to the present difficulties of firms in managing the end of the multifiber agreement (2005). The long run productive performance of Tunisian industries turns to be heterogeneous across sectors and sub-periods. Some manufacturing activities such as food processing industries experience a decline while others strengthen their position and contribute to modify the national production structure.
II.2 The econometric determinants of TFP levels
In this overview of potential TFP determinants, a special interest is given to the variables reflecting trade and financial openness. In analyzing both the level and the growth of productivity, the recent empirical literature has given a great importance to this dimension. If empirical studies generally provide evidence of a positive correlation between trade/financial openness and productivity performance (see Dollar, 1992; Ben David, 1993; Sachs and Warner, 1995; Edwards, 1998) there are some “prominent trade liberalisation sceptics” (cf., Edwards, 1998)5. Rodriguez and Rodrik (1999) point to the hotly debated methodological issue of identifying the direction of the causality6. Do exports enhance productivity or is productivity a prerequisite for a high external trade performance? Indeed, TFP can result from a learning-by-exporting effect, but also from a self-selection effect, learning-by-exporting firms or sectors then being those having the best initial TFP performance (see Haddad, de Melo and Horton, 1996). In view of the above comments, the subsection is divided as follows. First, we discuss the potential determinants of TFP levels. An analysis based on productivity growth rates would be more general, but it has the disadvantage of being much more demanding in terms of data quality. Then we deal with the causality problem and explore the impact of the exogenous variables through a multiple regression analysis7.
5
In his review of prominent trade liberalisation sceptics, Sebastian Edwards includes Krugman (1994) and Rodrik (1995)
6
See Edwards (1993) for a survey
7
Other potential variables would deserve interest such as the level of human capital or the quality of institutions. They are not considered in this paper because of data limitations. We assume that this does not create an omitted variable bias.
TFP and its potential determinants
The level of exports (EX) can be considered as a first relevant trade variable. Indeed, competition on foreign markets provides a strong stimulus for promoting economic efficiency. In the case of Tunisia, the integration of the country into the world economy entails a progressive loss of the preferential advantages that the European Union has granted for decades. Europe remains by far the main exporting market for Tunisian manufacturing goods. Avoiding the “trade diversion” effect that may result from the stretching of the EU8 requires greater productive efforts by firms. The sector-based net exports (NEX) can also be considered as a proxy of the Tunisian comparative advantage. This other indicator is defined as the ratio of the difference between exports and imports to the sector-based value added. A causality problem can be reasonably suspected for those two trade variables. The risk also applies to the effective rates of protection (ERP). Until the beginning of the eighties, numerous authors agreed that developing countries had to protect their infant industry9. This theoretical argument suffers from the detrimental effects of protectionism, such as the risk of perpetuating X-inefficiency with domestic costs keeping above internationally competitive levels10. Thus, high unit costs, and consequently low TFP levels, might be correlated with ERP. But if the Euro-Mediterranean Free Trade Agreement (FTA) stimulates productivity by providing a clear signal that there will be no protection behind which to shelter, the rhythm of the tariff removal can be predetermined by the ability to achieve higher productivity.
The economic environment also matters through the domestic demand in the manufacturing sectors. Here, domestic demand is defined as the current output augmented by imports minus exports (DEM). A slowdown in domestic demand represents a real challenge for producers, who have to redeploy their activities in order to compete on external markets. The impact of this variable is potentially difficult to differentiate from the previous one. Thus, the greater the level of trade protection is, the stronger will be the firm’s vulnerability to the swings of domestic demand. Also, DEM can be seen as correlated with unobservable variables such as the under-utilisation of the capital stock, which cannot be rapidly adjusted downward, as well as with labour regulations, which slow down the speed of adjustment of the workforce to the optimal level.
8
Let us recall that the integration process of the new eastern European countries was completed in 2004.
9
This is the best known argument, reasoning in favour of temporary protection until the “infants” have learned to stand on their own feet, becoming internationally competitive without any state support.
How can we assess the impact of international price competition on TFP? Tunisia is a “world price-taker”. This exogenous constraint bears on local costs and, then, on the behaviour of firms as regard TFP levels. Forty-eight real effective exchange rates, henceforth referred to as REERs, have been calculated over the 1983-2002 period, one for each of the three-digit industries (j) as defined by the Standard International Trade Classification (SITC). For a j-industry, the world price being given, the REER allows to take into account the differential of cost evolution across competing partners. Under the assumption that the law of one-price holds, a long run deviation in the REER (i.e. appreciation) constitutes a potential loss of the Tunisian competitiveness and an incentive to raise TFP levels. Six sector-based geometric averages of the REERs have been calculated from the forty-eight relevant 3-digit groups, one for each of the manufacturing sectors we refer to in this paper. Each of the three digit level industries (j) has been weighted by its respective contribution to the value added of the sector, q industries being considered. In measuring REERs, the consumption price index (CPI) has been used for the ten largest world exporters (i) of the j-industry. The weight given to each partner was based on its average contribution to exports over the period 1999-2002. In the formula that follows (3), NERs are the nominal exchange rates of the Dinar vis-à-vis the currencies of those ten exporters (i).
10 1 1 qj pi q ij i i j i
CPI
REER
NER
CPI
= = =
∏ ∏
×
(3)For fifteen years, the Tunisian authorities have targeted a stable “macroeconomic” real effective exchange rate by periodically adjusting the nominal rate. The Dinar is pegged to a basket made up of the currencies of the main economic partners, with a prominent role given to the euro. This exchange rate policy has been quite successful in terms of promoting macroeconomic stability. The inflation rate has remained low, close to the rate of the European economies, with the changes in the nominal exchange rate offsetting price differentials. However, this policy did not take into account the specific sectoral constraints of the trade liberalization program. Therefore, some of the manufacturing sectors had to compensate for the loss of price competitiveness by a higher TFP.
10
As regard financial openness, the common wisdom suggests that Foreign Direct Investment (FDI) facilitates productivity gains and the integration into the world economy by several channels. The enduring presence of foreign enterprises provides easier access to efficient technologies and organizational methods. In comparison with standard financial debt, FDI incorporates both human and organizational know-how. It allows saving on the fixed costs of producing technological innovations as well as on the marginal cost of their replication in the domestic environment. FDI also contributes to lowering the transaction costs of penetrating external markets. A capital stock ratio of FDI has been constructed for each of the six manufacturing sectors we are interested in. Inflows have been summed since 1980 with the same yearly depreciation rates as those used for the calculation of the sector-based capital stock (10%, 5%).
Another variable has been introduced to capture reallocation effects within each of the six industries. Bernard and Jones (1996 b) have shown that these reallocations (or share effect) accounted for 4% of the aggregate TFP growth of OECD countries over the 1970-1987 period11. As we work on aggregated data, similar redistributions of the sector-based value added, hereafter referred to as STRUC, may occur with a non-neutral impact on the evolution of TFPs. This composition effect is measured on a yearly basis by the sector-based average of the 3 digit level absolute differences in value added shares (3):
, , 1 , 1 , , 1 1 1 1 k k k J j t j t k t J J j k j t j t j j Q Q STRUC J Q Q − = − = = =
∑
−∑
∑
(4)where
Q
j,tis the value added of the j-th-industry and Jkthe total number of industries inthe k-th-manufacturing sector. STRUC values range between 0 (no structural change within the sector) and 1 (full change). In contrast with other approaches to the share effect, we consider that STRUC captures the impact of a short term or a spontaneous reallocation effect. STRUC reflects the aggregated dimension of the data set and not a specialisation or a long run supply reallocation effect. Therefore, the sign of the regression coefficient is not predetermined.
The dynamic panel and the issue of causality
The analysis of the potential determinants of openness has suggested that we should control for the direction of causality between variables. The Granger-causality test (1969) is commonly used. As long time series are not available here, we consider a panel causality test as follows. We suppose that X fails to Granger cause Y if in the regression of Y on its lagged variables and X, the coefficients δj associated with Xt-j in (5) are not significant12. The unobservable heterogeneity over the six manufacturing sectors will be controlled for through the introduction of fixed effects.
,
i
1,..
N;
t
p
1
,...
T
1 , 1 , 0 ,=
+
+
∑+
=
=
+
= − ∑ = − i t n j j it j m j j it j i t iY
X
Y
β
β
δ
ε
(5)The lag pattern of the variables has to be identified through a specification test13. Equation (5) is a general dynamic panel data model. Lagged dependent variables tend to generate biased and non consistent estimators when the within or the ordinary least squares methods are used. An appropriate way to overcome this problem consists in taking the first difference of the equation in order to remove the fixed effect and then resorting to the consistent Generalized Method of Moments estimator (GMM). The error terms ∆εi,t in the differentiated equation are
correlated with the independent variables∆Yi,t−j. Therefore, the latter need to be instrumented by
a suitable set of lagged endogenous variables expressed in levels (Yit−j'), or in differences (∆Yi,t−j')14. The causality test from X to Y will consist in testing the null hypothesis of the coefficients in (4) :
δ
1=
δ
2=
....
=
δ
n=
0
. The statistic of the test asymptotically follows a Chi-square distribution with n degrees of freedom. As the time series are short, the simplest version of the panel causality test has been performed. In equation (5), the slope coefficients are assumed11 The Bernard and Jones(1996b) method consists in decomposing the productivity growth into a pure productivity
growth effect and a share effect by using an accounting framework (RES,1996 p140)
12
We use the easiest presentation of the causality test on panel data. A more complex analysis, as in Nair-Reichert and Weinhold (2001), would be to hypothesise thatβj and δj are specific to individuals in (3), here the sectors.
13 We use the sequential method starting with 3 lag lengths for both variables. 14
to be the same across the sectors. This hypothesis can potentially affect the validity of our results if there are disparities across sectors15. The results of the empirical analysis are given in Table 2.
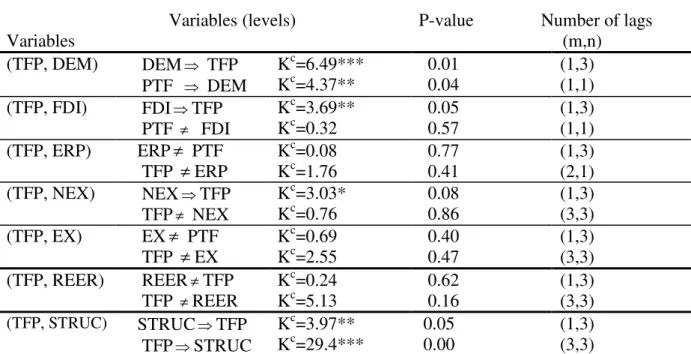
Table 2: Results of the panel data Granger causality test: GMM estimation method (1983-2002)
Variables
Variables (levels) P-value Number of lags (m,n) (TFP, DEM) DEM⇒ TFP PTF ⇒ DEM Kc=6.49*** Kc=4.37** 0.01 0.04 (1,3) (1,1) (TFP, FDI) FDI⇒TFP PTF ≠ FDI Kc=3.69** Kc=0.32 0.05 0.57 (1,3) (1,1) (TFP, ERP) ERP ≠ PTF TFP ≠ ERP Kc=0.08 Kc=1.76 0.77 0.41 (1,3) (2,1) (TFP, NEX) NEX⇒TFP TFP≠ NEX Kc=3.03* Kc=0.76 0.08 0.86 (1,3) (3,3) (TFP, EX) EX ≠ PTF TFP ≠ EX Kc=0.69 Kc=2.55 0.40 0.47 (1,3) (3,3) (TFP, REER) REER≠TFP TFP ≠REER Kc=0.24 Kc=5.13 0.62 0.16 (1,3) (3,3) (TFP, STRUC) STRUC⇒TFP TFP⇒STRUC Kc=3.97** Kc=29.4*** 0.05 0.00 (1,3) (3,3)
The symbol “X ⇒Y” indicates the direction of the Granger causality. The symbol “X≠Y”, means that there is no causality from X to Y. ***, **,* denote significance levels 1%, 5% and 10%, respectively.
A unidirectional causality is evidenced for Foreign Direct Investment (FDI) and net export (NEX) with past values of these variables explaining the present sector-based TFP levels. A bidirectional impact is found for both domestic demand (DEM) and structure (STRUC). This last result suggests a potential endogeneity risk while considering TFP determinants. For ERP, EX and REER, the Granger causality test did not prove to be statistically significant.
The TFP determinants: the regression analysis
Policy during the period 1990-2002 was more focused on trade openness than the previous one16. Tunisia joined the GATT in 1990, became a founding member of the World Trade Organisation (WTO) and initiated current account convertibility in 1993. The
15
In that particular case, it would be less restrictive to replace these slopes by sector specific coefficients, see Hurlin and Venet (2001) for a good discussion of this problem of heterogeneity.
16 A predictive test for stability of the coefficients over the whole period, not reported here, has been carried out. The
stability hypothesis was rejected. 1990 proved to be the relevant year for the structural break. Different subsets were considered with 1991, 1992, 1993 and 1994, as alternative cut-off years.
Mediterranean partnership also took shape and was institutionalized through the Barcelona Declaration. For the aforementioned reasons, we have checked for the stability of the TFP model coefficients and rejected this hypothesis by comparing the 1983-89 and the post WTO integration period (1990-2002), through a Chow test. The results with the within estimator are reported in table 3. On the left hand side of this table, the explanatory variables are considered as predetermined. On the right hand side, STRUC and DEM have been instrumented to control for the potential endogeneity bias that was detected by the causality test pertaining to the whole period (table 2). Lagged values for the composition (STRUC) as well as the level of the domestic demand (DEM), net exports (NEX), imports (IMP), and the effective rate of protection (ERP) have been used as instruments. The over-identification p-value of the Hansen J-statistic did no reject, at the 5% level, the relevance of these instruments.
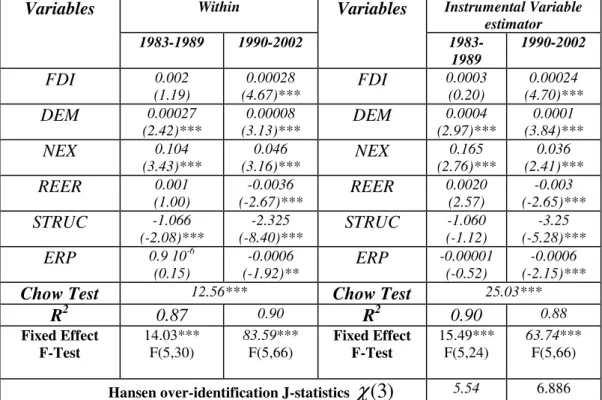
Table 3: Tunisian manufacturing sectors and TFP level determinants
(1983-2002)
Within Instrumental Variable estimator Variables 1983-1989 1990-2002 Variables 1983-1989 1990-2002 FDI 0.002 (1.19) 0.00028 (4.67)*** FDI 0.0003 (0.20) 0.00024 (4.70)*** DEM 0.00027 (2.42)*** 0.00008 (3.13)*** DEM 0.0004 (2.97)*** 0.0001 (3.84)*** NEX 0.104 (3.43)*** 0.046 (3.16)*** NEX 0.165 (2.76)*** 0.036 (2.41)*** REER 0.001 (1.00) -0.0036 (-2.67)*** REER 0.0020 (2.57) -0.003 (-2.65)*** STRUC -1.066 (-2.08)*** -2.325 (-8.40)*** STRUC -1.060 (-1.12) -3.25 (-5.28)*** ERP 0.9 10-6 (0.15) -0.0006 (-1.92)** ERP -0.00001 (-0.52) -0.0006 (-2.15)***
Chow Test 12.56*** Chow Test 25.03***
R2 0.87 0.90 R2 0.90 0.88 Fixed Effect F-Test 14.03*** F(5,30) 83.59*** F(5,66) Fixed Effect F-Test 15.49*** F(5,24) 63.74*** F(5,66)
Hansen over-identification J-statistics
χ
(
3
)
5.54 6.886Numbers in brackets are the t-statistics at the following significant levels of confidence: (*) 90%; (**) 95 %; (***) 99 %. The sectoral fixed effects are not reported in this table.
The explanatory power of the estimated models is quite good (table 3). The variance of the TFP level is explained from 90% for the first sub-period to 88% for the second one (1990-02), with the instrumental variable estimator. The fixed effects F-test do not reject the presence of a strong intersectoral heterogeneity. From the regression coefficients we observe that until 1990,
the net export (NEX), the domestic demand (DEM) are the only variables statistically significant at the 99% level of confidence. The second sub-period is marked by a better econometric fit, all coefficients proved significant with a clear impact of the variables capturing the openness strategy in both trade and financial dimensions. It is worth mentioning that the FDI effect turned to be significant in the second sub period at a time when FDI inflows greatly increased as a result of the privatisation policy pursued in several sectors. This positive impact supports the recent Tunisian policy target to raise foreign capital inflows at a yearly rate of 10%.
As regard the relative price indicators, some significant changes occurred between the first and the second sub-period. The coefficient of the real exchange rates (REERs) is negative and suggests that price competitiveness played against sector-based TFP gains. The effective rates of protection display a negative impact on TFPs. This result is consistent with John Hicks’ remark about protected firms enjoying a “quiet life” leading to X-inefficiency. Therefore the dynamic of the trade liberalisation policy should and proves to be a stimulating force for increasing productivity levels. Over the whole manufacturing sector, the average ERP decreased from 194% in 1983 to 85% in 1990 and 56% in 2002. Finally, STRUC is negatively correlated to TFP and mainly reflects the intra-sector based heterogeneity as discussed above.
III. Tunisian sectors and the international TFP convergence hypothesis
III. 1: The convergence hypothesis revisited
In this section we want to highlight the TFP performance of Tunisia vis-à-vis those of OECD countries. In other words, did Tunisian manufacturing firms converge toward the best international standards over the 1983-02 period? To answer this question panel data unit root tests are used to evaluate convergence between Tunisia and a sample of 11 OECD countries. In the Solow-type economic growth model, the international convergence of per capita GDPs is assumed to result from the diminishing returns to individual factors. The smaller the per capita capital stock is, the higher will be its marginal efficiency. In developing countries, economic and financial openness modifies the relative endowments of capital and labor, allowing the import of the most efficient technology available on the market. The long-run dynamics should therefore support the international productivity convergence hypothesis.
However, there are some restrictive assumptions underlying the international productivity convergence and, to some extent, the sector-based convergence arguments. Indeed, in a context of increased integration into the world economy, the process of trade specialization may exclude the possibility of a long-run international convergence of productivities for all sectors. In addition, the progress characterizing the technology is neither exogenous nor the same worldwide. OECD countries have a high rate of innovation. For manufacturing activities, they can be seen as leaders while developing countries are only followers seeking to replicate innovations based on their own human and institutional abilities. If FDI contributes to the international diffusion of the appropriate production technology, some differences inevitably remain, partly connected with non-transferable cognitive apprenticeships. Efficient static and dynamic routines are firms’ core competencies in industrialized countries. In a situation where skills are idiosyncratic and non-transferable, TFP can be higher and production costs lower in OECD countries.
III.2 Unit root tests and convergence
The empirical literature on productivity convergence can be decomposed in two categories. The first category is based on cross-sectional data and uses the Sigma or the Beta convergence tests. The second category explores the time series properties of the data and refers to stochastic convergence tests. According to Bernard and Jones (1996b), stochastic convergence implies that sectoral TFP differentials between countries are stationary. The econometric methodology based on the unit root tests is resorted to in this study. For each of the six sectors, we test for stochastic convergence between Tunisian TFP and those of an OECD country sample. Let
Y
tbe the TFP level of a specific Tunisian industry andY
t* the TFP level of one OECD country considered as the benchmark. Testing for convergence consists in conducting the following simple unit root test.)
ln
(ln
)
ln
(ln
)
ln
(ln
1 * 1 * 1 * t p j j t j t j t t t tY
Y
Y
Y
Y
u
Y
−
=
+
−
+
∆
−
+
∆
∑ = − − − −φ
ρ
µ
(6)If the difference in log TFPs is non stationary (
ρ
=
0
), the TFP series between the two countries diverge, suggesting a persistent TFP shock. On the other hand if the gap isstationary
ρ
<
0
, the technology shocks are not persistent, and we conclude for a convergence process. Equation (6) is the standard regression equation for the augmented Dickey Fuller test, (ADF). Any univariate unit-root test on this equation helps to test for stochastic convergence. This methodology has been used by Harris and Trainor (1999) to investigate regional convergence within UK over the 1963-92 period17.Although this methodology allows identifying the country pairs for which there is bilateral convergence, long time series are required in order to avoid the low power of univariate unit-root tests. To increase this power, Bernard and Jones (1996 b) have suggested running panel unit root tests on a sample of OECD countries. The test is based on following the regression equation:
)
ln
(ln
)
ln
(ln
)
ln
(ln
1 * 1 * 1 * it p j j it j t j t it i i t itY
Y
Y
Y
Y
u
Y
−
=
+
−
+
∆
−
+
∆
∑ = − − − −φ
ρ
µ
(7) * itY
represents the TFP of each of the 11 OECD countries, whileY
t is the TFP of the Tunisian sector. Appendix 1 reports the TFP differentials by industry.Over the last ten years, the empirical literature analyzing international TFP convergence has significantly stretched. To limit the references to some of the most influential works, let us mention Bernard and Jones (1996 b)’s pioneering paper on a sample of 14 OECD countries over the 1970-87 period. Stochastic convergence is tested by using a Levin and Lin (1992) type-test imposing the same autoregressive coefficient in equation (7):
ρ
i=
ρ
. Martin and Mitra (2001) referred to a similar test to investigate the phenomenon in agriculture and manufacturing over the period 1967-92, based on sample of 50 countries. Freeman et Yerger [2001] applied the Maddala and Wu (MW)’s test to evaluate the labour productivity convergence in the manufacturing sector of 8 OECD countries from 1950 to 1998, while Mukherjee and Kuroda [2002, 2003] have considered the productivity convergence of the agricultural sector in 14 Indian regions (1973-93) by adopting several panel data unit root tests18. Finally, lets us mention the recent paper by Funk and Strauss (2003) who resorted to the IPS test to analyse the TFP convergence of 21 industries in 16 OECD countries (1971-94).
17 These authors also extend the unit root test by adding the trend component in equation (4) and by controlling for
structural break.
18 Let us mention Levin and Lin’s, Im, Pesaran and Shin (1997, 2003)’s (IPS), Harris and Tzavalis (1999)’s, Hadri
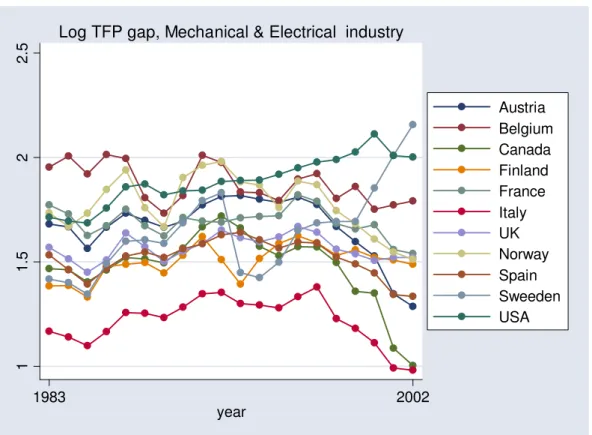
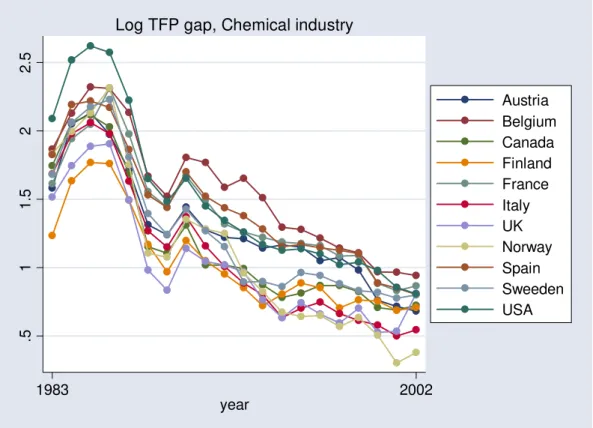
In this paper, we test for sector-based stochastic TFP convergence between the Tunisian sectors and a sample of 11 OECD countries over the period 1983-02. Using the aforementioned methodology, we test the stationarity of the log TFP gap. The OECD benchmark countries are: Austria, Belgium, Canada, Finland, France, Italy, the UK, Norway, Spain, Sweden and the USA. On the basis of equation (7), two standard panel data unit root tests (IPS, MW) are performed. For both tests, the null hypothesis means:
ρ
1=
ρ
2=
...
=
ρ
11=
0
. Rejecting the null suggests a convergence process and implies the stationarity of the Tunisian TFP gap with a subset or at least one OECD country. The specification of the test does not impose the equality of the autoregressive coefficientsρ
i=
ρ
19, that is, a converging process at a common rate with respect to all these countries.The IPS statistics used is the so-called t-bar statistics defined by:
) 1 , 0 ( ) ( )) ( ( N t Var t E t N IPS= − → (8) where =
∑
i c i t Nt (1/ ) , tic is the Dickey-Fuller unit root statistic which is specific to each
country (i). The t -statistic follows a normal distribution with unknown mean, E (t), and variance, Var (t ). These values can be either simulated or obtained from Im et al (1997, 2003)’s tables. The MW statistic combines the observed significance levels associated to the individual ADF. Presuming cross-sectional independence, pi denoting the p-value from the Dickey Fuller test on the ith time series, MW statistic follows a Chi-square distribution:
∑
= → − = N i Ln N MW 1 (pi) (2 ) 2κ
(9)Simulation experiments are carried out to obtain the p-values derived from the empirical distribution of the test. Moreover, for both tests we assume that one lag length is sufficient to remove serial correlation for each country-pair of the panel20. Table 4 reports the IPS and the
19 In this particular case, we can employ the Levin and Lin (1993) test.
20 As the time series dimension is limited, we did not conduct the usual strategies (sequential method, AIC
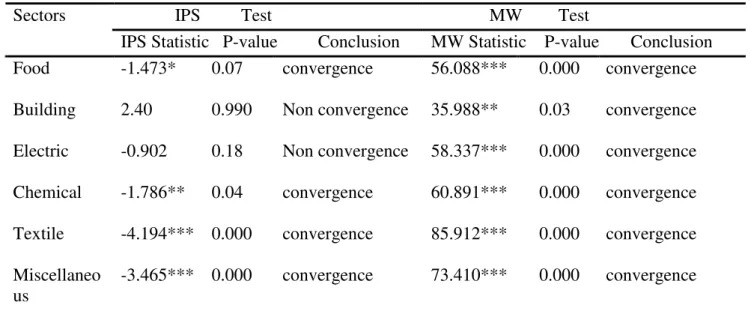
MW statistics with their respective p-values. According to the MW test, we can reject the null that sector-based TFP differentials have a unit root and conclude that there is an overall convergence for the six sectors. For two of them, Building, Electrical and Mechanical activities, the IPS test does not reject the null hypothesis that all the series are stationary, suggesting an overall divergence. Due to the limited dimension of the panel dataset, the heterogeneity of the autoregressive coefficients could affect these empirical results. Conclusions derived from the two tests may be sensitive to a mixture of stationary and non stationary series. In other words, Tunisian sectors may experience a long-term convergence process with some OECD countries and in a divergence process with others. To appraise this potential sensitivity, the two tests have been rerun by dropping 3 countries from the 11 OECD-sample, one by one, according to the lowest individual ADF test values. That way, the benchmark countries to which Tunisian sectors are likely to converge have been dropped sequentially.
Table 4: Tunisia and the international TFP stochastic convergence tests
IPS Test MW TestSectors
IPS Statistic P-value Conclusion MW Statistic P-value Conclusion Food Building Electric Chemical Textile Miscellaneo us -1.473* 2.40 -0.902 -1.786** -4.194*** -3.465*** 0.07 0.990 0.18 0.04 0.000 0.000 convergence Non convergence Non convergence convergence convergence convergence 56.088*** 35.988** 58.337*** 60.891*** 85.912*** 73.410*** 0.000 0.03 0.000 0.000 0.000 0.000 convergence convergence convergence convergence convergence convergence
N.B: These calculations have been made by considering the 5% capital depreciation rate. The exact denomination of sectors is: Food processing, Building and ceramics, electrical and mechanical, textile and leather, miscellaneous
Results of the sensitivity are reported in table 5. As regard the building industry and according to the MW test, the convergence evidenced in table 4 is now rejected with the elimination of only one country. Conclusions remain unchanged for the other five sectors. Conversely, the IPS test shows a stronger sensitivity to the subtraction of countries. Let us observe that the convergence process vanishes when dropping one country for Food industry, two countries for Textile, garment and leather, but also for miscellaneous industries, and three
countries for Chemical activities. Therefore, not only a mixture of stationary and non-stationary TFP gaps does exist, but the IPS test also proves to be more sensitive to the sample heterogeneity of the TFP differentials than the MW test.
Table 5: Unit root test sensitivity to the exclusion of some OECD countries
Sectors
IPS Statistic P-value MW Statistic P-value Sub-sample Food Building Electric Chemical Textile Miscellan eous -1.323 -0.844 -0.546 3.918 3.995 3.982 -0.241 0.397 1.023 -1.534* -1.281* -1.005 -1.475* 0.285 1.486 -2.050** -1.212 -0.795 0.13 0.20 0.29 1.00 1.00 1.00 0.41 0.65 0.85 0.06 0.10 0.16 0.07 0.61 0.93 0.02 0.11 0.21 48.937*** 42.474*** 36.162*** 18.953 15.712 13.060 47.741*** 37.873*** 28.890** 53.975*** 47.236*** 40.520*** 62.887*** 39.861*** 26.045* 57.186*** 45.568*** 37.907*** 0.00 0.00 0.00 0.53 0.61 0.67 0.00 0.00 0.02 0.00 0.00 0.00 0.00 0.00 0.05 0.00 0.00 0.00 10 countries 9 countries 8 countries 10 countries 9 countries 8 countries 10 countries 9 countries 8 countries 10 countries 9 countries 8 countries 10 countries 9 countries 8 countries 10 countries 9 countries 8 countries
N.B: The exact denomination of sectors is: Food processing, Building and ceramics, electrical and mechanical, textile and leather, miscellaneous
The results of panel data unit root stationary tests have to be interpreted with caution, especially when the individual dimension is limited as it is the case in this work. When we reject the null hypothesis, it does not mean that Tunisian sectors are in a convergence process with the whole OECD country sample. A TFP convergence process may exist within a restricted sub-sample. The sensitivity analysis conducted by considering sub-panels has shed some light on this problem. Beyond this limitation and its potential implication for the statistical inference, the two standard unit root type tests have given some support to the existence of an overall TFP convergence process for five sectors.
IV Conclusion
In this paper, we addressed two issues regarding the productive performance of the Tunisian manufacturing industry. First, we focused on measuring sector-based TFP levels and analyzing their economic determinants over the 1983-02 period. Causality relationships between identified determinants sectoral TFPs were assessed using panel data Granger causality type test. The GMM estimator has been used to conduct this test in order to take into account the potential endogeneity bias resulting from the dynamic specification of regressions. Over the first sub-period (1983-1989), domestic demand and net exports were found to have a significant impact on TFP levels. Over the second sub-period (1990-2002) all the coefficients of the reduced form proved to be statistically significant, including the variables reflecting trade and financial openness, as measured by the effective rate of protection and the Foreign Direct Investment flows, respectively.
The second empirical objective of this paper was to use the international TFP comparison for assessing the potential convergence of Tunisian sectors toward the productive performance of a sample of 11 OECD countries. Trade liberalisation goes along with increased specialization. In this context, international convergence is far to be a trivial process although developing economies have an economic interest in adopting the best OECD productive practice. The IPS and the MW panel data unit root tests were used by considering the country TFP differentials. Empirical results suggest a stationary process for five sectors, therefore supporting the assumption of a long run convergence. On the contrary, a divergence process was found for building and ceramics industries.
Empirical results are subject to some refinements. Specifically, for improving the power of the panel data unit root tests but not only, it would worth reconsidering convergence by using more disaggregated data. The three-digit industry level would deserve a particular attention, allowing a better understanding of the intra-sectoral heterogeneity. Given the sector, in line with the trade specialization argument we referred to, Tunisia should improve its TFP level in manufacturing activities offering the best export opportunities while leaving others. Although detailed information is lacking for carrying out such an empirical analysis, it remains a stimulating question for further research. It would also be interesting to extend the sample to
some large countries such as China or India. Both have a wide range of common specialisations with the Tunisian manufacturing industries and are becoming major rivals in world markets.
Appendix 1
Figure 2: TFP Evolution in Food Processing Industries, by Country
.5 1 1 .5 2 2 .5 1983 2002 year Austria Belgium Canada Finland France Italy UK Norway Spain Sweeden USA
Figure 3: TFP Evolution in Building Materials and Ceramic Industries, by Country
.5 1 1 .5 2 2 .5 1983 2002 year Austria Belgium Canada Finland France Italy UK Norway Spain Sweeden USALog TFP gap, Building & Ceramics industry
Figure 4: TFP Evolution in Electrical and Metallic Industries, by Country
1 1 .5 2 2 .5 1983 2002 year Austria Belgium Canada Finland France Italy UK Norway Spain Sweeden USA
Figure 5: TFP Evolution in Chemical Industries, by Country
.5 1 1 .5 2 2 .5 1983 2002 year Austria Belgium Canada Finland France Italy UK Norway Spain Sweeden USALog TFP gap, Chemical industry
Figure 6: TFP Evolution in Textile, Clothing and Leather Industries by Country
-. 5 0 .5 1 1 .5 2 1983 2002 year Austria Belgium Canada Finland France Italy UK Norway Spain Sweeden USA
Figure 7: TFP Evolution in Other Industries by Country
.5 1 1 .5 2 1983 2002 year Austria Belgium Canada Finland France Italy UK Norway Spain Sweeden USAReferences
Arellano M, Bond S. (1991) “Some Tests of Specification for Panel Data: Monte Carlo Evidence and an Application to Employment Equation” Review of Economic Studies, 58, 277-297 Bhagwati, J (1978) Foreign Trade Regimes and Economic Development: Anatomy and
Consequences of Exchange Control Regimes, Lexington, Ma Ballinger
Ben-David D (1993) “Equalizating Exchange: Trade Liberalization and Income Convergence”
Quarterly Journal of Economics, 108(3)
Bernard A., et C.I Jones (1996a), « Technology and convergence », The Economic Journal, 106, 1037-1044
Bernard A., et C.I Jones (1996b), Productivity across industries and countries: time series theory and evidence. The Review of Economics and Statistics, 78(1), 135-146
Dollar, D (1992) “Outward-Oriented Developing Economies Really Do Grow More Rapidly: Evidence from 95 LDCs, 1976-85, Economic Development and Cultural Change, 523-544.
Edwards. S (1998) “Openness, Productivity and Growth: What do we really know?” The
Economic Journal, 108, March, 383-398
Freeman, D.G, Yerger, D.B, (2001), interpreting cross-section and time series tests of convergence: the case of labor productivity in manufacturing. Journal of Economics and
Business 53, 593-607.
Funk M, Strauss J. (2003), “Panel tests of stochastic convergence: TFP transmission within manufacturing industries”. Economics Letters 78, 365-371.
Granger C.W.J (1969) “Investigating causal relations by econometric models and cross-spectral methods”. Econometrica 37, 424-438
Haddad .M, J de Melo and B. Horton (1996), Morocco, 1984-89: Trade Liberalization, Exports, and Industrial Performance, in M. J Roberts and J. Tybout, Industrial Evolution in Developing Countries, 285-313
Harris R.I., Trainor M. (1999) “Manufacturing industry in Northern Ireland and Great Britain: Was there convergence during the 1949-92 period?” Applied Economics, 31, 1573-1580 Harrison A. (1996) “Openness and growth: a time series, cross country analysis for developing Countries”, Journal of Development Economics, Vol48, 419-447
Hurlin C, Venet B. (2001), “Granger causality tests in panel data models with fixed coefficients.” Working Paper, EURISCO, Université de Paris Dauphine.
Im K.S., Pesaran M.H., Shin Y. (1997) “Testing for unit roots in heterogeneous panels”, Working
paper, University of Cambridge
Im K.S., Pesaran M.H., Shin Y. (2003) “Testing for unit roots in heterogeneous panels”, Journal
of Econometrics, 115, 53-74
Krueger A (1981), Foreign Trade Regimes and Economic Development: Liberalization Attempt and Consequences, Ballinger for the NBER, Cambridge, Mass
Levin A., Lin C.F. (1993) Unit root in panel data: new results; University of California, San Diego, Working Paper.
Martin W., Mitra D. (2001), “Productivity growth and convergence in agriculture versus manufacturing.” Economic Development and Cultural Change, 49, (2), 403-422
Maddala G.S, Wu S. (1999) “A comparative study of unit root tests with panel data and a new simple test”, Oxford Bulletin of Economics and Statistics, 61, 631-652
Morrisson C, Talbi B (1996) La croissance de l’économie Tunisienne en longue période, étude du centre de développement de l’OCDE, série croissance, OCDE
Mukherjee A.N, Kuroda Y. (2002), “Convergence in rural development: evidence from India”.
Journal of Asian Economics, 13, 385-398.
Mukherjee A.N, Kuroda Y. (2003), Productivity growth in Indian agriculture: is there evidence of convergence across states? Agricultural Economics 29, 43-53.
Nair-Reichert U., Weinhold D. (2001) “Causality tests for cross-country panels: a new look at FDI and economic growth in developing countries”, Oxford Bulletin of Economics and
Statistics, 63,2, 153-171
Rodrik, Dani (1995) « Trade and Industrial Policy Reform » in Jere Behrman and T.N Srinavisan, eds, Handbook of Development economics, vol 3B. Amsterdam: North Holland pp 2925-82
Rodriguez F and D. Rodrik (1999) Trade Policy and Economic Growth/ A skepic’s Guide to The Cross-National Evidence, NBER Working Papers Series 7081
Sachs. J and A. Warner (1995), “Economic Reform and the Process of Global Integration”
Brookings Papers on Economic Activity, 1995:1, 1-118
Tybout J.R (1996) “Chile, 1979-1986: Trade Liberalization and Its Aftermath” in M. J Roberts and J. Tybout, Industrial Evolution in Developing Countries, 200-225