The Design and Performance of a Low-Cost
Inflatable Wheelchair Seat Cushion
by Shannon E. K. McCoy SACHUSETTS INSTITUTE OF TECHNOLOGY.
M_
16
2019
LIBRARIES
ARCHIVE5
Submitted to the Department of Mechanical Engineeringin Partial Fulfillment of the Requirements for the Degree of Bachelor of Science in Mechanical Engineering
at the
Massachusetts Institute of Technology
June 2019
C2019 Shannon E. K. McCoy. All rights reserved.
The author hereby grants to MIT permission to reproduce and to distribute publicly paper and electronic copies of this thesis document
in whole or in part in any medium now known or hereafter created.
Signature of Author: ...
Signature redacted
...
Departm _of Mecianical Engineering
Signature redacted
C ertified by : ...
Da nI Frey Professor of Mechanical En neering Thesis Supervisor
Signature
red acted
C ertified b y : ...
Maria Yang Associate Professor of Mechanical Engineering
Undergraduate Officer
The Design and Performance of a Low-Cost Inflatable Wheelchair Seat Cushion
by
Shannon E. K. McCoy
Submitted to the Department of Mechanical Engineering on May 16, 2019 in Partial Fulfillment of the
Requirements for the Degree of
Bachelor of Science in Mechanical Engineering
ABSTRACT
For wheelchair users, the use of wheelchair seat cushions is vital to preventing life-threatening pressure sores, but high quality air cushions are often too expensive and inaccessible for many people. Given the prevalence of pressure sores, there is a need for a more accessible alternative to expensive air cushions. The design of a low-cost inflatable wheelchair seat cushion made of bicycle inner tubes, the Loop cushion, was evaluated through conducting user research
interviews and performance tests as outlined in the ISO standards regarding wheelchair seat cushions. Ten tests were conducted on the Loop prototype, including accelerated aging, interface pressure mapping, hysteresis, impact damping, loaded contour depth, envelopment, 10% force deflection, horizontal stiffness, and sliding resistance. An additional test was conducted to evaluate the cushion's pressure distribution in tilted conditions. The results of the above mentioned tests were compared with published data of other cushions, particularly the ROHO High Profile cushion and foam cushions, where available. Loop performed comparably to the ROHO cushion and outperformed the foam cushions on many counts, showing that it is a promising cushion design.
Thesis Supervisor: Daniel Frey
Acknowledgments
Funding for this project, including prototyping costs, travel expenses, and user research expenses has been provided by an MIT IDEAS Global Challenge Grant, an MIT Tau Beta Pi Service and Engineering Fellowship, a Legatum Seed Grant, and an MIT Sandbox Innovation Fund Grant. Testing of the Loop cushion was performed at the University of Pittsburgh Department of Rehabilitation Science and Technology with support from the National Institute on Disability, Independent Living, and Rehabilitation Research (NIDILRR grant number 90REGEOOO1) and the International Society of Wheelchair Professionals (Agreement No. APC-GM-0068 - sub-award by Advancing Partners & Communities, a cooperative agreement funded through USAID under Agreement No. AIDOAA-A-12-00047). NIDILRR is a Center within the Administration for Community Living (ACL), Department of Health and Human Services (HHS). University of Pittsburgh scientists are working with the U.S. Agency for International Development (USAID) under a $2.3 million sub-award to develop the International Society of Wheelchair Professionals (ISWP), a global network to ensure a level of standardization, certification and oversight, to teach and professionalize wheelchair services, and build affiliations to put better equipment in the right hands. The contents of this paper do not necessarily represent the policy of NIDILRR, ACL, HHS, or USAID and you should not assume endorsement by the Federal Government.
User research for the Loop cushion was performed with the help of NGO staff at Puspadi Bali, Access Life Bali, and Access Life Lombok in Indonesia. The individuals involved have no conflict of interest in the outcome of this study and the contents of this paper do not necessarily represent the views of those individuals.
Initial Loop prototypes were designed by Sarah Tress, who was also a co-researcher for all of the testing presented in this paper.
Mentorship, supervision, and advice for this project were provided by Matt McCambridge as well as Prof. Amos Winter, and Prof. Daniel Frey of the MIT Mechanical Engineering Department.
Table of Contents
Abstract 2 Acknowledgements 3 Table of Contents 4 List of Figures 5 List of Tables 7 1. Introduction 92. Background and Design 10
2.1 Pressure Sore Regions 10
2.2 Wheelchair Seat Cushion Options 10
2.3 Prototype Design 12
3. User Research 16
3.1 Participant Demographics 16
3.2 Interview Procedure 17
3.3 User Research Results 18
4. Performance Testing: Experimental Setup and Results 21
4.1 Accelerated Aging and Cyclic Loading 21
4.2 Interface Pressure Mapping 24
4.3 Hysteresis 29
4.4 Impact Damping 36
4.5 Loaded Contour Depth and Overload Deflection 40
4.6 Envelopment 42
4.7 10% Force Deflection 46
4.8 Horizontal Stiffness 48
4.9 Sliding Resistance 50
4.10 Tilt 52
5. Conclusions and Future Work 54
6. References 55
List of Figures
Figure 1: Pelvis and upper femora 9
Figure 2: ROHO High Profile Single Compartment cushion 10
Figure 3a: Vespa inner tube 10
Figure 3b: "E" cushion 10
Figure 4a: Vespa inner tube pressure map 11
Figure 4b: ROHO pressure map 11
Figure 5: Most recent prototype of Loop (top view) 12
Figure 6: Most recent prototype of Loop (bottom view) 12
Figure 7: Loop's plastic base 13
Figure 8: "Hammock effect" forces 13
Figure 9: Loop being assembled 14
Figure 10a: Gender of participants 15
Figure l0b: Ages of participants 15
Figure Ila: Years using a wheelchair 15
Figure 11 b: Hours per day in a wheelchair 15
Figure 12a: Medical conditions 16
Figure 12b: Incidence of pressure sores 16
Figure 13a: Pressure sores experienced 17
Figure 13b: SCI patients 17
Figure 14: Cushion condition 18
Figure 15: Rigid Contour Loading Indenter (RCLI) diagram 21
Figure 16: Cyclic loading test setup 22
Figure 17: Air cells after cyclic loading 23
Figure 18: Magnitude and duration of pressure 24
Figure 19: Pressure mapping zones 25
Figure 20a: Pressure map image 27
Figure 20b: Pressure map color scale 27
Figure 21a: Cushion A hysteresis plot 30
Figure 21b: Cushion B hysteresis plot 30
Figure 21d: Cushion D hysteresis plot 31
Figure 22: Bottomed-out hysteresis example 31
Figure 23a: Closed hysteresis loop example 32
Figure 23b: Open hysteresis loop example 32
Figure 24: Impact damping test setup 36
Figure 25: Impact damping acceleration vs time 37
Figure 26: Loaded contour indenter (LCI) diagram 40
Figure 27: Bulbous indenter diagram 42
Figure 28: Normal load condition pressures 44
Figure 29: Overload condition pressures 44
Figure 30a: Cushion A stress vs strain 47
Figure 30b: Cushion B stress vs strain 47
Figure 30c: Cushion C stress vs strain 47
Figure 30d: Cushion D stress vs strain 47
Figure 31a: Tilt test pressure map color scale 52
Figure 31b: anterior-posterior tilt test pressure map 52
List of Tables
Table 1: Average pressure readings 27
Table 2: Pressure mapping results 27
Table 3: Peak pressures from Okayama study 28
Table 4: Thickness measurements and hysteresis indices 30
Table 5: Displacement and hysteresis indices from Freeto study 34
Table 6: Displacement measurements and hysteresis indices 35
Table 7: Summary of hysteresis indices 35
Table 8: Impact accelerations 38
Table 9: Average impact ratios 39
Table 10: Impact ratios from Sprigle study 39
Table 11: Impact ratios from Hillman study 40
Table 12: LCD and overload deflection 41
Table 13: Envelopment initial thickness measurements 44
Table 14: Displacement at load conditions 44
Table 15: Absolute immersion 44
Table 16: Force required for 10% deflection 47
Table 17: Computed elastic moduli 47
Table 18: Peak shear forces 49
Table 19: ISO expected shear forces 49
Table 20: Average slipping force 51
Table 21: Tilt test results 53
1. Introduction
The World Health Organization cites that the life expectancy for people with spinal cord injuries in low to middle income countries is as low as one year. Additionally, the primary cause of death for people with spinal cord injuries in low-income countries is preventable secondary conditions, such as pressure sores [1].
Pressure sores are a result of various factors including concentrated pressure, shear forces, seated position, and environmental factors. This can result in loss of blood supply to the tissue, effectively cutting off the supply of oxygen and nutrients to the tissue [2]. Even in the US, there is a high rate of pressure sore development. According to the National Spinal Cord Injury Statistical Center's Annual Report from 2016 (Table 142) 567 out of 1648 (24.6%) people with spinal cord injuries polled reported developing a pressure sore within the first year after injury [3]. In lower-income countries, this number is even higher. A study in Sao Paulo, Brazil found that 42% of patients with spinal cord injuries (SCIs) had experienced a pressure sore between the years of 1998 and 2008 [4], while studies conducted in various other countries found that between 40% and 60% of SCI patients developed a sore [5].
Pressure sores often result in open wounds, which, if left untreated, can lead to local infection and full body infection or sepsis, eventually resulting in death. These pressure sores often progress to infection and death because without proper education or training, the pressure sores may go undetected since wheelchair users cannot feel it themselves. Even once a wound is discovered, it requires meticulous care to recover from [5]. However, proper pressure sore treatment is often inaccessible or too costly for wheelchair users, so prevention is key.
Published studies on the number of wheelchair users in developing countries worldwide are not readily available. Combining estimates from the World Health Organization and the Wheelchair Foundation, there are about 70 to 100 million people in developing countries worldwide who need wheelchairs [4]. The World Health Organization also cites that an estimated 20 million of these people do not have wheelchairs. In Indonesia in particular, it is estimated that 20% of the population has some kind of disability, with approximately 2% of the population, or 4.8 million people, needing to use a wheelchair [6]. The prevalence of motorbike accidents and falls from treetops and rooftops due to the nature of employment of many people raises the rate of debilitating injuries.
2. Background (or Theory)
2.1 Pressure sore regions
For wheelchair users, pressure sores form primarily over bony prominences of the pelvis and upper femora, shown below in Figure 1. In a normal seated position, the ischial tuberosities in particular experience the most pressure, so pressure sores most commonly occur there [2].
Ihc crest Anterior
mac
-pn
Gieot
trochanter Coccyx Ptbic kschkal tubeosityFigure 1: The pelvis and upper femora are shown above [7]. The ischial tuberosities especially are important to cushion well, as pressure sores are more likely to form there. 2.2 Wheelchair seat cushion options
Wheelchair seat cushions are essential to preventing life-threatening pressure sores. Unfortunately, many users in developing countries receive poor quality cushions or have no cushions at all. In countries such as Indonesia and Vietnam, the only ways to get a seat cushion are to receive a foam cushion from Non-Governmental Organizations (NGOs) or to make your own cushion. Air cushions, such as the ROHO High Profile Single Compartment cushion by Permobil, pictured below in Figure 2, provide superior quality to both options. The ROHO cushion is one of the most popular air cushions currently on the market, and has been shown to be very effective in distributing pressure and reducing shear forces [8, 9]. It is made of black neoprene molded into air cells that are all connected but the airflow restricted. Unfortunately, the ROHO cushion is inaccessible to many due to its high cost of nearly $400. According to NGO staff at Access Life Bali, NGOs pay around $250 total for each wheelchair, which puts the ROHO cushion completely out of an affordable range for the vast majority of patients.
Figure 2: The ROHO High Profile Single Compartment cushion by Permobil is shown above [10].
As mentioned above, in many developing countries there are two options for getting wheelchair
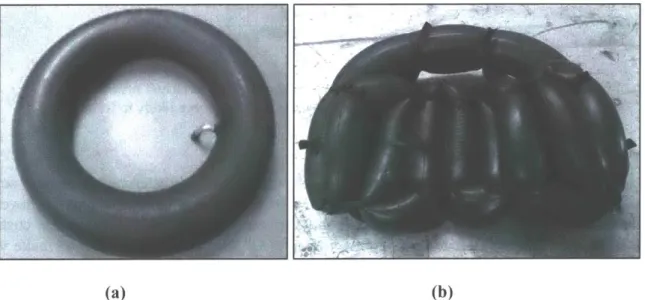
seat cushions. The first is for wheelchair users to make the cushion themselves. Some will get foam from old furniture and upholster it to make a cushion. However, this type of foam is not suitable for distributing pressure evenly and breaks down very quickly. Alternatively, people will often sit on a Vespa inner tube or tie together a regular inner tube into a zig-zag pattern and use it as a cushion, as shown in the Figure 3 below.
(a) (b)
Figure 3: Photo (a) is a Vespa inner tube, which has been utilized by wheelchair users as an improvised cushion. Panel (b) shows an "E" cushion, which is an inner tube tied into a zig zag pattern.
- I
A study in Malaysia in 2011 compared pressure distribution of a simple Vespa inner tube with the ROHO cushion, finding that the Vespa cushion did not do an adequate job distributing the pressure, as shown below [11].
(a) (b)
Figure 4: Panel (a) shows the pressure map for a Vespa inner tube, while panel (b) shows the pressure map for a ROHO cushion [11]. While an exact color scale was not provided in the study report, the high pressure points in the Vespa tube are evident in red and yellow.
While these do not distribute pressure all that well, they show the feasibility of using bicycle inner tubes in a seat cushion. The other option is to receive a cushion from an NGO that distributes wheelchairs. These NGOs usually give out polyurethane foam cushions that do not distribute pressure as well as air cushions. A study conducted in Okayama University Medical School in 1999 found that air cushions and gel cushions outperform foam cushions in pressure relief [8]. Furthermore, the foam cushions usually break down within a few years and are no longer effective. If the wheelchair user cannot travel to the NGO again, they are left to use an ineffective cushion since the foam is not repairable. The WHO notes that the number of physical or occupational therapists per 10,000 people in Indonesia is nearly zero [4]. This means that, to have brighter prospects for survival and good health, wheelchair users and their caregivers must be able to be relatively self-sufficient, and an important part of that is having a durable and long-lasting seat cushion.
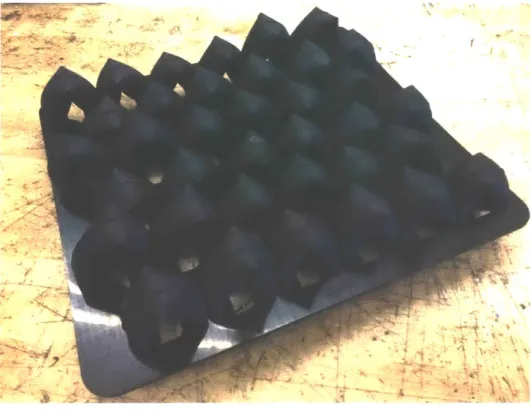
2.3 Prototype Design
This paper will analyze and discuss the performance, both qualitatively and quantitatively, of a prototype of a low-cost alternative to expensive air-cushion technology. The prototype, which will be referred to as "Loop" hereafter, is made of three bicycle inner tubes (dimensions: 26"xl.95"-2.125") looped through a laser-cut Delrin plastic base. While using inner tubes as a wheelchair seat cushion is not a novel idea, the use of inner tubes looped through a base piece to replicate the best cushion technology is the innovative element of Loop. The Delrin base is shown in Figure 7. The overall dimensions of the assembled Loop cushion are 15.5" x 17".
4<
iii?
~ 4,AK
Figure 5: The most recent prototype of Loop, which was used for all of the tests described in this paper, is shown above (top view). Three bicycle inner tubes are looped through the Delrin base in the left to right orientation of the photo above before being pumped up using a standard bicycle hand pump for Schrader valves.
Figure 6: The Loop prototype is shown above (bottom view). The inner tube valves are accessible on the left hand side. During testing, the air cells on the bottom of the cushion
Figure 7: The above picture shows the shape of Loop's Delrin base. The thin slits are used to constrict the flow of air such that only a small amount of air can pass through between air cells.
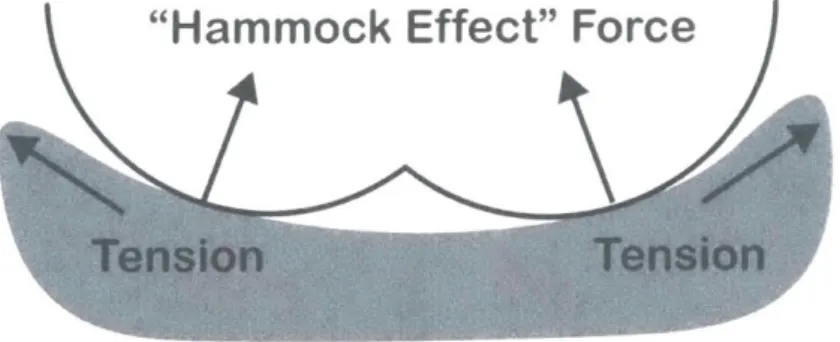
The key function of the base piece in the Loop cushion is its ability to form cells of air and restrict the movement of air between the individual cells. Since sitting on an unmodified inner tube is essentially the same as sitting on an open air bladder, the pressure distribution is limited
by the rubber membrane of the inner tube. The tension in a curved, inflated membrane induces a
proportional radial pressure that varies with tension and curvature [12]. This induced force is shown in Figure 8 below. By creating individual compressible air cells, the pressure distribution is no longer limited by the membrane enclosing the air, which enables the seated pressure to be more evenly distributed. The "hammock" effect from the membrane tension can be virtually eliminated.
"Hammock Effect" Force
Tension
Tension
Figure 8: The "hammock effect" forces induced by the membrane tension are shown above.
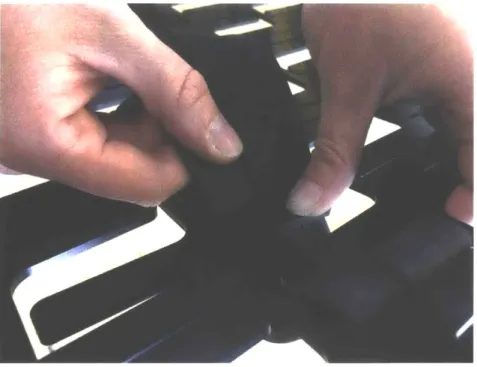
The Delrin tabs can be bent out of the way to allow the inner tube to be slid into the slots in their proper position. Each resulting loop must be the same height to ensure that there are no abnormalities in the surface of the cushion. After the inner tubes are looped through the base, the cushion is inflated with a standard bike tire pump with a Schrader valve.
Figure 9: The Loop cushion being assembled. The Delrin tabs are bent slightly to allow the inner tubes to be woven through the slots.
Since it is made of cheaper materials and can utilize cheap manufacturing techniques such as punching instead of the expensive rubber molding used for manufacturing the ROHO cushion, the Loop cushion can be much lower in price. While the actual cost at scale will depend on final
factors including base material choice, manufacturing method, production scale, and assembly process, it is reasonable to estimate that Loop will cost under $10.
3. User Research Experimental Design
User research was conducted in Bali and Lombok, Indonesia to help determine the feasibility of our prototype and get input from both therapists and wheelchair users within the type of environment in which Loop is meant to be used. Local NGOs were partnered with, including Puspadi Bali, Access Life Bali, and Access Life Lombok. These NGOs, which specialize in providing therapy, rehabilitation, and support for people with disabilities and their families helped set up interviews. Interview candidates were selected and contacted by NGO staff based
on their relevancy to the issue and their ability to participate in interviews. 3.1 Participant Demographics
Thirty-seven wheelchair users were interviewed, with the goal of hearing from people of varied conditions and situations, in order to get enough feedback to make the Loop prototype generalizable. The ages of participants ranged from eleven years to eighty-four years, and the number of years spent in a wheelchair so far ranged from less than one month up to nearly thirty years. Approximately one third of participants had either experienced a pressure sore before or currently had one. A breakdown of participant demographics is shown below in Figures 10-12.
Eu Cu 30 20 10 0*
Gender
C 0. CuAge
20 10 0 Male a Female (a) 0 Under 30 * 30 -50 9 Over 50 (b)Figure 10: Panel (a) on the left shows the gender of participants interviewed, with 24 males and 13 females. Panel (b) displays the ages of participants, where each box has an inclusive lower bound and exclusive upper bound, so for example, a participant aged 30 years would be included in the middle box.
Years Using a Wheelchair
*lto3 *3to5 *5tolO Over 10
(a)
- 20 15
* 10
50
Hours Per Day in
Wheelchair
0
*Lessthan4 *4to8 *8to12 Over 12
(b) -u 0. 15 -10 5. 0~
-Figure 11: Panel (a) records how many years each participant had been using a wheelchair, either their current one or any other wheelchair. Each box has an inclusive lower bound and exclusive upper bound, so for example, a participant who has used their wheelchair for 5 years would be included in the third box.
Medical Condition
Pressure Sores
& 30
10 20
5 10
Z 0 0
" Spinal Cord Injury * Pressure Sore Experienced
" Polio
" Cerebral Palsy a No Pressure Sores * Amputation or Birth Defect
Other
(a) (b)
Figure 12: Panel (a) shows the medical conditions causing each participant to use a wheelchair. The box labeled "Other" includes conditions such as stroke, brain or nerve damage, rheumatoid arthritis, multiple sclerosis, and any undiagnosed conditions. Of note, these diagnoses were all self-reported by the individuals without being verified by a physician for this study. Panel (b) displays how many of the participants interviewed reported experiencing pressure sores, either currently or previously.
3.2 Interview Procedure
Before each interview was conducted, a detailed consent form was read to the participant and any family members who requested to be present. Participants were given the option of keeping their name and responses to be anonymous in any publications or write-ups, as well as reminded of their right to end the interview at any point during the process. Participants were compensated for their time to the amount of 50,000 Indonesian rupiah (equivalent to $3.55 USD at the time of
the study), based off of Indonesian hourly wages as well as budgetary allowance.
Each interview took about a half hour to complete, and included questions about current wheelchair/cushion use, available resources, seat cushion requirements, and the user's ideal preferences. Since many people in Indonesia do not speak English, a native-speaker translator with experience in social work was employed, and detailed notes were taken for each interview. Interviews were conducted in either Bahasa Indonesian (in Bali) or Sasak (in Lombok). Questions were designed to minimize false positive responses or interviewer biases, and the translation and understanding of questions was checked prior to conducting interviews. Both the
interview questionnaire and the consent form used are included in Appendices A and B.
3.3 User Research Results
-_=W-To analyze the data from all 37 interviews, spreadsheets were made with a breakdown of every single statement made by a participant, along with a corresponding interpreted need or design requirement based on that statement. This revealed more about the contexts in which people use their wheelchairs and cushions, the most common conditions causing people to need wheelchairs, as well as more of the cultural attitudes and practices towards disabilities. User responses also helped clarify more about the resources available locally, which will be important in creating a locally sourced product.
Interpreted needs fell under the following categories: cleaning, functionality, cost, cover, size/dimensions, materials/maintenance, and assembly. The most prevalent needs that users cited were that the cushion needed to be durable, feel stable, stay cool, be cleanable, and ensure that there are no pressure points.
The responses from users varied mostly based on differences in medical conditions and lifestyle among interview participants. For many users with polio, a main priority was comfort and temperature control, however, users with spinal cord injuries were not so focused on comfort, instead noting the importance of stability.
Pressure Sore prevention
Users without sensation in their lower body were more likely to have experienced a pressure sore-two-thirds of those who had suffered a pressure sore were lacking sensation either partially or totally, as shown in Figure 13. Similarly, patients with spinal cord injuries were more likely to have had a sore than patients with polio or other medical conditions. Since people with spinal cord injuries are especially at risk for pressure sores, their needs for a seat cushion must be weighted appropriately.
Pressure Sores
SCI patients
Experienced
Has not had a Has pressure sensation sore (5) (4) Has had a Has no pressure sensation sore (9) (8) (a) (b)Figure 13: Panel (a) displays how many of the 12 participants who had experienced a pressure sore have sensation in their lower body. Panel (b) shows the number of participants with spinal cord injuries (SCI) who had experienced a pressure sore.
Sanitation
Sanitation is important for maintaining the health of wheelchair users. It is especially crucial for people with spinal cord injuries because of the prevalence of incontinence among such populations. A study in Pakistan conducted in 2010 found that 86% of fifty SCI patients interviewed reported having incontinence, either regularly or on occasion [13]. In addition, sweat and other bodily fluids also build up, especially in the hot and humid climates of Southeast Asia, making the cushion rife with bacteria. In the user study conducted for this paper, only one of the thirty-seven participants interviewed reported washing their entire cushion, and even then only about once every month. The vast majority of participants instead either just washed the cover and not the cushion or just wiped off the surface of the cover. The prevailing reason for this was the fact that, especially in a tropical climate such as Indonesia, the foam cushion would take a long time to dry out, during which it would be unusable by the patient, who would then be left without a cushion to sit on until it dried completely.
Since Loop is made of bicycle inner tubes and plastic, both of which can be washed with soap and water and air dried, the prototype is easier to clean than a foam cushion. Future work on this aspect will include testing various common cleaning products such as bleach on the prototype materials to evaluate whether certain cleaning agents damage the cushion.
Durability
Study participants were asked about the durability of their current cushion. The majority of respondents (22 out of 32 respondents) reported that their foam cushion had already become permanently compressed. A breakdown of responses is shown in Figure 14. Sixteen of those with compressed cushions said that their cushion got permanently compressed within three years of receiving the cushion.
Cushion Condition
No information(3) No foam cushion
(2)
omr yet Foam compressedA
(10)-Figure 14: The above chart shows the responses from 37 interview participants when asked about the condition of their current cushion.
Most of the participants with compressed cushions simply kept using their compressed cushion, even though it no longer worked well. This confirmed a key design requirement of Loop-it must be durable and last longer than foam cushions. The use of bicycle inner tubes is critical to this, as they are durable, can be patched, and are widely available. Thirty-two out of thirty-seven users interviewed reported that they or someone they knew could get access to new inner tubes relatively easily. Based on interview responses and prices seen at local bicycle shops, the price of an inner tube seemed to be 25,000-50,000 IDR ($1.75-$3.50 USD). If well cared for, the cushion should be able to last indefinitely, with the inner tubes replaced as needed. Aging testing must be done on the plastic base and the final material selected appropriately to ensure that it lasts for many years in any environmental conditions.
4. Performance Testing: Experimental Setup and Results
To learn more about the qualitative performance of the Loop prototype, a suite of tests were performed at the University of Pittsburgh Department of Rehabilitation Science and Technology. The introduction of the ISO 16840-2:2018 standard states that "the link to clinical efficacy, although implied, has not been validated," [14] and all three of the standards referenced note that these tests are not meant to be used for prescribing cushions to specific users [14-16]. Instead, the ISO standards regarding wheelchair seat cushions are meant for use in comparison between cushions and to aid clinicians in characterizing cushion parameters that may help in the treatment and care of patients.
These tests follow the prescribed procedures outlined in the International Organization for Stan-dardization (ISO) 16840-2:2018, ISO 16840-6:2015, and ISO 16840-12:2015. Ten tests were conducted and include accelerated aging and cyclic loading, interface pressure measurement, hysteresis, impact damping, loaded contour depth, envelopment, 10% force deflection, horizontal stiffness, and sliding resistance. Additionally, although it is not currently part of the ISO standards regarding wheelchair seat cushions, a test was conducted on how the cushion distributes pressure in tilted or uneven load conditions. The details and results of these tests are presented in this paper. This experimental study did not monitor the temperature and humidity in the room used for testing, so that part of the ISO standards was left out of all tests.
A wheelchair seat cushions requires a cover to protect it from being damaged or contaminated [12]. To maintain consistency and reduce variability in testing, the Loop cushions tested in this study all used a cover from the United Cerebral Palsy (UCP) Comfort Cushion. This cover is made of a loose synthetic, stretchy material on the outside with a water resistant layer beneath it, with Velcro on the bottom to attach to a wheelchair. It was selected for use with the Loop cushion because it fit the prototype dimensions and was designed for use in developing regions. For the tests conducted in this study, the four cushions were set up by overinflating the inner tubes and then letting out air until the air cells were evenly inflated. The air pressure was set such that each air cell would recover slowly when compressed, and such that the person assembling it could fit their fingers beneath their ischial tuberosities while sitting on the cushion. Finally, the cushions were each tested with a pressure map to verify that they all performed similarly-having a uniform pressure distribution across all three inner tubes and minimizing the pressures experienced.
4.1 Accelerated Aging and Cyclic Loading
In order to simulate and test how the Loop prototype would react to aging, accelerated aging was performed on one cushion. This aged cushion was put through all the same tests as three un-aged cushions in order to examine specifically how aging affects the performance of the cushion. Since users will likely continue to use their seat cushion for a prolonged period of time, it is important to establish a time frame in which the cushion will continue to be effective without replacement.
--- I
The selected cushion, identical to the other cushions being tested, was aged according to ISO 16840-6:2015, section 22 standards for a simulation of approximately one year of aging and use [15]. The cushion was heated in an incubator at (70 2) 'C for eleven total days. After 5.5 days in the chamber, the cushion was removed and the partially aged cushion underwent cyclic loading. This cyclic loading test applied a repetitive load of 500 N through a Rigid Cushion Loading Indenter (RCLI), shown in Figure 15, at a rate of 40 cycles per minute for 17,500 cycles. This number of cycles was used as an approximation for the number of impacts the cushion would undergo in a year due to user transfers, jolts, etc. Figure 16 shows the experimental setup for this test during the testing period.
2
3
5
68
Key
1 actuator to apply load 2 frame
3 solid rod
4 point of application of load 5 displacement gauge 6 reference plane
7 method of restraint under cushion
8 RCLI
9 cushion
Figure 15: A Rigid Contour Loading Indenter (RCLI) is shown above on a loading cell setup, from the
After undergoing the cyclic loading, the cushion was examined to check for any signs of wear. Aside from some slight rubbing between the individual air compartments, the aged cushion was found to be unchanged visibly. These rub marks are shown in Figure 17. During the course of testing this cushion, the rub marks were not observed to directly impact performance, so future
studies would have to age the cushion further to examine if this is an issue or not. Additionally, the cushion did not "bottom out," or reach the limit of its compressibility, at all during the course of the cyclic loading. This indicated that it had withstood the aging process without losing its ability to support the load applied.
Figure 16: The experimental setup for the cyclic loading is shown above, with the 500 N load applied directly vertically over the RCLI.
Figure 17: Some slight rubbing, pointed out by the red arrow in the picture above, was observed in between the air cells after the cyclic loading was applied, due to the motion of the air cells as they compressed and then re-inflated with each impact.
After cyclic loading was performed, the cushion was placed back into the aging chamber and held at (70 2) 'C for 5.5 additional days, in order to bring the total up to the eleven days outlined in the ISO 16840-6.22 standard [15]. Aside from being aged to one year, the aged cushion was otherwise unchanged from its un-aged counterparts, in order to have as close a comparison as possible. Of note, this test showed the effects of loading the cushion in its normal functional position. Additional testing on the Delrin base itself will have to be done to examine how the tabs on the base age and endure loading, such as during assembly of the cushion.
4.2 Interface Pressure Measurement Test
Although many factors influence the risk of pressure sores, they all rely on the actual interface pressure-without pressure no sores would develop. A 1976 study by Reswick and Rogers examined how the magnitude and duration of pressure increases the occurrence of pressure sores, and found an inverse parabolic curve, as shown in Figure 18 below [17].
~II
700
Maxbmum suggsed PMMVu/iOAW
pplicpsim o. b-v pronces 500 E 400-E SI 300- UNKU"ep a- 200100 -2 4 6 8 10 12 14 16 18 Hews of co6UNbS PMSSW
Figure 18: This curve from Reswick and Rogers depicts generally how the magnitude and duration of pressure on the bony prominences impact the occurrence of pressure sores [17]. The "acceptable" range of pressures decreases with prolonged time.
However, despite continued studies, there is yet to be a definitive measure of how much pressure is too much pressure. The pressure itself varies with the weight of the patient, the anatomical structure of the patient, and the contact area [18]. The level of pressure that tissue can safely tolerate, however, can depend on age, hydration, metabolism, location on the body, and overall skin condition [17]. Therefore, the measurement of interface pressures is useful as a relative comparison point instead of as an absolute measure of effectiveness.
Experimental Setup
The interface pressure measurement test, from ISO 16840-6:2015, Section 14 helps characterize how the pressure is distributed across the cushion, in both magnitude and direction [15]. This helps identify pressure points in the cushion at which the risk of pressure sore developing may be
higher.
For this test, a Boditrak 16" x 16" FSA pressure mat was calibrated and placed on top of the cushion to be tested, with the rear row of sensors was lined up with the back of the cushion. The cushion with pressure mat was positioned under a Rigid Cushion Loading Indenter (RCLI) such that the base points of the RCLI were centered on and 125 mm + 10 mm from the back edge of the cushion. The instrumentation software was set to sample at least one sensor array per second, and hysteresis and creep correction algorithms were activated. Once set up, a load of 500 N + 10
N was applied for a period of 60 s + 2 s. At 60 s, the pressure sensor array values were recorded,
and then the load was released. The cushion was reset by flattening or smoothing out to ensure that wrinkles in the cover or pressure mat did not skew the data. The test was repeated for a total of five times per cushion.
Results
To analyze the resulting data of this test, the pressure map was subdivided into zones that represent where the ischial tuberosities are located. The base point zones (BPZ) were defined to be two square zones of 110 mm side length centered 130 mm from the rear edge of the cushion and 55 mm from the center line, as shown in the figure below. The central rear zone (CRZ) was defined as the region behind the base point zones. The peak pressure in each of the base point zones was calculated as the mean of the highest measurement among the four corners of the BPZ across all five iterations.
Figure 19: The base point zones (BPZ) as outlined in ISO 16840-6.14 are shown above, including the left base point zone (LBZ), the right base point zone (RBZ), and the central rear zone (CRZ). All dimensions are in millimeters.
The peak pressure index (PPI) was computed by taking the average of all the cells in the 9-10
cm2 (the approximate area of an ischial tuberosity) centered on the point with the highest
pressure measurement [19]. This was computed for the highest pressure points in both the LBZ and RBZ. In addition to peak pressure, the following values were calculated:
1) Total Force [N] = (sum of pressure readings)x(sensing area)
2) Percent Total Force [%] = (total force in each zone) (total force over entire cushion)
3) Dispersion Index [%] = (sum of pressure readings in BPZ)
(sum of all pressure readings in cushion)
4) Contact Area [mm2] = area of pressure map where pressure is at least 5 mmHg
For test results to be considered valid by ISO 16840-6 standards, the total force computed above must be within 10% of the applied force
tables below display the resulting data for
[15]. Any results outside this range were each of the Loop prototypes tested.
rejected. The
LBZ Max RBZ Max Total force LBZ force RBZ force CRZ force Cushion Pressure Pressure T NJ [NJ rZC [BZ
[mmHg] [mmHg] [N] [NJ [N] [N] A 121.24 121.53 506.88 102.23 95.70 26.78 B 132.73 111.08 510.34 100.82 88.89 20.56 C 109.73 114.19 490.38 90.96 80.62 10.52 D 128.42 101.80 502.71 102.03 83.41 18.03 (aged) 123.03 112.15 502.58 99.01 87.15 18.97 13.85 11.26 12.00 7.44 9.17 9.27
Table 1: The average pressure readings in mmHg for each cushion tested are shown above. The uncertainty was calculated for a 95% confidence interval.
% Total % Total % Total . # of cells Contact PPI in PPI in
Cushion Force Force Force ispersion > 5mm Area LBZ RBZ
LBZ RBZ CZ Hg [cm2] [mmHg] [mmHg] A 20.2 18.9 5.3 44.3 115 835.47 84.73 90.79 B 19.7 17.4 4.0 41.2 109 797.56 90.97 72.79 C 18.5 16.4 2.1 37.1 115 841.30 74.58 64.86 D (aged) 20.3 16.6 3.6 40.5 116 848.59 80.39 72.60 Loop 19.7 17.3 3.7 40.8 114 830.73 82.67 75.21 Avg 1.13 1.54 1.78 1.13 4 31.35 9.54 15.15
Table 2: The measurements called for in the ISO standard are shown above for each cushion tested, with uncertainties for a 95% confidence interval. LBZ = base point zone, RBZ = right base point zone, CRZ
A representative photo of the image produced by with the color scale used.
0 0 0 ' 0 0 0 0 0 0 0 0 0 0 0 0 0 0 0 0 0 0 0 0 0 0 0 0 0 0 0 0 0 0 0 22 4 14 1 0 9 34 8 1 0 0 0 0 0 0 6 9 13 104 22 16 2 0 0 0 0 4 13 62 71 2 8 5 4f 0 01 0 1 40 27 108 64 63 88 4 8 4 0 0 0 0 16 14 37 0 01 0 0 9 0 5 3 0 0 0 0 7 29 13 1 13 2 0 01 0 0 1 21 24 6 6 5 1 1 0 0 0 11 3 18 6 9 1 0 0 0 0 1 7 4 7 7 14 5 1 0 0 0 0 4 8 4 2 1 1 84 a$ 13 1 0 0 0 0 1 12 28 33 4 2 4 2 7 17 3 0 0 0 0 0 0 3 & 2 1 1 1 38 26 4 1 0 0 0 0 0 1 ~1 0 j381(a) (a)
Figure 20: Panel (a) shows a representative of the image produced by the pressure map for each cushion trial. Cushion C trial 5 is shown above. Panel (b) shows on the far right the color scale used by the software in representing the pressure graphically, measured in mmHg.
A study at Okayama University Medical School by Hirosuke Takechi and Akihiro Tokuhiro in 1998 compared the peak pressures for various cushions including a polyurethane foam cushion
and an air cushion [8]. The relevant results of this study, alongside the relevant results from the Loop tests are shown below in Table 3.
. Peak Pressure in LBZ Peak pressure in RBZ
[mmHg] [mmHg]
Air cushion 122.47 33.93 113.03 44.75
Polyurethane foam cushion 214.05 50.87 200.31 71.72
Loop Average 123.03 13.85 112.15 11.26
Table 3: The average values from six trials of each cushion are shown above from the Okayama study [8], along with the Loop average values from Table 1. The Okayama values were originally measured in g/cm2 so were converted to mmHg for comparison purposes. The uncertainties were computed from the the pressure map is shown below in Figure 20
200 180 160 140 120 100 80 60 40 20 -0 mmig 0.00 125.07 19.06 782.36 27.97 146.73 8.61 8.28 289.27 100.00 (b) Mnirrum(nrg) Maximium(nng) Average (mrHg) Variance (rne1gj Standard deviation (nnHg) Coefficient of variation (%) Horizontal center(in) Vertical center (in) Sensing area (in ) R egionalI disnribution (%)
The 1998 study was conducted before the ISO standard for interface pressure measurement was published, so the rest of the calculated values called for by the standard cannot be directly compared with the Okayama results. However, a look at the maximum pressure values in the LBZ and RBZ shows that Loop performs very similarly to the air cushion tested by Takechi and Tokuhiro, and significantly better than the polyurethane foam cushion. Future work would be to conduct tests on other cushions in order to more directly compare the values reported in the ISO standard, as published data is scarce.
4.3 Hysteresis test
Hysteresis, a measure of how an object reacts to loading versus unloading, defines how much energy is absorbed by the cushion [20]. A higher hysteresis value is preferred because those seat cushions help absorb energy that would otherwise be transferred to the user's skin tissues. This is important especially when the wheelchair experiences jolts from steps or street curbs.
Experimental Setup
The testing method, as outlined in IS016840-2, Section 14, utilized an RCLI and a load cell to subject the cushion to even loading and unloading forces from 8 N up to 750 N at a rate of 1 mm/s [14]. The initial thickness was recorded prior to applying the pre-load force of 8N. The thickness, force, and time were continuously recorded as the cycle progressed. Measurements of the cushion thickness at 8N, 250N, 500N, and 750N, both loading and unloading was compared with the initial thickness. The cushion was allowed to recover for a 300 s 10 s period, and then the process was repeated for a total of three data sets for each cushion.
The average thickness value for each cushion at each point was recorded and the hysteresis indices calculated using the following formulae:
hysteresis at 250 N (H2 5 0) = 1 - average unloading thickness at 250 N
average compressive thickness at 250 N
hysteresis at 500 N (Hsoo) = 1 - average unloading thickness at 500 N average compressive thickness at 500 N
Results
Table 4 below shows the computed average thickness values called for by the ISO standard. According to ISO 16840-2:2018, Annex B, the typical range of hysteresis indices for all cushions is between 2.8% and 36.8% for H250 and between 2.8% and 31.0% for H500 [14]. Loop falls
Cushion A Cushion C Cushion D mmB [mmm] (aged) 1mm] 8 N increasing 63.18 7.27 66.35 6.17 62.87 7.46 61.38 2.34 .250 N 32.78 1.76 33.98 1.75 31.64 1.66 33.61 0.83 increasing 500 N 22.40 0.93 24.60 1.19 22.41 0.99 24.33 0.81 increasing 750 N 16.78 0.47 18.45 0.22 16.62 0.14 18.09 0.31 500 N 19.27 0.49 21.19 0.14 19.27 1.03 21.03 0.18 decreasing 250 N 25.91 0.39 28.25 0.21 26.04 0.14 28.52 0.18 decreasing 8 N decreasing 56.02 2.66 60.32 1.06 54.75 1.12 56.89 0.50 H25 0 0.19 0.03 0.17 0.04 0.18 0.04 0.15 0.02 H5 0 0 0.14 0.01 0.14 0.04 0.14 0.02 0.14 0.02
Table 4: This table displays the thickness values recorded for each of the Loop prototype cushions tested, as called for by the ISO standard, with uncertainties computed to a 95% confidence interval. To understand this more visually, the plots in Figure 21 show a graphical depiction of the difference between loading and unloading. In these plots, the area between the loading and unloading curves represents the energy lost to the cushion [20, 21]. If the material were purely elastic, then the unloading curve would follow the same path as the loading curve. A cushion with unloading and loading curved that are approximately the same will not absorb as much energy as a cushion whose loading and unloading curves are further apart.
Cushion A 70 60 m- Loading 0255075 Applie L~oa N 40 - - -- Unloading 30 20 ---10 0 0 250 500 750 Applied Load [NJ (a) Cushion B 70 60 4 Loading 50 40 - -% Unloading - 30 .. 20-. 10 0 0 250 500 750 Applied Load [NJ (b) Cushion C 70 60m --- Loading 50 40 - - -Unloading .X 30a 20 w' - -.R 10 W 0 0 250 500 750 Applied Load [N] (c) -'I
Cushion D (Aged)
250 500
Applied Load [N]
Figure 21: Panels (a) - (d) show the while loading and unloading due characterize how stiff the cushion is.
(d)
difference between how the Loop cushion responds to hysteresis. The slopes of these curves help
The slopes of the curves above indicate the relative stiffness of the cushion, that is, the force required to compress the cushion a specific amount. A shallower slope implies a stiffer cushion, while a steeper slope corresponds to a softer cushion [21]. Additionally, the slope of the curve as it reaches the maximum load of 750 N can help indicate how close the cushion is to reaching its maximum compression and "bottoming out." As an example of this, Figure 22 below shows a load deflection plot from a study conducted in 2013 by Hollington, et al for a 50mm thick CM35 foam cushion [21]. Loading - - Unloading 50 E 40 E 30 20 10 0 0 250 500 750 Force (N)
Figure 22: This plot from Hollington et al shows the load deflection for a 50mm thick CM35 foam cushion. The data shown are the average results from three cycles, as outlined in the ISO standard.
A
0 :2U, 70 60 50 w 40 N 30@ 20@ 10 0 0 750-I-I
.,
5 --- Loading ---- UnloadingThe slope of the curves in the figure above is very shallow-nearly horizontal. This suggests that the foam cushion was approaching its bottomed-out condition [21]. By contrast, the load deflection curves for the four Loop cushions tested shown in Figure 23 still show a negative slope as they approach 750 N of applied load, although it can be interpolated that more applied load past the 750 N maximum would soon flatten out the slopes.
Hollington et al point out that although the slope can be used to help characterize a cushion's bottoming out condition, it does not identify a specific point at which the cushion would bottom out, since that also depends on the cushion's interaction with the user [21].
Examining whether or not the hysteresis loop is open or closed can also help glean information about recovery of the cushion. A closed loop indicates that the cushion fully recovers its shape during the timescale of the test, returning to its original thickness. Examples of open and closed hysteresis loops are shown below in Figure 23 [21]. Hollington, et al believe that this may imply that cushions with closed hysteresis loops have better repeated shock absorption, but acknowledge that the clinical significance of that has not been proven [17]. The test in ISO 16840-2:2018 was not designed to measure envelopment with hysteresis, so it cannot make any determinations regarding the significance of closed or open loops. Future research and development of this test will help reveal whether or not that is indicative of cushion performance.
- Loading - - Unloading - Loading - - Unloading
100 100 E80 E 80 60 60 40 x 40 20 - 20 0 ' _ 0 250 500 750 0 250 500 750 Force (N) Force (N) (a) (b)
Figure 23: Panel (a) on the left shows an example of a closed hysteresis loop for a Propad foam cushion while panel (b) shows an open hysteresis loop for the Vicair Adjuster 10 air cushion [21].
The Loop cushions tested all have open loops, although the difference seen in Figure 21 is not as large as that for the Vicair cushion shown in panel (b) of Figure 23.
To learn more, it is beneficial to also compare the Loop data to the results for a ROHO cushion specifically, as published in a study by Tyler Freeto, Steven J. Mitchell, and Kath M. Bogie at Case Western Reserve University, which compared several cushions on the market with a new proposed gel prototype [22]. The results of this study are shown in Table 5. This study was also based on the ISO 16840-2 Hysteresis test, but the results were reported using the average
displacement values instead of the thickness measurements at each load condition. Additionally,
10 N was used as a load condition instead of 8 N.
Results from Freeto, et al
ROHO Low Profile ROHO High Profile Jay mmmm] 10 N increasing -0.01 0.04 0.01 0.01 1.76 0.97 250 N increasing 11.06 1.25 27.31 0.59 43.38 0.28 500 N increasing 14.45 1.26 32.31 0.67 51.50 0.28 750 N 17.36 1.21 35.14 0.70 56.12 0.80 500 N decreasing 15.95 1.20 33.27 0.69 53.80 0.78 250 N decreasing 13.15 1.19 29.68 0.67 49.30 0.74 10 N decreasing 3.71 0.61 11.34 0.98 23.25 0.61 H25 0 -0.19 -0.09 -0.14 H5 0 0 -0.10 -0.10 -0.04
Table 5: Average displacement measurements and hysteresis indices from a study by Freeto, Mitchell,
and Bogie shown above [22]. This study used displacement values calculate each number and recorded the force at 10 N instead of 8 N,
with the ISO standard.
instead of cushion thickness to but was otherwise in accordance
For ease of comparison, the Loop test data was converted into the form used by Freeto et. al, using the measured initial thickness of the each cushion prototype tested. Those thicknesses were recorded as 69.4 mm for Cushion A, 79.1 mm for Cushion B, 72.1 mm for Cushion C, and 71.6 mm for Cushion D.
Table 6: Loop's hysteresis performance measured by displacement instead of thickness with uncertainties computed for a 95% confidence interval.
is shown above,
Loop's performance was comparable to that of the Jay cushion, ROHO Low Profile, and ROHO High Profile. A summary of the hysteresis indices is shown in Table 7.
Summary of all cushions
ROHO ROHO
Jay 1mm] Low High Loop A Loop B Loop C Loop D
Profile Profile [mMi [mm] [mm (aged)
1mm] 1mm] [mmn]
H2 5 0 -0.19 -0.09 -0.14 -0.19 -0.13 -0.14 -0.13
0.03 0.04 0.04 0.02
H5s0 -0.10 -0.10 -0.04 -0.07 -0.06 -0.06 -0.07
0.01 0.04 0.02 0.02
Table 7: The hysteresis values for each Loop cushion tested compared with the Freeto study results are
shown above [22].
Cushion A Cushion B Cushion C Cushion D
[mm] [mm] [mm] (aged) [mm] 8 N increasing 6.22 7.27 12.81 6.17 9.27 7.46 10.19 +2.34 .250 N 36.63 1.76 45.18 1.75 40.49 1.66 37.97 0.83 increasing 500 N 46.99 0.93 54.55 1.19 49.72 0.99 47.25 0.81 increasing 750 N 52.62 0.47 60.70 0.22 55.51 0.14 53.49 0.31 500 N 50.13 0.49 57.96 0.14 52.86 1.03 50.55 0.18 decreasing 250 N 43.49 0.39 50.90 0.21 46.09 0.14 43.06 t 0.18 decreasing 8 N decreasing 13.38 2.66 18.84 1.06 17.38 1.11 14.68 0.50 H25 0 -0.19 0.03 -0.13 0.04 -0.14 0.04 -0.13 0.02 H5 0 0 -0.07 0.01 -0.06 0.04 -0.06 0.02 -0.07 0.02
The energy absorption of the aged cushion was slightly lower than that of the unaged cushions, but future aging testing will have to be conducted to determine the significance of that. The slopes of the load deflection curves indicate that Loop could tolerate the overloading without reaching its bottomed-out condition.
4.4 Impact Damping
According to ISO 16840-2:2018, Section 9, a cushion's impact damping under normal loading conditions is indicative of its capacity to reduce impact loading onto a user's tissues and also improve postural stability [14]. Effectively absorbing impact decreases the peak pressures experienced by the user during an impact such as rolling down a step or over a roadside curb. Hysteresis and impact damping are somewhat related, as they both measure the cushion's time-dependent response to loading, and the energy absorption (measured by the hysteresis test) causes the rebounds to damp out in an impact damping test. However, as a study by Hillman, et al in 2017 confirmed, the results for one of these properties cannot be derived from the results for the other [23], since they have such different time scales. Therefore, they must be measured separately.
Experimental Setup
To test impact damping according to the ISO standard, an Impact Damping Rigid Cushion Loading Indenter (IDRCLI) was used to uniformly distribute a load of 500 N 10 N and an accelerometer was used to measure the acceleration of the indenter on top of the cushion as it was dropped a short distance, simulating a sudden impact. Initially, the cushion, placed on a rigid plate, was lifted up on a block to an angle of 100 + 1' to simulate a small step or curb, and the IDRCLI was lined up on the cushion such that the ITs were appropriately centered and placed on the cushion. The setup for this test is shown below in Figure 24 [24]. The accelerometer was then set to begin recording, and 180 s 10 s were elapsed to ensure the steadiness of the accelerometer. After that time interval, the block was pulled away in under 0.1 sec, thereby causing the rigid plate with the cushion and IDRCLI to drop. The accelerometer data was recorded until the acceleration decreased to no more than 1% of its maximum value. The IDRCLI was then lifted off the cushion and the cushion was allowed to recover for 300 s + 10 seconds before repeating the test two more times.
Pull Block Acceleromter LUfflng Strjufur W.Ightd Indener ushion V VngVd Ww iWruMuu 0 .e
Figure 24: The experimental setup for the impact damping test, as outlined in ISO 16840:2018, Section 9, is shown here courtesy of Ferguson-Pell et al [24]. The indenter shown above is an IDRCLI used to apply a uniform load of 500 N 10 N, and the lifted angle is 10'k 10.
Results
The ratio of impact rebound magnitudes reveals how the rebounds are damped. The resulting data set from this test was smoothed using a 3rd-order low-pass Butterworth filter with a cutoff frequency of 25 Hz to reduce noise and make the data more readable. The magnitudes of the first and second impacts (where the impact is measured the local peak of the waveform) for each test were calculated (in m/s2) and the average found. The ratio of the mean second impact to the mean first impact was reported as a percentage. A representative sample of the impact graphs is shown below in Figure 25. Tables 8 and 9 show the numerical values computed for the impact magnitudes.
Cushion A
0 4 3.5 31, 2 5 2 0.5 wprem I 0 da"It Dt. Event 2 a Qam2 --- event 3 * tIsa2 0 0.5 1 1-5 2 2.5 3 Time [s]Figure 25: In this plot, the acceleration vs time is recorded for three trials of cushion A. The impacts are marked at the peaks of the curve.
Impact 2
Impact 1 [m/s2] Impact 2 [m/s2] Impact 1
Impact 1
Cushion Trial I Trial 2 Trial 3 Trial 1 Trial 2 Trial 3 Trial 1 Trial 2 Trial 3
A 3.134 2.973 3.194 1.618 1.500 1.519 0.517 0.505 0.476
B 2.846 3.044 2.844 1.349 1.363 1.316 0.474 0.448 0.463
C 3.144 2.845 2.974 1.495 1.274 1.348 0.475 0.448 0.453
D 3.07 3.087 3.099 1.316 1.455 1.432 0.428 0.471 0.462
(Aged)
Table 8: The magnitude of the acceleration of the cushion at each impact is recorded above in meters per
second.
![Figure 4: Panel (a) shows the pressure map for a Vespa inner tube, while panel (b) shows the pressure map for a ROHO cushion [11]](https://thumb-eu.123doks.com/thumbv2/123doknet/14681178.559285/11.917.110.787.208.490/figure-panel-shows-pressure-vespa-inner-pressure-cushion.webp)
![Figure 15: A Rigid Contour Loading Indenter (RCLI) is shown above on a loading cell setup, from the ISO 16840-2:2018, Section 5 Figure 1 [14]](https://thumb-eu.123doks.com/thumbv2/123doknet/14681178.559285/21.917.238.660.336.1028/figure-rigid-contour-loading-indenter-loading-section-figure.webp)
![Figure 18: This curve from Reswick and Rogers depicts generally how the magnitude and duration of pressure on the bony prominences impact the occurrence of pressure sores [17]](https://thumb-eu.123doks.com/thumbv2/123doknet/14681178.559285/24.917.270.694.112.454/reswick-generally-magnitude-duration-pressure-prominences-occurrence-pressure.webp)
