HAL Id: hal-03213236
https://hal.archives-ouvertes.fr/hal-03213236
Submitted on 30 Apr 2021
HAL is a multi-disciplinary open access
archive for the deposit and dissemination of
sci-entific research documents, whether they are
pub-lished or not. The documents may come from
teaching and research institutions in France or
abroad, or from public or private research centers.
L’archive ouverte pluridisciplinaire HAL, est
destinée au dépôt et à la diffusion de documents
scientifiques de niveau recherche, publiés ou non,
émanant des établissements d’enseignement et de
recherche français ou étrangers, des laboratoires
publics ou privés.
The European climate under a 2 °C global warming
Robert Vautard, Andreas Gobiet, Stefan Sobolowski, Erik Kjellström,
Annemiek Stegehuis, Paul Watkiss, Thomas Mendlik, Oskar Landgren,
Grigory Nikulin, Claas Teichmann, et al.
To cite this version:
Robert Vautard, Andreas Gobiet, Stefan Sobolowski, Erik Kjellström, Annemiek Stegehuis, et al..
The European climate under a 2 °C global warming. Environmental Research Letters, IOP Publishing,
2014, 9 (3), pp.034006. �10.1088/1748-9326/9/3/034006�. �hal-03213236�
PAPER • OPEN ACCESS
The European climate under a 2 °C global
warming
To cite this article: Robert Vautard et al 2014 Environ. Res. Lett. 9 034006
View the article online for updates and enhancements.
Related content
Bias patterns and climate change signals in GCM-RCM model chains
Silje Lund Sørland, Christoph Schär, Daniel Lüthi et al.
-Consequences of 1.5 °C and 2 °C global warming levels for temperature and precipitation changes over Central Africa
Wilfried Pokam Mba, Georges-Noel T Longandjo, Wilfran Moufouma-Okia et al.
-The effects of 1.5 and 2 degrees of global warming on Africa in the CORDEX ensemble
Grigory Nikulin, Chris Lennard, Alessandro Dosio et al.
-Recent citations
Sharing the burden: quantifying climate change spillovers in the European Union under the Paris Agreement
Jessie Ruth Schleypen et al
-Spatial and temporal differences in the response of Larix sibirica to climate change in the central Altai Mountains
Jiang Shaowei et al
-Effect of three different types of biochars on eco-physiological response of important agroforestry tree species under salt stress
Muhammad Talha Bin Yousaf et al
-Environmental Research Letters
Environ. Res. Lett.9 (2014) 034006 (11pp) doi:10.1088/1748-9326/9/3/034006
The European climate under a 2
◦
C global
warming
Robert Vautard
1, Andreas Gobiet
2, Stefan Sobolowski
3, Erik Kjellström
4,
Annemiek Stegehuis
1, Paul Watkiss
5, Thomas Mendlik
2,
Oskar Landgren
6, Grigory Nikulin
4, Claas Teichmann
7,8and
Daniela Jacob
71Laboratoire des Sciences du Climat et de l’Environnement (CEA/CNRS/UVSQ), Institut Pierre-Simon
Laplace, Orme des Merisiers, Gif sur Yvette, France
2Wegener Center for Climate and Global Change, University of Graz, Austria 3Uni Research, Bjerknes Center for Climate Research, Bergen, Norway 4Swedish Meteorological and Hydrological Institute, Norrköping, Sweden 5Paul Watkiss Associates, Oxford, UK
6Norwegian Meteorological Institute, Oslo, Norway
7Climate Service Center (CSC), Helmholtz-Zentrum Geesthacht, Fischertwiete 1, D-20095 Hamburg,
Germany
8Max Planck Institute for Meteorology (MPIM), Bundesstr. 53, D-20146 Hamburg, Germany
E-mail:[email protected]
Received 22 December 2013, revised 8 February 2014 Accepted for publication 11 February 2014
Published 6 March 2014 Abstract
A global warming of 2◦C relative to pre-industrial climate has been considered as a threshold which society should endeavor to remain below, in order to limit the dangerous effects of anthropogenic climate change. The possible changes in regional climate under this target level of global warming have so far not been investigated in detail. Using an ensemble of 15 regional climate simulations downscaling six transient global climate simulations, we identify the respective time periods corresponding to 2◦C global warming, describe the range of projected changes for the European climate for this level of global warming, and investigate the uncertainty across the multi-model ensemble. Robust changes in mean and extreme temperature, precipitation, winds and surface energy budgets are found based on the ensemble of simulations. The results indicate that most of Europe will experience higher warming than the global average. They also reveal strong distributional patterns across Europe, which will be important in subsequent impact assessments and adaptation responses in different countries and regions. For instance, a North–South (West–East) warming gradient is found for summer (winter) along with a general increase in heavy precipitation and summer extreme
temperatures. Tying the ensemble analysis to time periods with a prescribed global
temperature change rather than fixed time periods allows for the identification of more robust regional patterns of temperature changes due to removal of some of the uncertainty related to the global models’ climate sensitivity.
Keywords: regional climate change, extreme events, European climate
Content from this work may be used under the terms of theCreative Commons Attribution 3.0 licence. Any further distribution of this work must maintain attribution to the author(s) and the title of the work, journal citation and DOI.
1. Introduction
Internationally, there is an ambition to limit global average surface temperature to 2◦C relative to pre-industrial levels.
Environ. Res. Lett. R Vautard et al This is in broad alignment with Article 2 of the objectives
of the United Nations Framework Convention on Climate Change (UNFCCC1992), i.e. ‘stabilization of greenhouse gas (GHG) concentrations in the atmosphere at a level that would prevent dangerous anthropogenic interference with the climate system’. The 2◦C goal was initially advocated (WBGU1995) on the basis of the evidence of the IPCC 2nd Assessment Report (IPCC1995) with the aim of avoiding serious adverse effects to water resources, ecosystems, biodiversity and hu-man health. More recent IPCC assessments broadly reinforce the goal. The Third Assessment Report (TAR: IPCC 2001) outlined greater negative impacts and more widespread and greater risks with rising temperature (as presented in the reasons for concern ‘burning embers’ diagram), while the Fourth Assessment Report (AR4: IPCC 2007) stated it was ‘very likely that all regions will experience either declines in net benefits or increases in net costs for increases in temperature greater than about 2–3◦C’. The European Union agreed to the proposed goal (CEU 1996, 2004, CEC2005,
2007), and at the UNFCCC Conference of the Parties in Cancun (UNFCCC2010), there was international agreement to ‘establish clear goals and a timely schedule for reducing human-generated GHG emissions over time to keep the global average temperature rise below two degrees’.
One element of these review assessments—and the 2◦C goal—is the potential risk of catastrophic events (global or regional discontinuities), known as tipping points or tipping elements (Lenton et al 2008). While information on the likelihood of such events remain subjective, and the critical threshold temperatures that might trigger them are highly uncertain, previous studies (Smith et al2008, Kriegler et al
2009) indicate potential concerns of shifting too far away from the present climate, and especially for moving above 2◦C of warming.
However, even the achievement of the 2◦C goal will be accompanied by a significantly changed climate from today, and will necessitate adaptation. In order to have a comprehensive picture of the consequences of a 2◦C warmer climate for Europe, climate projections with a higher spatial resolution than global climate projections (such as provided by the World Climate Research Program ‘Climate Model Inter-comparison Project’ CMIP3 (Meehl et al2007) and CMIP5 (Taylor et al2012)) are needed, with a rigorous assessment of uncertainties. These goals can be achieved by ensembles of climate projections using regional, limited-area models to downscale global climate projections. Such ensembles have been produced in recent studies dedicated to Europe as in the EU FP5 project PRUDENCE (Christensen et al 2007) and EU FP6 project ENSEMBLES (van der Linden and Mitchell
2009).
However, none of these downscaled studies specifically investigated the climate associated with 2◦C warming. In-stead, they investigated climate change and its uncertainty in fixed future timed periods. Also, most of the socio-economic scenarios used for these projections (SRES A1B, Naki´cenovi´c et al 2000) were not designed to reach a stabilized 2◦C warming and therefore, reach a warmer climate over the century. While a small number of simulations have investigated
a 2◦stabilization scenario (e.g. the ENSEMBLES E1 scenario, van der Linden and Mitchell2009, Jacob and Podzun2010), their small number does not allow for robust uncertainty estimation. New simulations carried out in the framework of the CMIP5 and EURO-CORDEX (Jacob et al 2013) have used a scenario that drives to a likely warming lower than 2◦C (RCP2.6), but at the time of writing the number of simulations using this scenario also remains too small to study uncertainty. The identification of changes corresponding to the 2◦C global warming thus requires using scenarios overpassing this target value with a snapshot approach.
Here we use the ENSEMBLES regional simulations of the A1B scenario (Naki´cenovi´c et al2000), which are now well studied (Kjellstr¨om et al2013, D´equ´e et al2012). The GCMs driving these regional simulations have different sensitivities to natural and anthropogenic climate forcing and reach the target warming at different times. Our method is to collect changes in climate parameters associated with these different times and a reference period for each simulation and gather them in a ‘2◦C ensemble’. This ensemble thus includes un-certainties in the simulation of regional processes simulations and their responses to the global warming and reduces some of the uncertainty due to driving GCM sensitivity. There are limitations to this approach as it does not account for the contributions to uncertainty from systems that have response times longer than the 2◦C time period. This letter reports the most likely changes and their uncertainties calculated from this ensemble. It also aims to estimate the part of the uncertainty that is removed due to considering a period defined by a fixed global warming target instead of fixed time target. We focus on main variables such as temperature, precipitation, sea level pressure and winds, changes in their average and extremes, and on less classical but more explanatory variables such as surface fluxes. By doing so, we provide a unique assessment of what the 2◦C goal might mean for Europe’s climate, overall and across regions, and how this compares to the global average.
2. GCM and RCM simulations used
In the subsequent analysis, we analyze 15 out of 22 RCMs from ENSEMBLES with a horizontal resolution of about 25 km. The 22 RCMs are driven by 6 different A1B GCMs, however, not each of the regionalized climate simulations has a sufficiently long time series to reach +2◦C warming. This leaves 15 RCM simulations driven by 6 different GCMs (table1).
Two of the GCMs (bccr bcm2 0-r1, mpi echam5-r3) are realizations from the CMIP3 multi-model dataset (Meehl et al
2007), three models (HadCM3Q0, HadCM3Q3, HadCM3Q16) stem from the Hadley Centre perturbed physics GCM ensem-ble ‘QUMP’ (Quantifying Uncertainty in Model Predictions) (Collins et al2011). One GCM (ARPEGE; Salas y M´elia et al
2005) is a spectral model with a stretched grid (Fox-Rabinovitz et al2008).
In order to account for RCM and GCM errors, we used a model output statistic (MOS) approach (Maraun et al2010), namely quantile mapping (QM) as described by Themeßl et al (2011), based on D´equ´e (2007). The observational reference was the E-OBS version 5 dataset on a regular 25 km × 25 km
Environ. Res. Lett.9 (2014) 034006 R Vautard et al Table 1. Time period for which +2◦C and +1.5◦C compared to pre-industrial times was reached in ENSEMBLES A1B global climate projections.
GCM RCM +2◦C central year +2◦C period +1.5◦C central year +1.5◦C period
bccr bcm2 0-r1 RCA HIRHAM 2052 2038–2067 2039 2025–2053
HadCM3Q0 RRCMCLM HadRM 2035 2021–2050 2022 2008–2037
HadCM3Q16 RCA HadRM 2028 2014–2043 2016 2002–2031
HadCM3Q3 RCA HadRM 2047 2033–2062 2028 2014–2043
mpi echam5-r3 RegCM REMO HIRHAM RACMO RCA 2048 2034–2063 2035 2021–2050
ARPEGE ALADIN HIRHAM 2043 2029–2058 2028 2014–2043
grid (Haylock et al2008) in the period 1965–2010. We used bias corrected data whenever available, i.e. for daily mean, minimum, and maximum temperature and daily precipitation sum.
Themeßl et al (2012) demonstrated the successful ap-plication of QM to future scenarios of daily precipitation and Wilcke et al (2013) for other meteorological variables. This implementation is very stable and flexible and has been demonstrated to have higher skill in systematically reducing RCM biases than parametric methods (Gudmundsson et al
2012). In order to avoid the suppression of new extremes in the future periods (i.e. values outside the calibration range), our implementation uses the correction terms of minimum and maximum values of the calibration range outside of the calibration range. Although this simple heuristic extrapolation can probably be improved by using methods of the extreme value theory, it proved to be stable and to lead to better results than the uncorrected model output (Themeßl et al2012). How-ever it has to be kept in mind that while quantile mapping is very successful in removing biases and adjusting distributions, it cannot substantially improve the temporal structure of time series from RCMs (e.g., Maraun2012and Wilcke et al2013) or properly correct biases in atmospheric circulation (Eden et al
2012). Further, several studies show that bias correction can moderately modify the climate change signal of a simulation (Christensen et al 2008, Themeßl et al 2012, Boberg and Christensen2012, Dosio et al2012). However, we conducted a parallel analysis based on raw RCM output (not shown), which led to similar qualitative conclusions as the presented study for mean changes.
3. When is global climate likely to reach a 2◦ C warming?
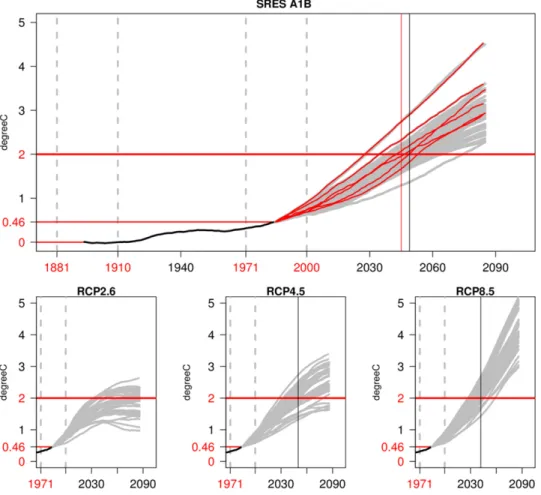
In this study the +2◦C period is defined as the time when the 30-year average global mean temperature reaches +2◦C, compared to a ‘pre-industrial’ period 1881–1910. To define the +2◦C period, we analyzed past observed and future projected temperatures. The following global observational datasets have been analyzed for this purpose: GISS LOTI (1880–2011) (http://data.giss.nasa.gov/gistemp/), HadCRUT3 (1850–2011) (www.cru.uea.ac.uk/cru/data/temperature/), and NOAA NCDC (1880–2011) (www.ncdc.noaa.gov/cmb-faq/a nomalies.php). The time period common to all datasets match-ing best the pre-industrial period is 1881–1910. Thus, we con-sider past pre-industrial warming until the base period as the
temperature rise in a 30-year running mean from 1881–1910 to 1971–2000 (figure1). The three datasets show an average past warming from the pre-industrial period until the base period of 0.46 K (GISS LOTI: 0.437 K, HadCRUT3: 0.475 K, NOAA NCDC: 0.477 K). Thirty-year running means, starting from the base period 1971–2000, are calculated for the 6 GCMs used. The +2◦C period is determined by the year when the 30-year running mean crosses the +2◦C threshold. The projected +2◦C periods show considerable spread, reaching from 2014– 2043 (HadCM3Q16) to 2038–2067 (BCM) (figure 1) with corresponding central years at 2028 and 2052, respectively. The subset of 6 GCMs used in this analysis (table1) still spans the same range for global temperature, so no considerable information should be lost in this respect compared to the full set of ENSEMBLES GCMs, even though possibly reducing the range for regional variables. Also, compared to the entire CMIP3 A1B ensemble with 53 simulations, the ENSEMBLES GCMs miss some lower sensitivity simulations. The CMIP3 simulations project +2◦C warming from 2029 up to 2075, with a median of 2049, whereas the selected ENSEMBLES GCMs reach +2◦C around 2045. Figure1(bottom panels) shows for comparison global warming in the new CMIP5 simulations for the representative emission pathways RCP2.6, RCP4.5 and RCP8.5. While most of the RCP2.6 simulations don’t reach +2◦C at all, the RCP4.5 simulations reach it around 2050 and the RCP8.5 simulations around 2042 (median). This means, except for RCP2.6, all shown emission scenarios most likely to lead to +2◦C warming in a relatively narrow time window between 2042 and 2050, while much stronger differences between the scenarios can be expected in the second half of the 21st century.
4. Robustness assessment
Recently a number of approaches to assess and communicate robustness of projected climate change have been proposed (Tebaldi et al2011), distinguishing model agreement in sign and some indication of statistical significance of individual models changes. They also generally make some attempt to show areas where the climate change signal is low relative to internal variability, but may still contain useful information for policy makers (e.g. a projected change is small and not statistically significant but the models agree on the sign). Here we simply define robustness based on agreement between models. In order for the ensemble change to be considered robust 12 of the 15 models at least must agree on the sign 3
Environ. Res. Lett. R Vautard et al
Figure 1. Global mean temperature (30-year running mean; gray lines) for the SRES A1B ensemble (top panel) and for the RCP2.6, RCP4.5 and RCP8.5 CMIP5 simulations (bottom panels) exceeding the +2◦C threshold (bold red horizontal line). The average observed
temperature compared to pre-industrial (1881–1910) is depicted in the upper panel as black line. The CMIP3 and CMIP5 ensemble median years of reaching the 2◦C target for each emission scenario are shown as black vertical lines, whereas the red vertical line represents the median year of the six driving GCMs of this study, which are highlighted in red. Since most RCP2.6 simulations stabilize below +2◦C, no median exceedance year is shown.
(threshold based on the 95% confidence interval of a binomial test with 50% chance of success). In subsequent figures, areas where such an agreement is not obtained are filled by gray color. A more in-depth investigation of uncertainty will be carried out in a future study using a broader ensemble of EURO-CORDEX simulations and multiple socio-economic scenarios.
5. Changes in Europe at 2◦
C average global warming
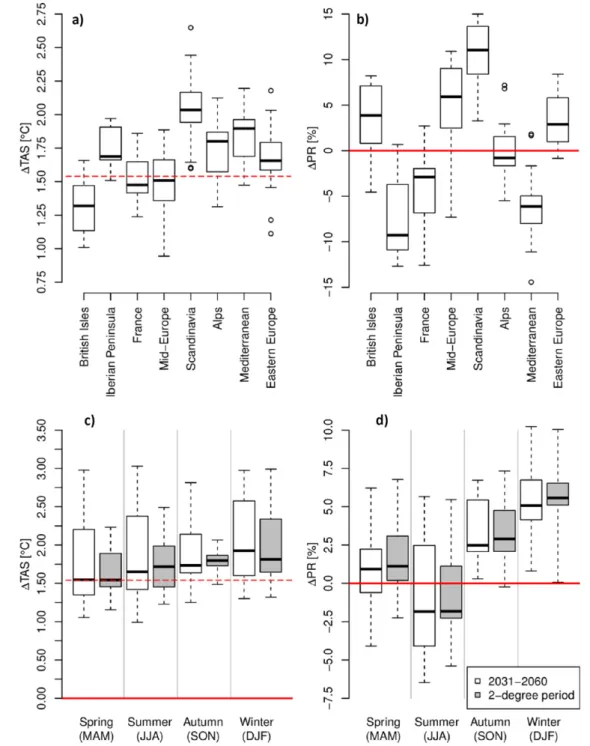
Under a 2◦C global warming (+0.46◦C from pre-industrial to 1971–2000 and +1.54◦C from 1971–2000 to the 2◦C period), ensemble-averaged projected European regional warming gen-erally ranges between 1.5 and 2.0◦C depending on the region. European temperatures therefore mainly exceed the global warming after 1971–2000 (figure2(a)). Only North-Western Europe (British Isles and France in particular) witness a lower relative increase in warming, i.e. below 1.54◦C. The warming is higher in winter (mean = 1.99◦C, 25% = 1.65◦C, 75% =2.34) than in summer (mean = 1.72◦C, 25% = 1.45◦C, 75% = 1.99) (figure2(c)). The spread of simulated changes,
measured as the standard deviation between individual model changes, ranges between about 0 and 1◦C depending on season (not shown). The removal of the uncertainty related to transient climate response to radiative forcing in the GCMs can be readily seen when comparing the spread of simulated temperature changes at +2◦C to those from a fixed time period of 2031–2060, which has a roughly equivalent mean temperature change (figure2(c)).
Figure3(left panels) shows the mean temperature changes simulated by the RCMs between the control period and the +2◦C period, in winter and summer separately. This provides information on the pattern of warming across Europe. Average changes have similar patterns as those described for fixed time periods in several regional ensemble studies (Fischer and Sch¨ar
2010, Kjellstr¨om et al2011): a temperature increase is found everywhere for all models, with enhancement in North-Eastern and Eastern parts of Europe in winter (2–3◦C) and in Southern Europe in summer (2–3◦C). The regional warming exceeds the global warming in most areas except the British Isles and Iceland, where the influence of the moderate warming of the North Atlantic is seen in all seasons. In summer, a relatively small warming is also seen close to the North Sea and the
Environ. Res. Lett.9 (2014) 034006 R Vautard et al
Figure 2. (a) Yearly averaged change—relative to the reference period 1971–2000—in yearly mean temperature in the different European regions for periods corresponding to +2◦C of global average change. The global temperature change (1.54◦C) between 1971–2000 and the 2◦C period is marked as a dotted line. (b) Same as (a) for precipitation in % of change. The solid red line indicates no change for
precipitation and the red dotted line a change of 1.54◦C for temperature, corresponding to a global warming of 2◦C relative to pre-industrial. (c) Spatial average over land of changes in temperature and (d) precipitation, together with the range of changes for the GCM–RCM ensemble (median, 25–75% range and min and max values). The open bars refer to fixed time future period (2031–2060), the gray bars to the temperature controlled (+2◦C) period.
Baltic Sea. All areas undergo robust warming (robustness not shown for temperature because it covers all areas). The ensemble standard deviation of the changes remains much smaller than the amplitude of changes (about 3–10 times smaller) everywhere (not shown).
These spatial differences are important with respect to subsequent impacts. Higher summer temperature changes are
found in the Iberian Peninsula and the Mediterranean region, and will thus compound existing temperature-related impacts such as energy use for cooling (EEA 2012). However, the higher winter warming in Northern Europe will have a mix of positive as well as negative effects, including reduced winter heating. This reveals important distributional consequences 5
Environ. Res. Lett. R Vautard et al
Figure 3. Seasonal mean changes of temperature (left panels), precipitation (middle panels) and sea level pressure (right panels), between the 1971–2000 and the +2◦C periods. Top panels show wintertime changes and bottom panels show summertime changes. Only areas where at least 12 models agree on the sign of the change are colored and areas where at least 14 models agree on the sign of the change are dotted areas. For temperature the agreement on the sign of the change was found everywhere and is not shown.
across Europe, in terms of the patterns of likely impacts, even under the 2◦C goal.
A similar analysis has been undertaken for precipitation. When averaged over the PRUDENCE regions, annual average precipitation robustly decreases by up to about 10% in South-ern sub-regions while it may increase with more than 10% in Northern Europe (figure2(b)). When averaged over European land areas for each season, mean precipitation significantly increases in autumn (mean = 3.3%, 25% = 2.1%, 75% = 4.8%) and winter (mean = 5.3%, 25% = 5.1%, 75% = 6.5%) but changes in spring (mean = 1.7%, 25% = 0.2%, 75% = 3.1%) and summer (mean = −0.5%, 25% = −2.3%, 75% = 1.1%) do not show a clear sign (figures2(b)–(d)). In winter, a general increase is found with maximum values in Northern Europe, especially along many coastal areas, where all models agree upon an increase of 10–15% (figure3middle panels). In Southern Europe the models do not agree on sign except over a few areas (Southern Italy, Greece). By contrast, in summer, the models agree on a robust decrease of precipitation in South-Central Europe of about 10–15%, together with an increase in precipitation over Scandinavia. These changes may exacerbate existing water management issues across Europe, i.e. potentially increasing water deficits in the South during the already heat and evaporation stressed summer. The only area where all models agree on the sign of change is Scandinavia (increase in both seasons) and some smaller areas in South-Eastern Europe and the West coasts of the Iberian Peninsula, France and the Southern British Isles (decrease in summer).
Some climate change signal is found in sea level pressure (figure3, right panels) in the winter season with lower pressure
in the Northeast, but the signal is not very robust. This is however consistent with the temperature and precipitation changes and suggests expansion of the subtropical dry zone into Southern Europe and an enhanced hydrological cycle in Northern Europe and Scandinavia. The summer signal is more robust with most of the models agreeing on modest decreases in SLP across Southern Europe. This modest response could be indicative of localized thermal low pressure due to heating. This is a common feature in the Iberian Peninsula under present conditions but any future increase of said phenomenon requires further elucidation than the present study allows. The summer pattern also indicates an increase in the North–South pressure gradient over the Northern part of the North Atlantic in the domain as pressure increases over the British Isles and decreases over Iceland. Such an increase may help to explain the increase in precipitation in parts of Scandinavia as partly being a consequence of enhanced moisture transport from the North Atlantic.
6. Extremes
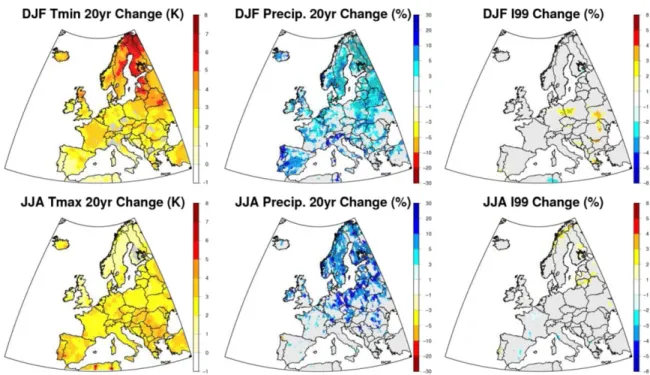
Extreme temperature is here defined as the daily maximum temperature that is exceeded on average only once every 20 years. This is termed the return value and 20 years the return period. Changes in extreme temperature are thus, characterized through changes in the 20-year return values. Return values are estimated using the block maxima method for which the generalized extreme value (GEV) distribution describes the behavior of said maxima (Coles2001). The approach closely follows that of Nikulin et al (2011) and further details are provided therein.
Environ. Res. Lett.9 (2014) 034006 R Vautard et al
Figure 4. Changes, between the 1971–2000 and the +2◦C periods, in the 20-year return value for Tmin in winter (upper left), Tmax in summer (lower left), heavy precipitation in winter (top middle) and in summer (bottom middle), extreme winds (I99) in winter (top right) and in summer (bottom right). Only areas with at least 12 models agreeing on change sign are colored. Areas where at least 14 models agree on change sign are highlighted with dots (except for temperature where almost all areas satisfy this).
For summer daily maximum temperatures (figure 4), the largest changes (3–4◦C) are found over South-Eastern Europe and the Iberian Peninsula. In areas where this value is highest under today’s conditions (Iberian Peninsula, France, the Balkans) the 20-year return value is expected to rise well above 40◦C. As increases in summer extreme heat are linked to health impacts in the form of temperature-related mortality (Baccini et al 2008) the pattern of changes projected under 2◦C is likely to have important health impacts in the more vulnerable regions of Europe. Conversely, the extremes of daily minimum temperatures are reduced most notably in Northern and Eastern areas of Europe, which will have benefits in reducing current winter cold extremes and cold-related mortality as well as winter heating costs (EEA2012), though there would also be negative impacts, such as on winter tourism and ecosystems.
All temperature changes are found to be robust but the spread between models is high in Central and North-Eastern Europe. In parts of this area, notably in Northern Sweden and Finland, there are even models indicating no increase in extreme maximum temperatures. Discrepancies in this area may to some extent be related to how different RCMs treat lakes as parts of this area has a large fraction of lakes that have an impact on the regional climate (Samuelsson et al2010). Extremes of wintertime daily minimum temperature (figure4) undergo a large positive change in winter, ranging from 2–3◦C in Central and Southern Europe to 5–8◦C in Scandinavia and Russia. These changes are robust but again a large spread in model responses is found over Central Europe, where some models do not even agree on the positive sign of the change in extreme temperatures.
Changes in extremes of heavy precipitation defined as the 20-year return value calculated from extreme value theory in the same way as outlined for temperature above are shown in figure4. The ensemble mean exhibits positive changes in almost all areas both in summer and winter, with amplitude ranging from 5% to about 15%. The increase is marked over Eastern Europe and Scandinavia in summer and over Southern Europe in winter. In contrast to this study, where no overall trend in extreme summer precipitation in Southern Europe is found, Kendon et al (2008) and Maraun (2013) found a decrease for extreme summer precipitation in this region. The difference in the findings might be related to the fact that the negative trend emerges relatively late and thus might not have emerged for some ensemble members when reaching the +2◦C period. It may also result from the way extremes are defined and the different sets of selected simulations, indicating a lack of robustness of a possible decrease.
The increases in heavy precipitation are an important factor with respect to flood risks, thus the increases in heavy precipitation found under the +2◦C scenario are likely to enhance the potential for these events. Floods are among the most important weather-related loss events in Europe and can have large economic consequences: the EEA (2010) reports total losses of over e50 billion over the past decade. The projected increase in Eastern Europe is a particular concern because this is one of the existing flood hot spots. Uncertainties remain large in the southernmost areas of Europe. Compared to the changes in seasonal means the changes in extremes are less spatially coherent and individual models exhibit patchy structures.
Environ. Res. Lett. R Vautard et al
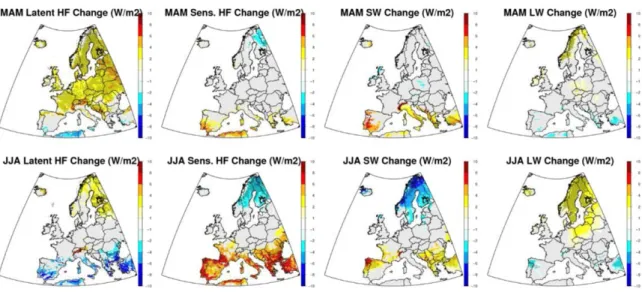
Figure 5. Changes, between the 1971–2000 and the +2◦C periods, in surface energy fluxes. Left panels: latent heat fluxes; second left panels: sensible heat fluxes; second right panels: net short-wave fluxes; right panels: net long-wave fluxes. Upper panels: MAM, Lower panels: JJA. Only areas with at least 12 models agreeing on change sign are colored. Areas where at least 14 models agree on change sign are highlighted with dots (except for temperature where almost all areas satisfy this).
Windstorms are also among the most damaging extreme events in Europe (ABI2005). Extreme winds are calculated here as the 99th percentile of the daily maximum 10-meter wind speed for each season (I99). Figure 4 (right panels) show the ensemble mean relative changes in I99 (in %) winds as simulated by the RCMs, in winter and summer. Robust increases of extreme winds of up to 10% are only seen over small scattered areas of Central/Eastern Europe in winter. Over most regions the change is generally positive but not robust.
7. Surface energy budget
Surface weather changes are influenced both by larger scale dynamical changes and by local changes in the physics of the vertical column above the surface. These latter changes are due to clouds, atmospheric composition, turbulence, soil moisture and temperature as well as land use properties. All these processes influence the surface energy budget (SEB), characterized by radiative and heat fluxes. Changes in the SEB are particularly important for driving changes in summer tem-perature and precipitation, which involve amplifying feedback processes (Seneviratne et al2010, Fischer et al2007). They also have impacts on drought changes, river discharge, water and energy resources, with important economic implications.
We consider net short- and long-wave fluxes, sensible and latent upward fluxes, only in spring (MAM) and summer (JJA) in order to analyze the evolution of heat fluxes across the growing season. Spatial patterns of latent and sensible heat flux changes are shown in figures 5(a)–(d). In spring, almost all models agree on an increase of latent heat except in southernmost areas and in other smaller areas such as North-Western coastal areas (this is also the case in fall and winter). This distribution is consistent with the energy-limited nature of evapotranspiration in Europe in spring (Teuling et al
2009). In summer, the latent heat increase is restricted to Northern areas while Southern areas, including large parts
of Central Europe, have decreasing latent heat due to drought increase and soil-moisture limitations. This drying causes an increase in sensible heat in summer in this area, with large model agreement, while over Scandinavia sensible heat fluxes decrease due to a wetter and cloudier climate. In spring, sensible heat flux only increases with high model agreement in the southernmost areas.
However, it is suspected that these fluxes are biased on ensemble average in the ENSEMBLES simulations. Stegehuis et al (2013) showed that several models in the ensemble have large evapotranspiration in the spring, which induces a dry, soil-moisture limited regime in summer, with large sensible heat flux accompanied by a low latent heat flux. This effect can lead to an overestimate of the ensemble mean changes and an underestimate of the inter-annual variability changes (Fischer et al2012). This could also contribute to the nonlinear temperature bias found in this dataset by Boberg and Christensen (2012), which probably induces an overestimation of mean summertime warming in Southern Europe.
Heat flux changes respond to the changes in net radiative fluxes (figure 5). In the two seasons a robust increase in short-wave radiation is found in Southern Europe and robust increase in long-wave radiation is found in Northern Europe. In summer, the short-wave radiation increase extends Northward over central Europe where drying, increase of sensible heat and temperature also occurs. This extension is consistent with the Northward propagation of drought and heat in the spring–summer transition described in Zampieri et al (2009). It is noteworthy that sea level pressure, however, does not exhibit an associated robust increase in anticyclonic weather over Mediterranean areas in summer, which could be due to compensation due to heating-induced thermal surface pressure lows. In Northern Europe, wetter and cloudier weather induces an increase in long-wave radiation.
Environ. Res. Lett.9 (2014) 034006 R Vautard et al 8. Conclusions
We have identified changes in European regional climate asso-ciated with a +2◦C global warming relative to pre-industrial climate. The +2◦C period was characterized using 30-year periods of an ensemble of global climate simulations of the SRES Scenario A1B, downscaled at a 25 km resolution by an ensemble of regional climate models (RCMs), simulations carried out in the framework of the FP6 ENSEMBLES project. The robustness of these changes has been quantified by mea-suring model agreement on the sign of the change and by assessing the statistical significance of the change.
The main characteristics of the changes in Europe ex-pected for a +2◦C global warming relative to a reference period of 1971–2000 are:
(1) Europe generally experiences higher warming than the global average, i.e. it will experience more than 2◦C of warming even if the 2◦C goal is achieved. There is also a strong distributional pattern of warming across Europe (and thus different countries). A warming over all European regions is found, with slightly weaker amplitude than the global warming over North-Western Europe but a more intense warming (up to +3◦C) in Northern and Eastern Europe in Winter and in Southern Europe in Summer.
(2) A robust increase of precipitation over Central and North-ern Europe in winter and only over NorthNorth-ern Europe in summer, while precipitation decreases in Central/Southern Europe in summer, with changes reaching 20%.
(3) A marked trend with an increased amplitude of up to more than 4◦C in the 20-year return value of the summer daily maximum and an even larger warming (up to more than 6◦C) over Scandinavia for extreme cold daily minima in winter.
(4) A robust increase in heavy precipitation everywhere and in all seasons, except Southern Europe in summer, with amplitudes in the range 0–20%.
(5) A modest and marginally robust increase in extreme winds in parts of Central Europe in winter, while in summer wind extremes changes are not robust.
(6) Sensible and latent heat flux changes have a strong sea-sonality with increasing (almost everywhere) evapotran-spiration in spring, while it decreases in Southern/Central Europe; sensible heat fluxes exhibit an opposite pattern with an even higher amplitude in Southern/Central Eu-rope; In summer fewer clouds in this area allow more intense net radiation input in this area. However models may overestimate evapotranspiration in spring, leading to an exaggerated drying and sensible heat flux increase in summer.
(7) The analysis also led us to conclude that a +2◦C change is, on average, approximately equivalent to a change for the 2031–2060 period in the A1B scenario. Choosing the time period reflecting a global mean change of +2◦C, however, reduces the spread in the results for temperature. A similar reduction in spread is not seen for other variables.
Many of the changes—in terms of the sign and magnitude of the change, and perhaps more importantly the spatial location and distributional pattern across Europe—will act to exacerbate existing and future impacts. For example, there is higher relative warming and greater relative increase in heat extremes in Southern Europe in summertime, which will drive heat and temperature-related impacts such as cooling costs and heat-related mortality. Similarly, there are higher relative (and more robust) signals for increased precipitation and heavy precipitation events in Eastern Europe along existing flood risk corridors, but lower projected summer rainfall in the Mediterranean, which will increase pressure on water resource management. There are some exceptions (e.g. higher winter warming in the north, with the benefit of reduced winter mortality and winter heating demand, though there would also be negative impacts on winter tourism and ecosystems in these regions). However, the general findings are that the distributional patterns of change across Europe are likely to drive geographically specific negative impacts. This is of policy relevance: even if the 2◦C goal is achieved, Europe will experience impacts, and these are likely to exacerbate existing climate vulnerability. Further work on identifying key hotspots, potential impacts and advancing carefully planned adaptation is therefore needed.
While it does not qualitatively affect the robust patterns of climate changes for temperature and precipitation, the bias correction may in some areas slightly modify the amplitude of temperature changes (e.g. Dosio et al2012). This was deduced from additional experiments (not reported here). Precipitation changes appear less sensitive to bias correction.
Acknowledgments
The research leading to these results has received funding from the European Union Seventh Framework Programme (FP7/2007–2013) under the project: IMPACT2C: Quantifying projected impacts under 2◦C warming, grant agreement no. 282746. The ENSEMBLES data used in this work was funded by the EU FP6 Integrated Project ENSEMBLES (Contract number 505539) whose support is gratefully acknowledged.
References
Association of British Insurers 2005 Financial Risks of Climate Change(London: Association of British Insurers)
www.abi.org.uk/climatechange
Baccini M et al 2008 Heat effects on mortality in 15 European cities Epidemiology19 711–9
Boberg F, Berg P, Thejll P, Gutowski W J and Christensen J H 2010 Improved confidence in climate change projections of
precipitation further evaluated using daily statistics from ENSEMBLES models Clim. Dyn.35 1509–20
Boberg F and Christensen J H 2012 Overestimation of
Mediterranean summer temperature projections due to model deficiencies Nature Clim. Change2 433–6
CEC 2005 Winning the Battle Against Global Climate Change, Brussels, 9.2.2005. COM(2005)35 Final(Brussels: Commission of the European Communities)
Environ. Res. Lett. R Vautard et al CEC 2007 Limiting Global Climate Change to 2 Degrees Celsius
The Way ahead for 2020 and beyond COM(2007)2(Brussels: Commission of the European Communities)
CEU 1996 Council of the European Union 1939th Council Meeting (Luxembourg, June 1996)
CEU 2004 Spring Council Meeting of the European Union, 2004 Christensen J H, Boberg F, Christensen O B and Lucas-Picher P
2008 On the need for bias correction of regional climate change projections of temperature and precipitation Geophys. Res. Lett. 35 L20709
Christensen J H, Carter T R, Rummukainen M and Amanatidis G 2007 Evaluating the performance and utility of regional climate models: the PRUDENCE project Clim. Change81 1–6 Coles S 2001 An Introduction to Statistical Modeling of Extreme
Values(London: Springer)
Collins M, Booth B B, Bhaskaran B, Harris G R, Murphy J M, Sexton D M H and Webb M J 2011 Climate model errors, feedbacks and forcings: a comparison of perturbed physics and multi-model ensembles Clim. Dyn.36 1737–66
D´equ´e M 2007 Frequency of precipitation and temperature extremes over France in an anthropogenic scenario: model results and statistical correction according to observed values Glob. Planet. Change57 16–26
D´equ´e M, Somot S, Sanchez-Gomez E, Goodess C M, Jacob D, Lenderink G and Christensen O B 2012 The spread amongst ENSEMBLES regional scenarios: regional climate models, driving general circulation models and interannual variability Clim. Dyn.38 951–64
Dosio A, Paruolo P and Rojas R 2012 Bias correction of the ENSEMBLES high resolution climate change projections for use by impact models: Analysis of the climate change signal J. Geophys. Res.-Atmos.117 D17110
Eden J M, Widmann M, Grawe D and Rast S 2012 Skill, correction, and downscaling of GCM-simulated precipitation J. Clim. 25 3970–84
EEA 2010 Mapping the impacts of natural hazards and technological accidents in Europe. An overview of the last decade EEA Technical Report No 13/2010. ISSN 1725-2237 EEA 2012 Climate change, impacts and vulnerability in Europe
2012 An indicator-based report (Copenhagen: EEA), 2012. www.eea.europa.eu/publications/climate-impacts-and-vulnerabili ty-2012(Accessed December 2013)
Fischer E M, Rajczak J and Sch¨ar C 2012 Changes in European summer temperature variability revisited Geophys. Res. Lett. 39 L19702
Fischer E M and Sch¨ar C 2010 Consistent geographical patterns of change in high-impact European heat waves Nature Clim. Change3 398–403
Fischer E M, Seneviratne S I, Luthi D and Sch¨ar C 2007 Contribution of land-atmosphere coupling to recent European summer heat waves Geophys. Res. Lett.34 L06707
Fox-Rabinovitz M, Cote J, Dugas B, Deque M, McGregor J L and Belochitski A 2008 Stretched-grid model intercomparison project: decadal regional climate simulations with enhanced variable and uniform-resolution GCMs Meteorol. Atmos. Phys. 100 159–77
Gudmundsson L, Bremnes J B, Haugen J E and Engen-Skaugen T 2012 Technical note: downscaling RCM precipitation to the station scale using statistical transformations—a comparison of methods Hydrol. Earth Syst. Sci.16 3383–90
Haylock M R, Hofstra N, Klein Tank A M G, Klok E J, Jones P D and New M 2008 A European daily high-resolution gridded data set of surface temperature and precipitation for 1950–2006 J. Geophys. Res.113 D20119
IPCC (1995) IPCC Second Assessment: Climate Change 1995. A Report of the Intergovernmental Panel on Climate Change. Full ReportPublished by the IPCCCwww.ipcc.ch/pdf/climate-chang es-1995/ipcc-2nd-assessment/2nd-assessment-en.pdf(Accessed December 2013)
IPCC 2001 Climate Change 2001: Synthesis Report. A Contribution of Working Groups I, II, and III to the Third Assessment Report of the Integovernmental Panel on Climate Changeed R T Watson and the Core Writing Team (Cambridge: Cambridge University Press) 398p
IPCC 2007 Summary for policymakers Climate Change 2007: Impacts, Adaptation and Vulnerability. Contribution of Working Group II to the Fourth Assessment Report of the
Intergovernmental Panel on Climate Changeed M L Parry, O F Canziani, J P Palutikof, P J van der Linden and C E Hanson (Cambridge: Cambridge University Press) pp 7–22
Jacob D and Podzun R 2010 Global warming below 2◦C relative to pre-industrial level: how might climate look like in Europe Nova Acta Leopoldina, NF71–6
Jacob D et al 2013 EURO-CORDEX: new high-resolution climate change projections for European impact research Reg. Environ. Change1–16 doi:10.1007/s10113-013-0499-2
Kendon E J, Rowell D P, Jones R G and Buonomo E 2008 Robustness of future changes in local precipitation extremes J. Clim.21 4280–97
Kjellstr¨om E, Nikulin G, Hansson U, Strandberg G and Ullerstig A 2011 21st century changes in the European climate: uncertainties derived from an ensemble of regional climate model simulations Tellus63 24–40
Kjellstr¨om E, Thejll P, Rummukainen M, Christensen J H, Boberg F, Christensen O and Band Fox Maule C 2013 Emerging regional climate change signals for Europe under varying large-scale circulation conditions Clim. Res.56 103–19
Kriegler E, Hall J W, Held H, Dawson R and Schellnhuber H J 2009 Imprecise probability assessment of tipping points in the climate system Proc. Natl Acad. Sci. USA106 5041–6
Lenton T M, Held H, Kriegler E, Hall J W, Lucht W, Rahmstorf S and Schellnhuber H J 2008 Tipping elements in the Earth’s climate system Proc. Natl Acad. Sci. USA105 1786–93
Levermann A et al 2012 Potential climatic transitions with profound impact on Europe: Review of the current state of six ‘tipping elements of the climate system’ Clim. Change110 845–78 Maraun D 2012 Nonstationarities of regional climate model biases
in European seasonal mean temperature and precipitation sums Geophys. Res. Lett.39 L06706
Maraun D 2013 When will trends in European mean and heavy daily precipitation emerge? Environ. Res. Lett.8 014004 Maraun D et al 2010 Precipitation downscaling under climate
change: recent developments to bridge the gap between dynamical models and the end user Rev. Geophys.48 RG3003 Meehl G A, Covey C, Delworth T, Latif M, McAvaney B,
Mitchell J F B, Stouffer R J and Taylor K E 2007 The WCRP CMIP3 multimodel dataset: a new era in climate change research Bull. Am. Meteorol. Soc.88 1383–94
Naki´cenovi´c N et al 2000 Emission scenarios, A Special Report of Working Group III of the Intergovernmental Panel on Climate Change(New York: Cambridge University Press) p 599 Nikulin G, Kjellstrom E, Hansson U, Strandberg G and Ullerstig A
2011 Evaluation and future projections of temperature, precipitation and wind extremes over Europe in an ensemble of regional climate simulations Tellus A63 14–55
Salas y M´elia D, Chauvin F, D´equ´e M, Douville H, Gu´er´emy J F, Marquet P, Planton S, Royer J F and Tyteca S 2005 Description and validation of CNRM-CM3 global coupled codel CNRM
Environ. Res. Lett.9 (2014) 034006 R Vautard et al Working Note103
(www.cnrm.meteo.fr/scenario2004/paper cm3.pdf)
Samuelsson P, Kourzeneva E and Mironov D 2010 The impact of lakes on the European climate as simulated by a regional climate model Boreal Environ. Res. 15 113–29
Seneviratne S I, Corti T, Davin E L, Hirschi M, Jaeger E B, Lehner I, Orlowsky B and Teuling A J 2010 Investigating soil moisture-climate interactions in a changing climate: a review Earth-Sci. Rev.99 125–61
Smith J B et al 2008 Assessing dangerous climate change through an update of the Intergovernmental Panel on Climate Change (IPCC) reasons for concern. 2008 Proc. Natl Acad. Sci. USA Early Edition.doi:10.1073/pnas.0812355106
Stegehuis A I, Vautard R, Ciais P, Teuling A J, Jung M and Yiou P 2013 Summer temperatures in Europe and land heat fluxes in observation-based data and regional climate model simulations Clim. Dyn.41 455–77
Taylor K E, Stouffer R J and Meehl G A 2012 An overview of CMIP5 and the experiment design Bull. Am. Meteorol. Soc. 93 485–98
Tebaldi C, Arblaster J M and Knutti R 2011 Mapping model agreement on future climate projections Geophys. Res. Lett. 38 L23701
Teuling A J et al 2009 A regional perspective on trends in continental evaporation Geophys. Res. Lett.36 L02404 Themeßl M J, Gobiet A and Heinrich G 2012 Empirical-statistical
downscaling and error correction of regional climate models and its impact on the climate change signal Clim. Change 112 449–68
Themeßl M J, Gobiet A and Leuprecht A 2011 Empirical-statistical downscaling and error correction of daily precipitation from regional climate models Int. J. Climatol.31 1530–44
UNFCCC 1992 United Nations Framework Convention on Climate Change: Full Text of the Conventionhttp://unfccc.int/essential ba ckground/convention/background/items/1353.php(Accessed December 2013)
UNFCCC 2010 The Cancun Agreements. United Nations
Framework Convention on Climate Changehttp://unfccc.int/meet ings/cancun nov 2010/meeting/6266.php(Accessed December 2013)
van der Linden P and Mitchell J B (ed) 2009 ENSEMBLES: Climate Change and its Impacts: Summary of Research and Results From the ENSEMBLES Project(Exeter: Met Office Hadley Centre) 160pp
WBGU 1995 Scenario zur Ableitung CO2-Reduktionsziele und Umsetzungsstrategien—Stellungnahme zur ersten
Vertragsstaatenkonferenz der Klimarahmenkonvention in Berlin (Scenario to Deduct CO2 Reduction Targets und Implementation Strategies–Position for the First Conference of the Parties of the Framework Convention on Climate in Berlin), Wissenschaftlicher Beirat der Bundesregierung Globale Umweltver¨anderungen, Dortmund
Wilcke R A I, Mendlik T and Gobiet A 2013 Multi-variable error correction of regional climate models Clim. Change120 871–87 Zampieri M, D’Andrea F, Vautard R, Ciais P,
de Noblet-Ducoudre N and Yiou P 2009 Hot European summers and the role of soil moisture in the propagation of Mediterranean drought J. Clim.22 4747–58