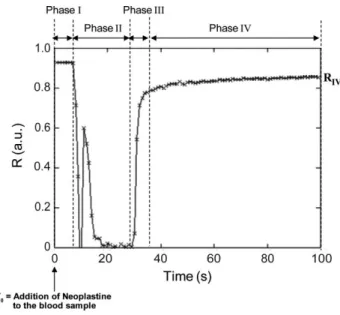
Coagulation dynamics of a blood sample by multiple scattering analysis
Texte intégral
Figure


Documents relatifs
The second contribution of this work is an algorithm, developed with CAES, capable of detecting human activity transitions in office-like environments using a heart
chromosomal distances observed in H2A-S129E mutant when treated with Zeocin since the 416 .. global level of H4 was not affected in undamaged H2A-S19E cells, but
Cette hypothèse est tout à fait en accord avec la carte structurale L'interprétation des sondages électriques étalonnés avec des forages profonds a
Quels sont les deux particularités d’une guerre mondiale d’après le message?. Que doivent donc faire les français
A number of hybrid methods use the continuous concept to model blood flow and propagation of blood factors in it, while the discrete concept is used to model blood cells and
In the current work we con- sider a mathematical model of the coagulation cascade and study existence, stability and speed of propagation of the reaction-diffusion waves of
the above-mentioned gap between the lower bound and the upper bound of RL, guarantee that no learning method, given a generative model of the MDP, can be significantly more
Prévalence de l’ostéoporose primitive chez l’homme de 60 ans et plus non institu- tionnalisé en Lorraine en 2006: évolution prévisible du nombre de cas en France entre 2006 et
