HAL Id: hal-01099185
https://hal.inria.fr/hal-01099185
Submitted on 31 Dec 2014
HAL is a multi-disciplinary open access
archive for the deposit and dissemination of
sci-entific research documents, whether they are
pub-lished or not. The documents may come from
teaching and research institutions in France or
abroad, or from public or private research centers.
L’archive ouverte pluridisciplinaire HAL, est
destinée au dépôt et à la diffusion de documents
scientifiques de niveau recherche, publiés ou non,
émanant des établissements d’enseignement et de
recherche français ou étrangers, des laboratoires
publics ou privés.
Detection of volume loss in hippocampal layers in
Alzheimer’s disease using 7 T MRI: a feasibility study
Claire Boutet, Marie Chupin, Stéphane Lehéricy, Linda Marrakchi-Kacem,
Stéphane Epelbaum, Cyril Poupon, Christopher Wiggins, Alexandre Vignaud,
Dominique Hasboun, Bénédicte Defontaines, et al.
To cite this version:
Claire Boutet, Marie Chupin, Stéphane Lehéricy, Linda Marrakchi-Kacem, Stéphane Epelbaum, et
al.. Detection of volume loss in hippocampal layers in Alzheimer’s disease using 7 T MRI: a feasibility
study. Neuroimage-Clinical, Elsevier, 2014, 5, pp.341-8. �hal-01099185�
Detection of volume loss in hippocampal layers in Alzheimer
3s disease
using 7 T MRI: A feasibility study
Claire Boutet
a,c,d,e,f,g,h, Marie Chupin
a,c,d,e,f, Stéphane Lehéricy
a,c,d,e,g,h, Linda Marrakchi-Kacem
a,c,d,e,f,
Stéphane Epelbaum
a,c,d,e,k, Cyril Poupon
b, Christopher Wiggins
b, Alexandre Vignaud
b,
Dominique Hasboun
a,c,d,e,f,g, Bénédicte Defontaines
i, Olivier Hanon
j,n, Bruno Dubois
a,c,d,e,k, Marie Sarazin
l,
Lucie Hertz-Pannier
b,m, Olivier Colliot
*,a,c,d,e,fa
Sorbonne Universités, Université Pierre et Marie Curie, Paris6, Institut du Cerveau et de la Moelle épinière (ICM), UM 75, 75013 Paris, France
b
NeuroSpin, I2BM, DSV, CEA, Gif-sur-yvette, France
c
Inserm, U1127 ICM, Paris 75013, France
dCNRS, UMR 7225 ICM, Paris 75013, France
eICM— Institut du Cerveau et de la Moelle épinière, Paris 75013, France f
INRIA, Aramis Team, Centre de Recherche Paris-Rocquencourt, France
g
AP-HP, Groupe Hospitalier Pitié-Salpêtrière, Département de Neuroradiologie, Groupe Hospitalier Pitié-Salpêtrière, Paris 75013, France
h
Centre de Neuroimagerie de Recherche— CENIR, 75013 Paris, France
i
Réseau Mémoire Aloïs, Paris, France
j
AP-HP, Hôpital Broca, Service de Gérontologie, Paris, France
kDepartment of Neurology, Institut de la Mémoire et de la Maladie d3Alzheimer - IM2A, Groupe Hospitalier Pitié-Salpêtrière, 75013 Paris, France l
Unité de Neurologie de la Mémoire et du Langage, Service de Neurologie, Université Paris Descartes, Sorbonne Paris Cité, INSERM UMR S894, Centre Hospitalier Sainte Anne, Paris, France
m
UMR 1129, INSERM; CEA; Université Paris Descartes, Paris, France
n
Université Paris Descartes, Sorbonne Paris Cité, EA, Paris 4468, France
a b s t r a c t
a r t i c l e i n f o
Article history: Received 28 March 2014
Received in revised form 7 July 2014 Accepted 25 July 2014
Available online 31 July 2014 Keywords: Alzheimer3s disease Human 7 T MRI Hippocampus Hippocampal layers Segmentation Volumetry
In Alzheimer3s disease (AD), the hippocampus is an early site of tau pathology and neurodegeneration. Histolog-ical studies have shown that lesions are not uniformly distributed within the hippocampus. Moreover, alterations of different hippocampal layers may reflect distinct pathological processes. 7 T MRI dramatically improves the vi-sualization of hippocampal subregions and layers. In this study, we aimed to assess whether 7 T MRI can detect volumetric changes in hippocampal layers in vivo in patients with AD. We studied four AD patients and seven control subjects. MR images were acquired using a whole-body 7 T scanner with an eight channel transmit– receive coil. Hippocampal subregions were manually segmented from coronal T2*-weighted gradient echo images with 0.3 × 0.3 × 1.2 mm3resolution using a protocol that distinguishes between layers richer or poorer
in neuronal bodies. Five subregions were segmented in the region of the hippocampal body: alveus, strata radiatum, lacunosum and moleculare (SRLM) of the cornu Ammonis (CA), hilum, stratum pyramidale of CA and stratum pyramidale of the subiculum. We found strong bilateral reductions in the SRLM of the cornu Ammonis and in the stratum pyramidale of the subiculum (pb 0.05), with average cross-sectional area reductions ranging from−29% to −49%. These results show that it is possible to detect volume loss in distinct hippocampal layers using segmentation of 7 T MRI. 7 T MRI-based segmentation is a promising tool for AD research.
© 2014 The Authors. Published by Elsevier Inc. This is an open access article under the CC BY-NC-ND license (http://creativecommons.org/licenses/by-nc-nd/3.0/).
1. Introduction
The hippocampal formation is an early site of Alzheimer3s disease
(AD) pathology (Braak and Braak, 1991). Hippocampal atrophy is a
well-established imaging marker of Alzheimer3s disease and has been
included in recently proposed research diagnostic criteria (Albert
et al., 2011;Dubois et al., 2007;Jack et al., 2011). Hippocampal atrophy can be measured from T1-weighted magnetic resonance imaging (MRI), using manual or automated segmentation (Colliot et al., 2008;Jack et al., 1992; Lehéricy et al., 1994) which provides an estimate of the
Abbreviations: AD, Alzheimer3s disease; 7 T, 7 Tesla; MRI, magnetic resonance imag-ing; SRLM, strata radiatum, lacunosum and moleculare; CA, cornu Ammonis; DG, dentate gyrus; SP, stratum pyramidale; CN, cognitively normal.
* Corresponding author at: ICM— Brain and Spinal Cord Institute, Pitié-Salpêtrière, Hospital, 47-83, Boulevard de l3Hôpital, 75651 Paris Cedex 13, France.
E-mail address:olivier.colliot@upmc.fr(O. Colliot).
http://dx.doi.org/10.1016/j.nicl.2014.07.011
2213-1582/© 2014 The Authors. Published by Elsevier Inc. This is an open access article under the CC BY-NC-ND license (http://creativecommons.org/licenses/by-nc-nd/3.0/).
Contents lists available atScienceDirect
NeuroImage: Clinical
hippocampal volume. Hippocampal volume can discriminate AD pa-tients from elderly controls with high sensitivity and specificity as dem-onstrated by numerous studies (Jack et al., 1992;Jack et al., 1997;
Killiany et al., 1993;Laakso et al., 1996;Xu et al., 2000). Traditionally, hippocampal volumetry considers the hippocampus as a single anatomi-cal entity and thus only provides a global volumetric measure. However, the hippocampal formation is an anatomically complex structure which is composed of different subregions (Duvernoy, 2005). It is made of two convoluted sheets of gray matter that are folded one onto another: the cornu Ammonis (CA) and the dentate gyrus (DG). The cornu Ammonis is further composed of four sectors: CA1–4. CA1 is the largest sector and is continuous to the subiculum. Furthermore, subregions are composed of different layers that vary in terms of cellular composition. The stratum pyramidale (SP) is richer in neuronal bodies while the strata radiatum, lacunosum and moleculare (SRLM) are poorer in neuronal bodies.
In Alzheimer3s disease, histological studies have shown that lesions are not uniformly distributed within hippocampal subregions. Neuro fi-brillary tangles, neuronal loss and decrease in synaptic density are dom-inant in thefirst sector of the cornu Ammonis (CA1) and the subiculum, the dentate gyrus being relatively spared (Fukutani et al., 1995;Hyman et al., 1984;Rössler et al., 2002;Scheff et al., 2007;Simić et al., 1997;
West et al., 1994). Neuronal loss results in a reduction of the thickness of the layers richer in neuronal bodies, while the loss of synapses results in the reduction of the layers poorer in neuronal bodies (Braak and Braak, 1997;Lace et al., 2009;Thal et al., 2000). Histological studies have suggested that synaptic loss in SRLM could occur earlier than neu-ronal loss in SP (Braak and Braak, 1997;Fukutani et al., 1995;Hyman et al., 1984;Rössler et al., 2002;Thal et al., 2000). In vivo measurement of hippocampal layers would thus be of major interest for AD research. In the past years, several studies have analyzed volumes of hippo-campal subregions in patients with AD and mild cognitive impairment
(MCI), based on advances of high-field MRI (La Joie et al., 2013;
Mueller et al., 2010;Pluta et al., 2012). Most studies were based on T2-weighted or proton-density weighted sequences with about 0.4 mm in plane coronal resolution and 2 mm slice thickness, performed at 3 T or 4.7 T. They have reported volume reductions in different subre-gions, including the subiculum (La Joie et al., 2013;Mueller et al., 2010), CA1 (La Joie et al., 2013;Mueller et al., 2010;Pluta et al., 2012) and the dentate gyrus (Pluta et al., 2012).
7 T MRI provides new contrasts, increased signal-to-noise ratio and higher spatial resolution which dramatically improve the visualization
of hippocampal subregions (Theysohn et al., 2009). Using 7 T MRI,
Kerchner et al. (2010)found atrophy of the strata radiatum, lacunosum and moleculare (the layers poorer in neuronal bodies) in AD patients. However, they used linear measurements of thickness at selected points and did not perform subregional segmentation.Wisse et al. (2012)have proposed a new manual segmentation protocol for hippocampal subre-gions at 7 T and subsequently applied this protocol to AD patients (Wisse et al., 2014). However, the protocol did not distinguish between layers richer and poorer in neuronal bodies.Chupin et al. (2009)and
Henry et al. (2011)have performed segmentation of subregions at 7 T, using a protocol distinguishing between layers poorer and richer in neu-ronal bodies, in healthy subjects and patients with temporal lobe epilepsy. The purpose of our study was to assess if 7 T MRI-based segmenta-tion can detect volume loss of hippocampal layers in patients with AD compared to control subjects.
2. Materials and methods 2.1. Participants
The regional ethics committee approved this prospective study and written informed consent was obtained from all participants. We stud-ied four AD patients (3 men, 1 woman; mean age ± standard deviation [SD]: 65.8 ± 7.0 years, range: 60–76 years, Mini Mental State
Examina-tion [MMSE] score: 19.0 ± 5.1, range: 13–25) and seven cognitively
normal (CN) participants (3 men and 4 women; age: 63.1 ± 5.6 years,
range: 55–72 years; MMSE score: 29.1 ± 1.1, range: 27–30). The two
groups did not differ for age (Mann–Whitney U test, p = 0.5) and gen-der (Chi-square test,χ2= 0.25, 1df, p = 0.62). AD patients were
re-quired to meet the criteria of the National Institute of Neurological Disorders and Stroke and Alzheimer3s Disease and Related Disorders As-sociation for mild to moderate AD (McKhann et al., 1984) with a CDR (Clinical Dementia Rating Scale) of 1.0 or more and an IADL score (In-strumental Activities of Daily Living) of more than 1 for each item or more than 2 for one item. The criteria for the inclusion of cognitively normal subjects were: the absence of memory complaint, normal scores for MMSE, normal scores for tests of executive functions and normal
memory performance defined as a free recall score of 25/48 or more
and a total recall score of more than 44/48 in the Free and Cued Selective Reminding Test (FCSRT). Subjects with recent cardiovascular disease (less than 1 year), neurological or psychiatric disease (except for AD) or focal lesion on brain MRI were excluded. Demographic and clinical characteristics of the participants are given inTable 1.
2.2. MRI acquisition
Imaging was performed on a whole-body 7 T scanner (Magnetom 7 T, Siemens Healthcare, Erlangen, Germany) with an eight channel
transmit–receive coil. The acquisition protocol included a 3D
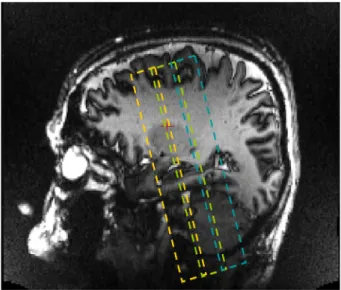
T1-weighted magnetization prepared rapid gradient echo (MP-RAGE) ac-quisition covering the whole brain and a T2*-weighted 2D gradient echo (GRE) coronal acquisition covering the hippocampal formation. The T2*-weighted 2D gradient echo was composed of three acquisition slabs (Fig. 1). It was angulated perpendicular to the longitudinal axis of the hippocampus, as visualized on a parasagittal view of the 3D T1 se-quence. Acquisition parameters of each sequence are presented in
Table 2. Prior to the study, we performed several pilot acquisitions
with different resolution and sequence parameters, with a specific
study of the influence of GRE echo time (from about 10–45 ms) on con-trast and visibility of the different layers and on the presence of artifacts in the structure of interest. We chose the two echo times that maxi-mized contrast while keeping a reasonable acquisition time.
2.3. Segmentation of hippocampal subregions
Manual segmentation of subregions within the hippocampal body was performed by a trained rater (CB), blinded to clinical data and diag-nosis. The rater (C.B.) is a neuroradiologist with 3 years of experience in neuroradiology at the time when the segmentations were carried out. She had previous experience of hippocampal segmentation and was
specifically trained to the neuroanatomy of hippocampal subregions
and their segmentation on MRI data. Segmentation was performed on the longer echo T2*-weighted images of the second acquisition slab
and external borders of hippocampal subregions were refined on the
first echo. Each slice was visually inspected and the visibility of the
Table 1
Demographic and clinical characteristics of the population.
Subject no. Group Gender Age MMSE CDR
1 CN F 68 30 0 2 CN F 55 30 0 3 CN F 72 29 0 4 CN F 62 27 0 5 CN M 61 29 0 6 CN M 61 30 0 7 CN M 63 29 0 8 AD M 60 25 1 9 AD M 76 21 2 10 AD M 63 17 1 11 AD M 64 13 2
CN = Cognitively normal subjects, AD = Alzheimer3s disease patients. F = Female, M = male. Age is in years.
internal structure was judged sufficient to allow manual segmentation, not masked by the movement and artifacts nor by the loss of signal.
Fig. 2presents, in a single representative AD subject, the complete set of slices of the second slab used to define hippocampal layers. Segmen-tation was done using the object-based ROI module of the Anatomist software (http://www.brainvisa.info/index.html). The hippocampal head and tail were not segmented because the more complex shape of these structures posed difficulties in labeling procedures that were dif-ficult to solve with the GRE images, susceptibility artifacts yielding more blurred borders in the head of the hippocampus.
Manual segmentation of hippocampal body subregions was per-formed using the following protocol, extending the one proposed by
Henry et al. (2011). The hippocampal body was subdivided infive sub-regions based on the anatomy described byDuvernoy (2005). The fol-lowing subregions were sequentially segmented. (1) Alveus. (2) SRLM corresponding to the strata radiatum, lacunosum and moleculare of CA1–3, the strata lacunosum and moleculare of the subiculum and the stratum moleculare of the dentate gyrus (DG). This corresponds to the layers poorer in neuronal bodies. (3) Hilum corresponding to the stratum pyramidale of CA4 and the stratum granulosum and poly-morphic layer of DG, which are the layers richer in neuronal bodies. (4) Cornu Ammonis Stratum Pyramidale (CA_SP), assumed to corre-spond to the stratum pyramidale of CA1–3, layers richer in neuronal
bodies of CA1–3. (5) Subiculum_SP corresponding to the stratum
pyramidale of the subiculum, layers richer in neuronal bodies of
the subiculum. Thefimbria was not considered here, due to the
dif-ficulties in discriminating it from blood vessels on T2* weighted images.
Anterior and posterior limits of the segmented region in the
hippo-campal body were defined on coronal sections, with reference mainly
to sagittal sections to ensure 3D consistency. Thefirst slice considered
for the segmentation was chosen as thefirst slice posterior to the
uncus. The posterior slice of the segmentation was the last slice of the middle slab. Thefive subregions were then segmented as follows. 1. Alveus. The superior medial border of the alveus was set at the point
where CA merges within the hilum; its inferior lateral border was at the junction with the collateral eminence of the lateral ventricle. 2. SRLM. The superior medial border of SRLM was straightforward to
define as the point where CA revolved around it to enter the hilum; its inferior medial border corresponded to the point where the parahippocampal gyrus bulged upwards and changed slope.
3. Hilum. The superior medial border of the hilum was the
fimbrio-dentate sulcus; its superior border was defined by drawing an imag-inary line between the superior medial borders of the alveus and SRLM, and could be described as the end of the ribbon-like aspect of CA; its inferior lateral border was formed by SRLM; its medial bor-der was defined by the cerebro-spinal fluid in the cisterna ambiens. 4. CA_SP. CA_SP was delineated between the alveus and SRLM. Its supe-rior border was determined by the hilum; its infesupe-rior medial border was defined as follows: first by tracing the largest diameter of the hilum, then by tracing a line perpendicular to the CA axis passing by the medium of the hilum diameter. This perpendicular line was the infero-medial border of CA_SP.
5. Subiculum_SP. The medial limit corresponded to that of SRLM; the superior border was SRLM; its inferior border was the temporal white matter.
2.4. Comparison to linear measurement of hippocampal subregions For comparison with volumetric measures, we also performed man-ual linear measurements of thickness, as inKerchner et al. (2010)for
SRLM, CA_SP and Subiculum_SP. WhileKerchner et al. (2010)measured
SRLM and CA_SP, we chose to also measure thickness of Subiculum_SP
for comparison with our volumetric measurements of this specific
structure. Linear measurements were made by the same rater (CB), blind to manual segmentation, using Dicom Viewer 2.0 software (Rubo Medical Imaging, the Netherlands) on the longer echo T2*-weighted images of the second acquisition slab. Linear measures were performed using the following procedure that was chosen as close as possible to that ofKerchner et al. (2010). Thickness was measured by drawing an orthogonal line between two tissue plane interfaces. Six lin-ear measurements were made for each side and for each subregion, on two different slices at the level of red nucleus (three measurements on each slice for each subregion). We chose two slices separated from each other by 2.4 mm and not adjacent slices since the slice thickness (1.2 mm) of our acquisitions was different from that ofKerchner et al. (2010)(2 mm). This allows to have a distance between the two slices which is as close as possible to that ofKerchner et al. (2010). For each subregion and each side, we computed the average of the 6 linear measurements.
2.5. Statistical analysis
We normalized the volume of each subregion to the ipsilateral body length, resulting in measures of average cross-sectional area. Group differences in subregional areas between AD and CN subjects were
assessed using Mann–Whitney U tests. Group differences in linear
thickness measures were also assessed using Mann–Whitney U tests.
Fig. 1. Illustration of the positioning of the three acquisition slabs of the T2*-weighted GRE sequence, based on a T1-weighted parasagittal view. The last posterior slice of thefirst acquisition slab was positioned on the last slice of the head of the hippocampus. The first acquisition slab is represented in orange, the second in green and the third in blue.
Table 2
MRI acquisition protocol.
Sequence Acquisition plane and coverage Number of slices Field of view Matrix Acquisition time Flip angle TR/TE/TI (ms) Resolution (mm) MP-RAGE Sagittal - Head 176 230 × 230 256 × 256 11 min 6° 2640/3.28/1100 0.9 × 0.9 × 0.9 2D T2* GRE Coronal - Hippocampal formation 3 × 15 173 × 100 576 × 576 3 × 7 min 65° 742/16.41 (TE1); 33.22 (TE2) 0.3 × 0.3 × 1.2 MP-RAGE = Magnetization prepared rapid gradient echo; GRE = gradient recalled echo; TR/TE/TI = repetition time/echo time/inversion time.
Correlation between average cross-sectional area and linear
measure-ments was assessed using Spearman3s rank correlation coefficient.
Significance threshold was set at p b 0.05. Statistical analyses were per-formed by C.B. using MedCalc for Windows, version 12.2.1 (MedCalc Software, Mariakerke, Belgium).
3. Results
Segmentation of hippocampal subregions was feasible in all partici-pants. Examples of T2*-weighted acquisitions and segmented hippo-campal subregions are presented onFigs. 3 and 4.
3.1. Volumetric measurement of hippocampal subregions
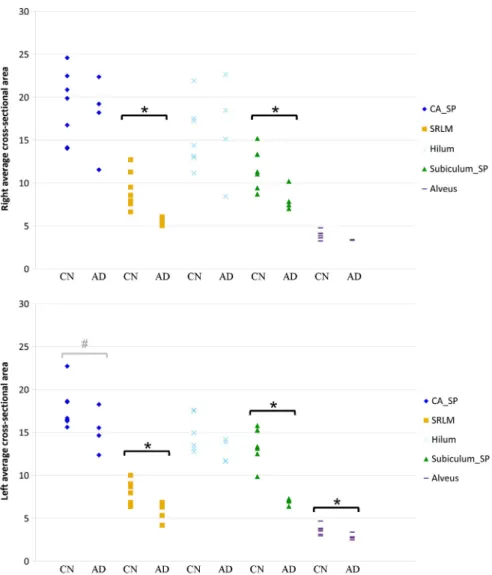
Average subregional cross-sectional areas are presented inTable 3. Individual measures are presented onFig. 5. We found strong and signif-icant (pb 0.05) bilateral reductions of SRLM and Subiculum_SP in AD patients compared to CN subjects. For left Subiculum_SP, there was no overlap between patients and controls. The alveus area was significantly smaller on the left in AD patients. There was a trend towards reduction of left CA_SP area (p = 0.058).
3.2. Comparison to linear measurement of hippocampal subregions In CN subjects, left and right average linear measurements were respectively mean ± standard deviation = 0.69 ± 0.08 mm and 0.64 ± 0.09 mm for SRLM, 1.61 ± 0.39 mm and 1.69 ± 0.19 mm for CA_SP and 1.76 ± 0.5 mm and 1.74 ± 0.23 for Subiculum_SP. In AD subjects, left and right average linear measurements were re-spectively 0.45 ± 0.04 mm and 0.49 ± 0.08 mm for SRLM, 1.17 ±
0.12 mm and 1.29 ± 0.29 mm for CA_SP and 1.09 ± 0.16 mm and 1.18 ± 0.27 for Subiculum_SP. Bilaterally, SRLM and Subiculum_SP
were significantly thinner in AD patients compared to CN subjects
(pb 0.05). Left CA_SP was also significantly thinner (p b 0.05). Average cross-sectional areas of SRLM, CA_SP and Subiculum_SP correlated signif-icantly (pb 0.05) with linear measurements except for the right SRLM (p = 0.0710).
4. Discussion
In this study, we demonstrated the feasibility of measuring volumet-ric alterations of the hippocampal inner structure in AD patients using ultra-high resolution MRI at 7 T. In particular, we were able to dis-tinguish in vivo layers which are richer in neuronal bodies (stratum
pyramidale— SP) from those which are poorer (strata radiatum,
lacunosum and moleculare— SRLM).
We found strong significant bilateral atrophy of the SP of the
subiculum and of SRLM. The largest reduction was found in the left subiculum, reaching an average of 49%. Subiculum atrophy has been previously reported in subregional segmentation studies at 4.7 T (Mueller et al., 2010) and 3 T (La Joie et al., 2013;Wisse et al., 2014). Very recently, a 7 T MRI study reported subiculum and CA atrophy in AD patients (Wisse et al., 2014). Consistently, histological studies report large numbers of neurofibrillary tangles and important neuronal loss in the subicular area (Hyman et al., 1984;Rössler et al., 2002;Simić et al., 1997).
We found a strong bilateral atrophy of SRLM. Dominant atrophy of SRLM is consistent with histological knowledge which described a pri-mary degeneration of synapse-rich CA1 SRLM which precedes neuronal
Fig. 2. Coronal slices of a TE2 T2*-weighted acquisition in a single AD patient: complete set of slices of the second slab used to define hippocampal layers, in an anterior-to-posterior direction from a to i.
loss of CA1 SP (Braak and Braak, 1997;Fukutani et al., 1995;Hyman et al., 1984;Rössler et al., 2002;Thal et al., 2000). Synaptic loss in CA1 SRLM would be due to aggregates of microtubule-associated hyperphosphorylated tau-protein, and would appear earlier than pyra-midal neuron loss, due to neurofibrillary tangles formation, localized in CA1 SP (Braak and Braak, 1997;Fukutani et al., 1995;Hyman et al., 1984;Rössler et al., 2002;Thal et al., 2000). To our knowledge, only Kerchner et al. (Kerchner et al., 2014;Kerchner et al., 2013;Kerchner et al., 2010) have previously measured SRLM in vivo in AD patients, initially on T2*-weighted gradient echo acquisitions with line drawings (Kerchner et al., 2010), then on T2 Fast Spin Echo using a semi-automated edge-detection algorithm to integrate SRLM
width (Kerchner et al., 2014; Kerchner et al., 2013; Kerchner et al.,
2012). They also found a significant atrophy of SRLM (Kerchner
et al., 2010). Furthermore, SRLM atrophy was stronger in APOEε4 carriers (Kerchner et al., 2014) and shared vulnerability with the en-torhinal cortex (Kerchner et al., 2013). The in-plane resolution in
our study is less high (0.3 mm) than that ofKerchner et al. (2010)
(0.195 mm) and our AD patients are at a later disease stage (mean MMSE: 19 vs 23). However, our slice thickness is smaller (1.2 mm) than that ofKerchner et al. (2010)(2 mm) resulting in less partial volume effect and allowing a better delineation of the limits during the segmentation. To further assess the agreement between our
re-sults and those of Kerchner et al. (2010), we compared our
Fig. 3. Coronal slices of a T2×−weighted acquisition (first echo TE1 and second echo TE2) in a CN subject and an AD patient at the level of the hippocampal body and corresponding segmentations. Segmentations were performed on the second echo image. Purple, alveus; dark blue, CA_SP; yellow, SRLM; cyan, hilum and green, subiculum_SP. Abbreviations: CA_SP = stratum pyramidale of CA1–3; SRLM = strata radiatum, lacunosum and moleculare of CA1–3, strata lacunosum and moleculare of the subiculum and stratum moleculare of gyrus dentatus; hilum = stratum pyramidale of CA4 and stratum granulosum and polymorphic layer of gyrus dentatus; subiculum_SP = stratum pyramidale of the subiculum. CN = cognitively normal, AD = Alzheimer3s disease.
volumetric measures to manual linear measurements. We found that volumetric and linear measures were in strong agreement.
We did notfind a significant atrophy of the stratum pyramidale of
CA, even though there was a trend towards reduction on the left. This result is also in line withKerchner et al. (2010)which did notfind atro-phy of CA SP. On the other hand, several studies at lowerfield strength (3 T/4.7 T) have found atrophy of CA1 and/or CA1–2 transition in AD pa-tients (La Joie et al., 2013;Mueller et al., 2010;Pluta et al., 2012). Several factors may explain this difference with our results: smaller number of patients in our study, the fact that studies at 3 T/4.7 T did not distinguish between SP and SRLM and the fact that we did not separate CA1 from other CA sectors. Separation of CA1 from other sectors is often based on geometrical criteria (e.g.Mueller et al., 2007; La Joie et al., 2010). We did not use this strategy, in order to minimize the number of arbi-trary geometrical limits. Another option is to define the limit of CA1 based on the thinning of the stratum pyramidale, as inKerchner et al. (2012). Indeed, according toDuvernoy (2005), the limit between CA1 and CA2 corresponds to a thinning of the stratum pyramidale and a thickening of the stratum moleculare. We assessed the possibility of identifying this limit (thinning of SP) in our data but this identification did not prove to be reliable, in particular in AD patients. For these rea-sons, we decided not to subsegment CA.
In the past years, substantial progresses have been made for in vivo measurement of hippocampal subregions in AD. Thefirst studies of sub-regional hippocampal atrophy in AD have relied on local shape analysis of the external hippocampal boundary, based on various techniques
including deformation-based (Csernansky et al., 2000;Wang et al., 2006), radial mapping (Frisoni et al., 2008;Thompson et al., 2004), voxel-based (Chételat et al., 2008) and spherical harmonics (Gerardin et al., 2009) approaches. However, these approaches do not segment hippocampal subregions and the localization of the detected local atro-phy with respect to different subfields relies on approximate mapping to a template. More recently, using advances of high-field MRI, several studies have shown that it is possible to detect atrophy of hippocampal subregions in AD and MCI patients based on T2-weighted or
proton-density-weighted sequences at 3 T or 4.7 T (La Joie et al., 2013;
Mueller et al., 2010;Pluta et al., 2012). 7 T MRI pushes even further the ability to measure subtle anatomical alterations of hippocampal subregions (Chupin et al., 2009;Henry et al., 2011;Kerchner et al., 2014;Kerchner et al., 2010;Thomas et al., 2008;Wisse et al., 2014;
Wisse et al., 2012). In particular, it allows distinguishing between layers depending on their richness in neuronal bodies. In this work, we show that 7 T MRI reveals atrophy patterns in different subregions in AD patients.
Our study has the following limitations. First, only few patients were included, resulting in limited statistical power. It is thus pos-sible that volume reductions in other subregions such as the hilum,
alveus or CA_SP would have been significant with a larger patient
group. A related limitation is that we did not correct for multiple comparisons corresponding to the different segmented regions.
However, one can note that most other studies (Wisse et al.,
2014; Kerchner et al., 2010; Pluta et al., 2012; Mueller et al., 2010; La Joie et al., 2013) of hippocampal subfield volumetry did not correct for multiple comparisons either. Furthermore, a larger patient group is required to establish the sensitivity and specificity of these new measurements at the individual level. Another limita-tion is that we did not assess reproducibility of volumetric mea-sures because the manual segmentation procedure is highly time consuming. These limitations underline the preliminary nature of
ourfindings.
In conclusion, we were able to detect atrophy in distinct hippocam-pal layers in AD patients. 7 T MRI-based segmentation of hippocamhippocam-pal layers is a promising new technique for AD research and future investi-gations in that direction are worthwhile.
Disclosure statement
Competingfinancial interests related to the present article: none to disclose for all authors. Competingfinancial interests unrelated to the present article. OC reports having received lecture fees from Lundbeck and consulting fees from Guerbet.
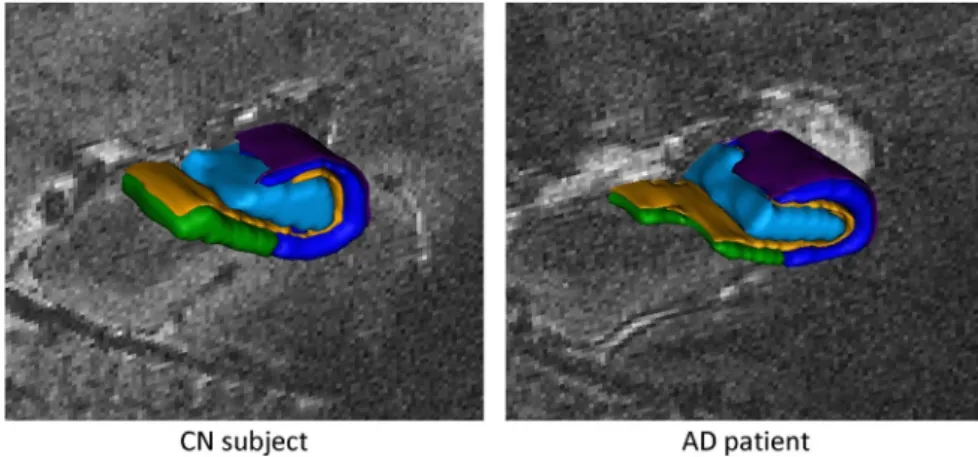
Fig. 4. Three-dimensional renderings of the segmentations. Purple, alveus; dark blue, CA_SP; yellow, SRLM; cyan, hilum and green, subiculum_SP. Abbreviations: CA_SP = stratum pyramidale of CA1–3; SRLM = strata radiatum, lacunosum and moleculare of CA1–3, strata lacunosum and moleculare of the subiculum and stratum moleculare of gyrus dentatus; hilum = stratum pyramidale of CA4 and stratum granulosum and polymorphic layer of gyrus dentatus; subiculum_SP = stratum pyramidale of the subiculum. CN = cognitively normal, AD = Alzheimer3s disease.
Table 3
Mean average cross-sectional area of hippocampal body subregions (volume normalized to the ipsilateral hippocampal body length) (data are means ± standard deviations, in mm2
).
AD (n = 4) CN (n = 7) Right Left Right Left CA_SP 17.8 ± 4.6 (−6%) 15.2 ± 2.4** (−15%) 18.9 ± 4.1 17.9 ± 2.4 SRLM 5.6 ± 0.5* (−39%) 5.7 ± 1.2* (−29%) 9.2 ± 2.2 7.9 ± 1.3 Hilum 16.2 ± 6.0 (−4%) 12.9 ± 1.4 (−14%) 15.5 ± 3.7 14.9 ± 2.0 Subiculum_SP 8.1 ± 1.4* (−31%) 6.9 ± 0.4* (−49%) 11.8 ± 2.3 13.6 ± 2.1 Alveus 3.4 ± 0.04 (−13%) 2.8 ± 0.4* (−21%) 3.8 ± 0.5 3.6 ± 0.6 CA_SP = stratum pyramidale of CA1–3; SRLM = strata radiatum, lacunosum and moleculare of CA1–3, strata lacunosum and moleculare of the subiculum and stratum moleculare of gyrus dentatus; Hilum = stratum pyramidale of CA4 and stratum granulosum and polymorphic layer of gyrus dentatus; Subiculum_SP = stratum pyramidale of the subiculum.
* Indicates a significant difference between AD and CN (Mann–Whitney U test,
pb 0.05).
**
Indicates a trend which did not reach the significance threshold (Mann–Whitney U test, p = 0.058).
Source of funding
This work was supported by ANR (project HM-TC, grant number ANR-09-EMER-006), France Alzheimer Association (project IRMA7), by the CATI project (Fondation Plan Alzheimer) and by the program “Investissements d3avenir” (Grant number ANR-10-IAIHU-06) to collect data.
Role of the funding source
The sponsors of the study had no role in study design, data anal-ysis or interpretation, writing or decision to submit the report for publication.
Acknowledgments
The authors are grateful to the UNIACT team for carrying out the 7 T acquisitions, Sofia Honorio, Anne-Claire Coyne and Johanne Germain for their help with the monitoring of the protocol and to Anne Bertrand for insightful discussions.
References
Albert, M.S., DeKosky, S.T., Dickson, D., Dubois, B., Feldman, H.H., Fox, N.C., Gamst, A., Holtzman, D.M., Jagust, W.J., Petersen, R.C., Snyder, P.J., Carrillo, M.C., Thies, B., Phelps, C.H., 2011. The diagnosis of mild cognitive impairment due to Alzheimer3s disease: recommendations from the National Institute on Aging-Alzheimer3s Association workgroups on diagnostic guidelines for Alzheimer3s disease. Alzheimer3s & Demen-tia: the Journal of the Alzheimer3s Association 7 (3), 270–279.http://dx.doi.org/10. 1016/j.jalz.2011.03.00821514249.
Braak, E.,Braak, H., 1997. Alzheimer3s disease: transiently developing dendritic changes in pyramidal cells of sector CA1 of the Ammon3s horn. Acta Neuropathologica 93 (4), 323–3259113196.
Braak, H., Braak, E., 1991. Neuropathological staging of Alzheimer-related changes. Acta Neuropathologica 82 (4), 239–2591759558.
Chupin, M., Lehéricy, S., Hasboun, D., Colliot, O., Goerke, U., Marjanska, M., Ugurbil, K., van der Moortele, P.-F., 2009. Segmenting the subregions of the human hippocampus at 7 Tesla. NeuroImage 47, S122.http://dx.doi.org/10.1016/S1053-8119(09)71156-5. Chételat, G., Fouquet, M., Kalpouzos, G., Denghien, I., De la Sayette, V., Viader, F.,
Mézenge, F., Landeau, B., Baron, J.C., Eustache, F., Desgranges, B., 2008. Three-dimensional surface mapping of hippocampal atrophy progression from MCI to AD and over normal aging as assessed using voxel-based morphometry. Neuropsychologia 46 (6), 1721–1731.http://dx.doi.org/10.1016/j.neuropsychologia. 2007.11.03718289618.
Colliot, O.,Chételat, G.,Chupin, M.,Desgranges, B.,Magnin, B.,Benali, H.,Dubois, B.,Garnero, L., Eustache, F., Lehéricy, S., 2008. Discrimination between Alzheimer disease, mild cognitive impairment, and normal aging by using automated segmentation of the hippocampus. Radiology 248 (1), 194–201. http://dx.doi.org/10.1148/radiol. 248107087618458242.
Fig. 5. Right and left hippocampal subregional average cross-sectional area in CN and AD subjects (in mm2). Abbreviations: CA_SP = stratum pyramidale of CA1–3; SRLM = strata
radiatum, lacunosum and moleculare of CA1–3, strata lacunosum and moleculare of the subiculum and stratum moleculare of gyrus dentatus; hilum = stratum pyramidale of CA4 and stratum granulosum and polymorphic layer of gyrus dentatus; subiculum_SP = stratum pyramidale of the subiculum. CN = cognitively Normal subjects, AD = Alzheimer3s disease patients. *Indicates a significant difference between AD and CN (Mann–Whitney U test, p b 0.05).#
Indicates a trend which did not reach the significance threshold (Mann–Whitney U test, p = 0.058).
Csernansky, J.G., Wang, L., Joshi, S., Miller, J.P., Gado, M., Kido, D., McKeel, D., Morris, J.C., Miller, M.I., 2000. Early DAT is distinguished from aging by high-dimensional mapping of the hippocampus. Dementia of the Alzheimer type. Neurology 55 (11), 1636–164311113216.
Dubois, B., Feldman, H.H., Jacova, C., Dekosky, S.T., Barberger-Gateau, P., Cummings, J., Delacourte, A., Galasko, D., Gauthier, S., Jicha, G., Meguro, K., O3Brien, J., Pasquier, F., Robert, P., Rossor, M., Salloway, S., Stern, Y., Visser, P.J., Scheltens, P., 2007. Research criteria for the diagnosis of Alzheimer3s disease: revising the NINCDS-ADRDA criteria. Lancet Neurology 6 (8), 734–746. http://dx.doi.org/10.1016/S1474-4422(07)70178-317616482.
Duvernoy, H., 2005.The Human Hippocampus: Functional Anatomy, Vascularization and Serial Sections With MRIthird edition. Springer-Verlag, Berlin, Heidelberg, NY.
Frisoni, G.B., Ganzola, R., Canu, E., Rüb, U., Pizzini, F.B., Alessandrini, F., Zoccatelli, G., Beltramello, A., Caltagirone, C., Thompson, P.M., 2008. Mapping local hippocampal changes in Alzheimer3s disease and normal ageing with MRI at 3 Tesla. Brain: A Journal of Neurology 131 (12), 3266–3276.http://dx.doi.org/10.1093/brain/ awn28018988639.
Fukutani, Y.,Kobayashi, K.,Nakamura, I.,Watanabe, K., Isaki, K.,Cairns, N.J., 1995. Neurons, intracellular and extracellular neurofibrillary tangles in subdivisions of the hippo-campal cortex in normal ageing and Alzheimer3s disease. Neuroscience Letters 200 (1), 57–608584267.
Gerardin, E.,Chételat, G.,Chupin, M.,Cuingnet, R.,Desgranges, B.,Kim, H.S.,Niethammer, M., Dubois, B., Lehéricy, S., Garnero, L., Eustache, F., Colliot, O., Alzheimer3s Disease Neuroimaging Initiative, 2009. Multidimensional classification of hippocampal shape features discriminates Alzheimer3s disease and mild cognitive impairment from normal aging. Neuroimage 47 (4), 1476–1486.http://dx.doi.org/10.1016/j. neuroimage.2009.05.03619463957.
Henry, T.R., Chupin, M., Lehéricy, S., Strupp, J.P., Sikora, M.A., Sha, Z.Y., Ugurbil, K., Van de Moortele, P.F., 2011. Hippocampal sclerosis in temporal lobe epilepsy:findings at 7 T¹. Radiology 261 (1), 199–209.http://dx.doi.org/10.1148/radiol.1110165121746814. Hyman, B.T.,Van Hoesen, G.W.,Damasio, A.R.,Barnes, C.L., 1984. Alzheimer3s disease:
cell-specific pathology isolates the hippocampal formation. Science (New York, N.Y.) 225 (4667), 1168–11706474172.
Jack, C.R., Albert, M.S., Knopman, D.S., McKhann, G.M., Sperling, R.A., Carrillo, M.C., Thies, B., Phelps, C.H., 2011. Introduction to the recommendations from the National Institute on Aging-Alzheimer3s Association workgroups on diagnostic guidelines for Alzheimer3s disease. Alzheimer3s & Dementia: the Journal of the Alzheimer3s Associ-ation 7 (3), 257–262.http://dx.doi.org/10.1016/j.jalz.2011.03.00421514247. Jack, C.R.,Petersen, R.C.,O3Brien, P.C.,Tangalos, E.G., 1992. MR-based hippocampal volumetry
in the diagnosis of Alzheimer3s disease. Neurology 42 (1), 183–1881734300. Jack, C.R.,Petersen, R.C., Xu, Y.C., Waring, S.C., O3Brien, P.C.,Tangalos, E.G.,Smith, G.E.,Ivnik,
R.J.,Kokmen, E., 1997. Medial temporal atrophy on MRI in normal aging and very mild Alzheimer3s disease. Neurology 49 (3), 786–7949305341.
Kerchner, G.A.,Berdnik, D.,Shen, J.C.,Bernstein, J.D.,Fenesy, M.C.,Deutsch, G.K.,Wyss-Coray, T., Rutt, B.K., 2014. APOEε4 worsens hippocampal CA1 apical neuropil atrophy and episodic memory. Neurology 82 (8), 691–697.http://dx.doi.org/10.1212/WNL. 000000000000015424453080.
Kerchner, G.A., Bernstein, J.D., Fenesy, M.C., Deutsch, G.K., Saranathan, M., Zeineh, M.M., Rutt, B.K., 2013. Shared vulnerability of two synaptically-connected medial temporal lobe areas to age and cognitive decline: a seven tesla magnetic resonance imaging study. Journal of Neuroscience: the Official Journal of the Society for Neuroscience 33 (42), 16666–16672.http://dx.doi.org/10.1523/JNEUROSCI.1915-13.201324133269. Kerchner, G.A., Deutsch, G.K., Zeineh, M., Dougherty, R.F., Saranathan, M., Rutt, B.K., 2012.
Hippocampal CA1 apical neuropil atrophy and memory performance in Alzheimer3s disease. Neuroimage 63 (1), 194–202.http://dx.doi.org/10.1016/j.neuroimage.2012. 06.04822766164.
Kerchner, G.A., Hess, C.P., Hammond-Rosenbluth, K.E., Xu, D., Rabinovici, G.D., Kelley, D.A., Vigneron, D.B.,Nelson, S.J.,Miller, B.L., 2010. Hippocampal CA1 apical neuropil atrophy in mild Alzheimer disease visualized with 7-T MRI. Neurology 75 (15), 1381–1387.
http://dx.doi.org/10.1212/WNL.0b013e3181f736a120938031.
Killiany, R.J., Moss, M.B., Albert, M.S., Sandor, T., Tieman, J., Jolesz, F., 1993. Temporal lobe regions on magnetic resonance imaging identify patients with early Alzheimer3s dis-ease. Archives of Neurology 50 (9), 949–9548363449.
La Joie, R., Perrotin, A., de la Sayette, V., Egret, S., Doeuvre, L., Belliard, S., Eustache, F., Desgranges, B., Chételat, G., 2013. Hippocampal subfield volumetry in mild cognitive impairment, Alzheimer3s disease and semantic dementia. NeuroImage. Clinical 3, 155–162.http://dx.doi.org/10.1016/j.nicl.2013.08.00724179859.
Laakso, M.P., Partanen, K., Riekkinen, P., Lehtovirta, M., Helkala, E.L., Hallikainen, M., Hanninen, T., Vainio, P., Soininen, H., 1996. Hippocampal volumes in Alzheimer3s dis-ease, Parkinson3s disease with and without dementia, and in vascular dementia: an MRI study. Neurology 46 (3), 678–6818618666.
Lace, G., Savva, G.M.,Forster, G., de Silva, R.,Brayne, C., Matthews, F.E., Barclay, J.J., Dakin, L., Ince, P.G., Wharton, S.B., MRC-CFAS, 2009. Hippocampal tau pathology is related to
neuroanatomical connections: an ageing population-based study. Brain: A Journal of Neurology 132 (5), 1324–1334.http://dx.doi.org/10.1093/brain/awp05919321462. La Joie, R.,Fouquet, M.,Mézenge, F.,Landeau, B.,Villain, N.,Mevel, K.,Pèlerin, A.,Eustache, F.,
Desgranges, B., Chételat, G., 2010. Differential effect of age on hippocampal subfields assessed using a new high-resolution 3T MR sequence. Neuroimage 53 (2), 506–514.
http://dx.doi.org/10.1016/j.neuroimage.2010.06.024.
Lehéricy, S., Baulac, M., Chiras, J., Piérot, L., Martin, N., Pillon, B., Deweer, B., Dubois, B., Marsault, C., 1994. Amygdalohippocampal MR volume measurements in the early stages of Alzheimer disease. AJNR. American Journal of Neuroradiology 15 (5), 929–9378059663.
McKhann, G., Drachman, D., Folstein, M., Katzman, R., Price, D., Stadlan, E.M., 1984. Clinical diagnosis of Alzheimer3s disease: report of the NINCDS-ADRDA Work Group under the auspices of Department of Health and Human Services Task Force on Alzheimer3s Disease. Neurology 34 (7), 939–9446610841.
Mueller, S.G., Stables, L., Du, A.T., Schuff, N., Truran, D., Cashdollar, N., Weiner, M.W., 2007. Measurement of hippocampal subfields and age-related changes with high resolution MRI at 4T. Neurobiology of Aging 28 (5), 719–726.http://dx.doi.org/10.1016/j. neurobiolaging.2006.03.007.
Mueller, S.G., Schuff, N., Yaffe, K., Madison, C., Miller, B., Weiner, M.W., 2010. Hippocampal atrophy patterns in mild cognitive impairment and Alzheimer3s disease. Human Brain Mapping 31 (9), 1339–1347.http://dx.doi.org/10.1002/hbm.2093420839293. Pluta, J., Yushkevich, P., Das, S., Wolk, D., 2012. In vivo analysis of hippocampal subfield
atrophy in mild cognitive impairment via semi-automatic segmentation of T2-weighted MRI. Journal of Alzheimer3s Disease: JAD 31 (1), 85–99.http://dx.doi.org/ 10.3233/JAD-2012-11193122504319.
Rössler, M.,Zarski, R.,Bohl, J.,Ohm, T.G., 2002. Stage-dependent and sector-specific neuro-nal loss in hippocampus during Alzheimer3s disease. Acta Neuropathologica 103 (4), 363–369.http://dx.doi.org/10.1007/s00401-001-0475-711904756.
Scheff, S.W., Price, D.A., Schmitt, F.A., DeKosky, S.T., Mufson, E.J., 2007. Synaptic alterations in CA1 in mild Alzheimer disease and mild cognitive impairment. Neurology 68 (18), 1501–1508.http://dx.doi.org/10.1212/01.wnl.0000260698.46517.8f17470753. Simić, G.,Kostović, I.,Winblad, B.,Bogdanović, N., 1997. Volume and number of neurons of
the human hippocampal formation in normal aging and Alzheimer3s disease. Journal of Comparative Neurology 379 (4), 482–4949067838.
Thal, D.R., Holzer, M., Rüb, U., Waldmann, G., Günzel, S., Zedlick, D., Schober, R., 2000. Alzheimer-related tau-pathology in the perforant path target zone and in the hippo-campal stratum oriens and radiatum correlates with onset and degree of dementia. Experimental Neurology 163 (1), 98–110.http://dx.doi.org/10.1006/exnr.2000. 738010785448.
Theysohn, J.M., Kraff, O., Maderwald, S., Schlamann, M.U., de Greiff, A., Forsting, M., Ladd, S.C., Ladd, M.E., Gizewski, E.R., 2009. The human hippocampus at 7 T— in vivo MRI. Hippocampus 19 (1), 1–7.http://dx.doi.org/10.1002/hipo.2048718727048. Thomas, B.P., Welch, E.B., Niederhauser, B.D., Whetsell, W.O., Anderson, A.W., Gore, J.C.,
Avison, M.J., Creasy, J.L., 2008. High-resolution 7 T MRI of the human hippocampus in vivo. Journal of Magnetic Resonance Imaging: JMRI 28 (5), 1266–1272.http://dx. doi.org/10.1002/jmri.2157618972336.
Thompson, P.M., Hayashi, K.M., Sowell, E.R., Gogtay, N., Giedd, J.N., Rapoport, J.L., de Zubicaray, G.I., Janke, A.L., Rose, S.E., Semple, J., Doddrell, D.M., Wang, Y., van Erp, T.G., Cannon, T.D., Toga, A.W., 2004. Mapping cortical change in Alzheimer3s disease, brain development, and schizophrenia. Neuroimage 23 (Suppl 1), S2–18.http://dx. doi.org/10.1016/j.neuroimage.2004.07.07115501091.
Wang, L., Miller, J.P., Gado, M.H., McKeel, D.W., Rothermich, M., Miller, M.I., Morris, J.C., Csernansky, J.G., 2006. Abnormalities of hippocampal surface structure in very mild dementia of the Alzheimer type. Neuroimage 30 (1), 52–60.http://dx.doi.org/10. 1016/j.neuroimage.2005.09.01716243546.
West, M.J., Coleman, P.D., Flood, D.G., Troncoso, J.C., 1994. Differences in the pattern of hippocampal neuronal loss in normal ageing and Alzheimer3s disease. Lancet 344 (8925), 769–7727916070.
Wisse, L.E., Biessels, G.J., Heringa, S.M., Kuijf, H.J., Koek, D.H., Luijten, P.R., Geerlings, M.I., Utrecht Vascular Cognitive Impairment (VCI) Study Group, 2014. Hippocampal sub-field volumes at 7 T in early Alzheimer3s disease and normal aging. Neurobiology of Aging 35, 2039–2045.http://dx.doi.org/10.1016/j.neurobiolaging.2014.02.021.1016/ j.neurobiolaging.2014.02.02124684788.
Wisse, L.E.,Gerritsen, L.,Zwanenburg, J.J.,Kuijf, H.J.,Luijten, P.R.,Biessels, G.J.,Geerlings, M.I., 2012. Subfields of the hippocampal formation at 7 T MRI: in vivo volumetric assess-ment. Neuroimage 61 (4), 1043–1049.http://dx.doi.org/10.1016/j.neuroimage.2012. 03.02322440643.
Xu, Y., Jack, C.R., O3Brien, P.C., Kokmen, E., Smith, G.E., Ivnik, R.J.,Boeve, B.F., Tangalos, R.G., Petersen, R.C., 2000. Usefulness of MRI measures of entorhinal cortex versus hippo-campus in AD. Neurology 54 (9), 1760–176710802781.