HAL Id: cea-01791446
https://hal-cea.archives-ouvertes.fr/cea-01791446
Submitted on 19 Feb 2019
HAL is a multi-disciplinary open access archive for the deposit and dissemination of sci-entific research documents, whether they are pub-lished or not. The documents may come from teaching and research institutions in France or abroad, or from public or private research centers.
L’archive ouverte pluridisciplinaire HAL, est destinée au dépôt et à la diffusion de documents scientifiques de niveau recherche, publiés ou non, émanant des établissements d’enseignement et de recherche français ou étrangers, des laboratoires publics ou privés.
computational results for photons in a water tank
J.M. Bordy, I. Bessieres, E. d’Agostino, C. Domingo, F. d’Errico, A. Di
Fulvio, Ž. Knežević, S. Miljanić, P. Olko, A. Ostrowsky, et al.
To cite this version:
J.M. Bordy, I. Bessieres, E. d’Agostino, C. Domingo, F. d’Errico, et al.. Radiotherapy out-of-field dosimetry: Experimental and computational results for photons in a water tank. Radiation Measure-ments, Elsevier, 2013, 57, pp.29 - 34. �10.1016/j.radmeas.2013.06.010�. �cea-01791446�
Accepted Manuscript
Radiotherapy out-of-field dosimetry: Experimental and computational results for photons in a water tank
J.M. Bordy, I. Bessieres, E. d'Agostino, C. Domingo, F. d'Errico, A. di Fulvio, Ž. Knežević, S. Miljanić, P. Olko, A. Ostrowsky, B. Poumarede, S. Sorel, L. Stolarczyk, D. Vermesse
PII: S1350-4487(13)00271-0 DOI: 10.1016/j.radmeas.2013.06.010 Reference: RM 5068
To appear in: Radiation Measurements
Received Date: 23 April 2012 Revised Date: 19 June 2013 Accepted Date: 23 June 2013
Please cite this article as: Bordy, J.M., Bessieres, I., d'Agostino, E., Domingo, C., d'Errico, F., di Fulvio, A., Knežević, Ž., Miljanić, S., Olko, P, Ostrowsky, A., Poumarede, B., Sorel, S, Stolarczyk, L., Vermesse, D., Radiotherapy out-of-field dosimetry: Experimental and computational results for photons in a water tank, Radiation Measurements (2013), doi: 10.1016/j.radmeas.2013.06.010.
This is a PDF file of an unedited manuscript that has been accepted for publication. As a service to our customers we are providing this early version of the manuscript. The manuscript will undergo copyediting, typesetting, and review of the resulting proof before it is published in its final form. Please note that during the production process errors may be discovered which could affect the content, and all legal disclaimers that apply to the journal pertain.
M
A
N
U
S
C
R
IP
T
A
C
C
E
P
T
E
D
ACCEPTED MANUSCRIPT
Radiotherapy out-of-field dosimetry:
Experimental and computational results for photons in a water tank
J.M. Bordya, E. d'Agostinob, I. Bessieresc, C. Domingod, F. d'Erricoe, A. di Fulvioe, Ž. Kneževićf
S. Miljanićf, P Olkog, A. Ostroskya, B. Poumaredec, S Sorela, L. Stolarczykg, D. Vermessea.
a
CEA, LIST, LNE/LNHB, 91191 Gif sur Yvette, France
b
Radioprotection, Dosimetry and Calibration, Belgian Nuclear Research Institute, Mol c
CEA, LIST, DCSI, 91191 Gif sur Yvette, France
d
Universitat Autònoma de Barcelona (UAB), Spain e
Department of Mechanical, Nuclear and Production Engineering, University of Pisa, Italy f Ruđer Bošković Institute, Bijenička 54, 10000 Zagreb, Croatia
g
Institute of Nuclear Physics, Krakow, Poland
Highlights:
Dosimeters based on OSL, TLD and RPL have been compared for radiotherapy purposes.
Irradiations have been performed in a water phantom located in and out of the beam. Doses have been studied for three radiation quantities, 6, 12 and 20 MV.
M
A
N
U
S
C
R
IP
T
A
C
C
E
P
T
E
D
ACCEPTED MANUSCRIPT
1 2 3 4 5 6 7 8 9 10 11 12 13 14 15 16 17 18 19 20 21 22 23 24 25 26 27 28 29 30 31 32 33 34 35 36 37 38 39 40 41 42 43 44 45 46 47 48 49 50 51 52 53 54 55 56 57 58 59 60Radiotherapy out-of-field dosimetry:
Experimental and computational results for photons in a water tank
J.M. Bordya, I. Bessieresc, E. d'Agostinob, C. Domingod, F. d'Erricoe, A. di Fulvioe, Ž. Kneževićf
S. Miljanićf, P Olkog, A. Ostrowskya, B. Poumaredec, S Sorela, L. Stolarczykg, D. Vermessea.
a
CEA, LIST, LNE/LNHB, 91191 Gif-sur-Yvette, France
b
Radioprotection, Dosimetry and Calibration, Belgian Nuclear Research Institute, Mol c
CEA, LIST, DCSI, 91191 Gif-sur-Yvette, France
d
Universitat Autònoma de Barcelona (UAB), Spain e
Department of Mechanical, Nuclear and Production Engineering, University of Pisa, Italy f Ruđer Bošković Institute, Bijenička 54, 10000 Zagreb, Croatia
g
Institute of Nuclear Physics, Krakow, Poland
1 Introduction
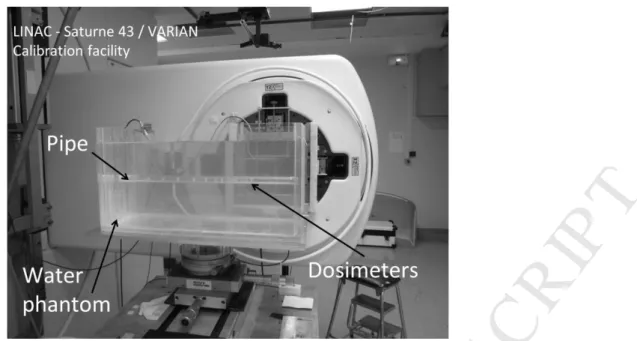
This work has been carried out within the framework of EURADOS Working Group 9 (WG9) whose general objective is “to assess non-target organ doses in radiotherapy and the related risks of second cancers, with the emphasis on dosimetry”. Indeed, new treatment modalities involving, among others, the use of multi-leaf collimators (MLC) and the increasing use of imaging exposures can lead to higher doses to organs surrounding the target volume than previous modalities and therefore to a higher risk of second cancer induction (Harrison, 2012; Xu et al, 2008; D'Agostino et al, 2013). For the present study, two series of experiments were carried out in July 2010 and April 2011 at the calibration facility for radiotherapy dosimeters of the CEA/LIST Laboratoire National Henri Becquerel (LNHB), which is the French national laboratory of metrology for ionising radiations. The objective of this work was to evaluate the current methods of measuring three-dimensional dose distributions in and around the target volume, to derive the leakage dose from the head of the medical linear accelerator (LINAC) and the doses due to scattered radiation from the collimator edges and the body (phantom) itself.
2 Material and methods
2.1 Dosimeters used for this study
Radiotherapy treatment modalities, using rotational irradiation and very small beams, such as intensity modulated and stereotactic radiotherapy, lead to very large and steep dose gradients in the penumbra zone around the target volume. Dose distributions in three dimensions are calculated by treatment planning systems (TPS) and need to be experimentally validated. In addition, it is often not possible to calculate doses to remote organs and tissues (out-of-field doses) using a TPS and these doses also need to be determined experimentally. Small passive dosimeters are irradiated in anthropomorphic phantoms for such purposes. Four passive dosimeters were used in these experiments for photon dosimetry: two based on
thermoluminescence (TLD), one on optically stimulated luminescence (OSL) and one on
*Manuscript
M
A
N
U
S
C
R
IP
T
A
C
C
E
P
T
E
D
1 2 3 4 5 6 7 8 9 10 11 12 13 14 15 16 17 18 19 20 21 22 23 24 25 26 27 28 29 30 31 32 33 34 35 36 37 38 39 40 41 42 43 44 45 46 47 48 49 50 51 52 53 54 55 56 57 58 59 60 61 62radiophotoluminescence (RPL). A detailed description of the dosimeters has been given by Knežević et al.in this issue (Knežević et al., 2013). The Ruđer Bošković Institute-RBI, Zagrebused RPL (GD-352M) (Asahi Techno Glass Corp) as well as TLD-700 and 100 (Harshaw) while the Institute of Nuclear Physics-IFJ, Krakow used TLD MTS-7 (Poland) and LNHB used OSL nano Dot (Landauer).
2.2 Reference absorbed dose values
The irradiations were carried out in the beams of the Saturn 43 LINAC of the French national laboratory of metrology for ionising radiations. The reference values were measured with an ionisation chamber (Nuclear Enterprise Type NE 2571). All these measurements are
traceable to French national references in terms of absorbed dose to water for radiotherapy and were established by calorimetry in water and graphite for beam sizes ranging between 10 cm x10 cm and 2 cm x 2 cm under standard conditions defined in IAEA TRS 398 protocol (IAEA, 2000). Three radiation qualities were used, 6, 12 and 20 MV corresponding to TPR20,101 of 0.678, 0.751 and 0.784 respectively. The duration of irradiation, about one
minute, delivers a dose of 2 Gy at the point of reference in the beam axis at 10 cm depth in the phantom, corresponding to the isocentre, whatever the quality and the size of the radiation field.
2.3 First set of experiments
The objectives of these experiments were (i) to check and select dosimeters able to be used for photon absorbed dose measurements both within and outside the beam, to calibrate them, and (ii) to validate a method for assessing the doses (including correction factors if
necessary).
Figures 1 and 2 present a picture and a top view of the water tank phantom (60 cm x 30 cm x 30 cm) whose polymethylmethacrylate (PMMA) walls were 15 mm thick (except along the beam axis where they were 4 mm thick). The axis of irradiation was horizontal, and the beam size at 10 cm depth in phantom was 10 cm x 10 cm. A thickness of about 40 cm of water lay outside the direct beam. In this phantom, the dosimeters were mounted in pipes. The position of the dosimeters in the pipes was fixed using PMMA spacers. Five frames were laid out at depth increments of 5 cm along the beam axis. Each frame contained 5 pipes mounted in a vertical plane. Therefore, depth doses along the beam axis and profile at various depths were measured.
M
A
N
U
S
C
R
IP
T
A
C
C
E
P
T
E
D
ACCEPTED MANUSCRIPT
1 2 3 4 5 6 7 8 9 10 11 12 13 14 15 16 17 18 19 20 21 22 23 24 25 26 27 28 29 30 31 32 33 34 35 36 37 38 39 40 41 42 43 44 45 46 47 48 49 50 51 52 53 54 55 56 57 58 59 60Fig 1: Photograph of the experimental set up for the first set of experiments
.
Fig 2: Top view of the experimental set up showing the direction of the beam (for
experimental configurations 1 and 2) and the location of the dosimeters. (D is the distance from the inner surface of the phantom); all dimensions in millimeters
M
A
N
U
S
C
R
IP
T
A
C
C
E
P
T
E
D
1 2 3 4 5 6 7 8 9 10 11 12 13 14 15 16 17 18 19 20 21 22 23 24 25 26 27 28 29 30 31 32 33 34 35 36 37 38 39 40 41 42 43 44 45 46 47 48 49 50 51 52 53 54 55 56 57 58 59 60 61 622.4 Second set of experiments
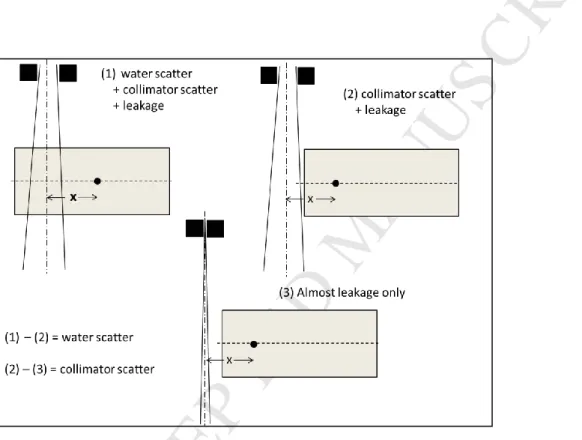
The objective of these experiments are summarised in figure 3: (i) to estimate the component of scattered radiation due to water by subtracting measurements carried out with the phantom positioned both within (the first set of experiments, section 2.3) and outside the beam, both with a beam size of 10 cm x10 cm; (ii) to estimate the scattered component due to the
collimator by subtracting the results of the experiments obtained with the phantom positioned outside the beam with a “closed” collimator (producing mainly leakage radiation) from results obtained with the phantom positioned outside the beam with an open collimator and finally (iii) to estimate the leakage from the head of the LINAC. When the phantom is located out of the beam, there is no scatter from the beam in water and when the collimator is closed, there is minimal scatter from the edges of the collimator. A similar experiment has previously been carried out (Kase et al, 1983).
Fig 3: Summary of the measurement set up for the derivation of the water scatter, collimator scatter and leakage
This set of experiments was carried out using the same irradiation facility and phantom as used in the first set. However, the geometrical configuration was different. Five pipes filled with dosimeters were installed on the frame n°2 located at 10 cm depth. Two series of irradiations were carried out with passive dosimeters, one with a 10 cm x 10 cm beam as before and one with the collimator closed as much as possible, which corresponds to a beam of about 1 cm² at 10 cm depth in the phantom. It was decided not ot add a shutter in the beam to close it in order to avoid the changes of the LINAC head configuration between both experiments with open and close jaws which could lead to more scatter and annihilation (511 keV) photons due to the shutter. Ionisation chamber measurements were also made at the same position as for passive dosimeters for the following beam sizes: 15 cm x15 cm, 10 cm x
M
A
N
U
S
C
R
IP
T
A
C
C
E
P
T
E
D
ACCEPTED MANUSCRIPT
1 2 3 4 5 6 7 8 9 10 11 12 13 14 15 16 17 18 19 20 21 22 23 24 25 26 27 28 29 30 31 32 33 34 35 36 37 38 39 40 41 42 43 44 45 46 47 48 49 50 51 52 53 54 55 56 57 58 59 6010 cm, 7 cm x 7 cm, 4 cm x 4 cm and for the collimators closed as much as possible, as described above for the case of passive dosimeters.
2.5 Correction of the raw results
A description of the calibration conditions for the TLD, OSL and RPL dosimeters is given by Knežević et al.in this issue (Knežević et al., 2013). The in-phantom photon spectra will be progressively softened with increasing distance from the isocentre because of multiple scattering events. This means that the energy response of dosimeters must be considered and correction factors employed if necessary. The energy response curve for OSL was measured at LNHB (see figure 4). The principle of the correction, as described below, could also be applied to other dosimeters.
The energy spectra of the photons were calculated using the Monte Carlo code PENELOPE (Salvat et al. 2001) at each point of measurement. Then, the energy response curve of the detector in terms of absorbed dose to water, measured at LNHB, was convoluted with the distribution of the energy fluence in order to determine the correction factor (1/k) to be applied to the calibration coefficient for OSL dosimeters at each measurement point.
(1)
where tot is the total energy fluence of the spectrum, R(E) is the response for energy E
normalised to cobalt-60 and is the energy fluence for energy E.
3 Results and discussions
3.1 Energy response curve for OSL
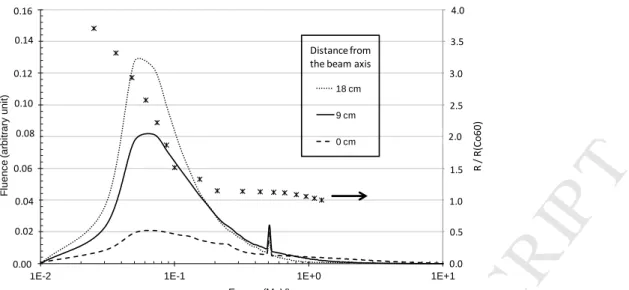
Figure 4 presents an example of the calculated fluence distribution as a function of energy for a 12 MV radiation quality. The parameters used for these calculations (size and mean energy of the electron spot on the target) were validated using experimental depth doses and profiles achieved under reference conditions. It is noted that the low energy component drastically increases as one moves away from the beam axis. A 511 keV component is always found corresponding to pair production followed by electron-positron annihilation.
This response curve shows an over-response by a factor of up to 3.7 (normalised to cobalt-60) for energies lower than 200 keV (see also Knežević et al., 2013, Figure 2). These spectra were used to derive the correction factor (1/k) as described in 2.5.
1
𝑘
=
1
M
A
N
U
S
C
R
IP
T
A
C
C
E
P
T
E
D
1 2 3 4 5 6 7 8 9 10 11 12 13 14 15 16 17 18 19 20 21 22 23 24 25 26 27 28 29 30 31 32 33 34 35 36 37 38 39 40 41 42 43 44 45 46 47 48 49 50 51 52 53 54 55 56 57 58 59 60 61 62Fig 4: Example of photon fluence spectra at 10 cm depth in the phantom, in the beam axis (0 cm) and at two distances from the beam axis (9 and 18 cm); radiation quality 12 MV (left hand axis). Stars represent the OSL response in terms of absorbed dose to water normalized to cobalt 60 (right hand axis)
3.2 First set of experiments
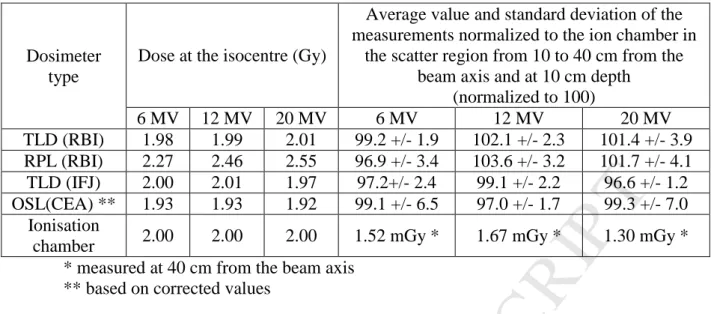
For the dose at the isocentre (see Table 1), compared to the ionisation chamber the deviation for the TLDs is less than 1.5%, for corrected OSL a systematic underestimation up to 4% is found while for the RPL dosimeter (type GD-352M) a systematic overestimation up to 27.5% is encountered for all the radiation qualities used in this work (6, 12 and 20 MV). This can be attributed to the influence of the tin cap covering the RPL detector which introduces a high atomic number nuclide with which the photons interact to generate secondary electrons depositing additional energy in the RPL material. A correction similar to the one provided for OSL could be calculated if this dosimeter is used for measurements inside the beam without a dedicated calibration. Since the objective is to measure out-of-field doses, corrections for this over-response have not been made as part of this work.
0,0 0,5 1,0 1,5 2,0 2,5 3,0 3,5 4,0 0,00 0,02 0,04 0,06 0,08 0,10 0,12 0,14 0,16
1E-2 1E-1 1E+0 1E+1
F lu e n c e ( a rb itr a ry u n it) Energy (MeV) 18 cm 9 cm 0 cm R / R (C o 6 0 ) Distance from the beam axis 0.16 0.14 0.02 0.04 0.06 0.08 0.10 0.12 0.00 4.0 3.5 3.0 2.5 2.0 1.5 1.0 0.5 0.0
M
A
N
U
S
C
R
IP
T
A
C
C
E
P
T
E
D
ACCEPTED MANUSCRIPT
1 2 3 4 5 6 7 8 9 10 11 12 13 14 15 16 17 18 19 20 21 22 23 24 25 26 27 28 29 30 31 32 33 34 35 36 37 38 39 40 41 42 43 44 45 46 47 48 49 50 51 52 53 54 55 56 57 58 59 60 Dosimeter typeDose at the isocentre (Gy)
Average value and standard deviation of the measurements normalized to the ion chamber in
the scatter region from 10 to 40 cm from the beam axis and at 10 cm depth
(normalized to 100) 6 MV 12 MV 20 MV 6 MV 12 MV 20 MV TLD (RBI) 1.98 1.99 2.01 99.2 +/- 1.9 102.1 +/- 2.3 101.4 +/- 3.9 RPL (RBI) 2.27 2.46 2.55 96.9 +/- 3.4 103.6 +/- 3.2 101.7 +/- 4.1 TLD (IFJ) 2.00 2.01 1.97 97.2+/- 2.4 99.1 +/- 2.2 96.6 +/- 1.2 OSL(CEA) ** 1.93 1.93 1.92 99.1 +/- 6.5 97.0 +/- 1.7 99.3 +/- 7.0 Ionisation
chamber 2.00 2.00 2.00 1.52 mGy * 1.67 mGy * 1.30 mGy * * measured at 40 cm from the beam axis
** based on corrected values
Table 1: Measured dose at isocentreand scattered doses using the four passive dosimeters and ionization chambers.
Taking into account that the standard uncertainty in ionisation chamber measurement is estimated at 1.2% and those of passive dosimeters being roughly estimated up to 2.5% for high doses, it can be concluded that TLDs and OSLs allow a reliable measurement of the dose at the isocentre.
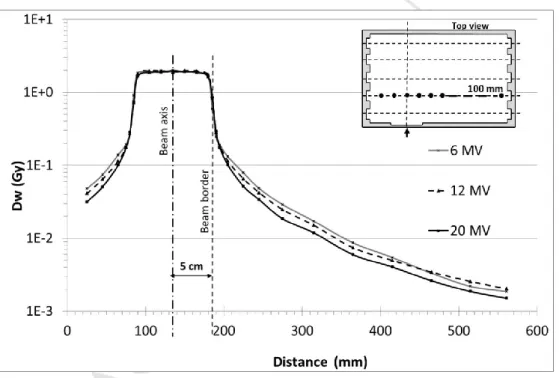
On the edge of the beam, where a steep variation of dose is seen, the comparison between the dosimeters is meaningless because the sizes of the dosimeters are different so that they integrate different parts of the profile. The absorbed dose out of the beam for a given depth decreases as one moves away from the beam axis to reach, at a distance of 40 cm, less than 1% of the absorbed dose at the isocentre (Figures 5 and 6, Table 1). This decrease can be attributed to the absorption of the scattered component of the radiation field in the water as the distance from the beam axis increases. At this stage it is not possible to distinguish separately the out of field doses due to scatter and leakage radiation. Nevertheless, the comparison of absorbed dose as a function of the radiation quality normalised to the same dose at the isocentre shows that out of field doses decrease when the incident energy increases (Figure 6). Figure 7 and Table 1 highlight the very good agreement between the reference and the TLD measurements in and out of the beam for a given radiation quality and at a given depth. Taking into account the shape and the volume of the dosimeters and the measurements conditions inside a water phantom where the fluence is increasingly isotropic with increasing distance of the dosimeter from the isocentre, it was assumed that the influence of the angular dependence of the dosimeter is negligible.
M
A
N
U
S
C
R
IP
T
A
C
C
E
P
T
E
D
1 2 3 4 5 6 7 8 9 10 11 12 13 14 15 16 17 18 19 20 21 22 23 24 25 26 27 28 29 30 31 32 33 34 35 36 37 38 39 40 41 42 43 44 45 46 47 48 49 50 51 52 53 54 55 56 57 58 59 60 61 62Fig 5: Example of the dose profile measured at 12 MV with OSL dosimeters at different depths in the water phantom from 100 to 250 mm from its front face.
Fig 6: Comparison of the dose profile at 100 mm depth in the water phantom for the 3 radiation qualities (OSL dosimeters).
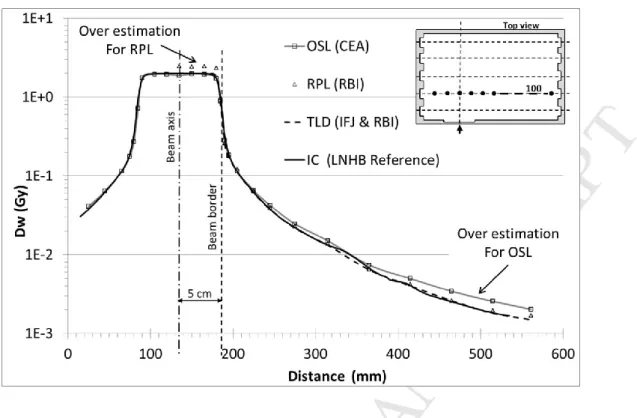
The over-response of OSL dosimeters for energies lower than 200 keV, leads to an
overestimation of the absorbed dose in the scatter region (Figure 7) whilst a good agreement is found between TLD, RPL and ionisation chamber measurements; this over response of OSL is larger as the distance from the beam axis increases. Table 2 provides data, calculated using the Monte Carlo code PENELOPE, on the proportion of the fluence and the energy
M
A
N
U
S
C
R
IP
T
A
C
C
E
P
T
E
D
ACCEPTED MANUSCRIPT
1 2 3 4 5 6 7 8 9 10 11 12 13 14 15 16 17 18 19 20 21 22 23 24 25 26 27 28 29 30 31 32 33 34 35 36 37 38 39 40 41 42 43 44 45 46 47 48 49 50 51 52 53 54 55 56 57 58 59 60fluence for energies lower than 200 keV. It is noted that this part of the spectrum is dominant far from the beam axis explaining why it is necessary to correct the OLS raw results.
Fig 7: Comparison of the profile measured with the 4 passive dosimeters and the ionisation chamber at 10 mm depth for 12 MV radiation quality.
In the beam
Out of the beam, up to 40 cm from the isocentre Percentage of fluence [0 ; 200 keV] ~ 15% Up to 75% Percentage of energy fluence [0 ; 200 keV] < 0.7% Up to 45%
Average energy 2.40 MeV Down to 150 keV
Table 2: Percentage of the fluence and the energy fluence in the beam and at 40 cm from the beam axis (Results achieved by Monte Carlo simulation using the PENELOPE code).
After correction, OSL results are closer to those obtained with ionisation chambers.
Nevertheless the spread of the results after applying the correction factor to OSL dosimeters can be larger, in the scatter region, than for the other dosimeters which do not require the use of a correction factor. This can be seen in Table 1, for 6 and 20 MV. Indeed, being based on calculations, the correction factor value relies on the precision of the LINAC head model for calculations. Some discrepancies can exist between the theoretical model and the real
experimental set up which can lead to less accurate correction factor values, especially far from the beam axis.
Finally, ionization chamber measurements confirm the calibration of TLD based dosimeters, for all the measurement positions, and allow the correction of the OSL calibrations in low energy regions far from the beam axis.
M
A
N
U
S
C
R
IP
T
A
C
C
E
P
T
E
D
1 2 3 4 5 6 7 8 9 10 11 12 13 14 15 16 17 18 19 20 21 22 23 24 25 26 27 28 29 30 31 32 33 34 35 36 37 38 39 40 41 42 43 44 45 46 47 48 49 50 51 52 53 54 55 56 57 58 59 60 61 623.2 Second set of experiments
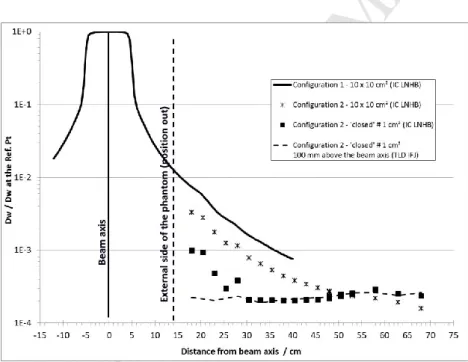
Fig 8 shows results achieved with ionisation chambers and TLD for 6 MV. The dose profiles in the plan located at 10 cm depth in the phantom highlight two zones. In the first zone (obtained from experimental configuration 2), up to 30 to 45 cm from the beam axis (depending on the beam size), the dose decreases quickly from a few mGy down to approximately 0.3 to 0.4 mGy. This shape is mainly due to the absorption of radiation
scattered by the collimator (with some leakage component) because the water phantom is not in the beam so that there is no contribution of the water scatter from the beam itself. Doses due to leakage from the LINAC heads should be low and homogeneous as the LINAC heads are designed to minimise leakage doses (IEC, 1998). In Figure 8, beyond 30 to 45 cm depending on the size of the beam, the dose does not vary rapidly with distance from the beam axis. Thus, a plateau is reached between 0.2 and 0.25 mGy. It has to be noted that from the first set of experiments, it was not possible to distinguish the out-of-field doses due to water and collimator scatter and leakage radiation (Figures 5, 6 and 7) because even at 40 cm from the beam axis it evident that there is no plateau. This shows that the dose level due to the leakage only was not reached for a 10 cm x10 cm beam. The origin of the plateau is
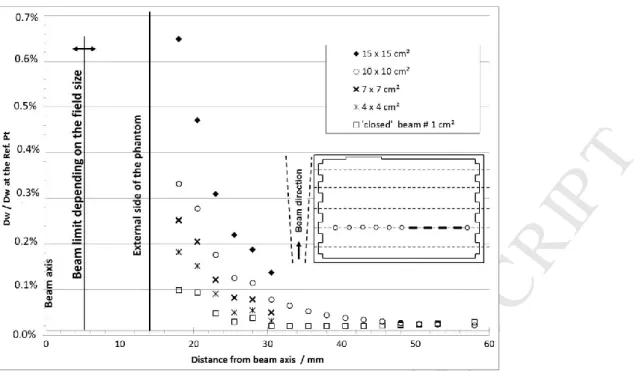
corroborated by measurements in the water phantom, when it does not intercept the beam, for beam sizes between 15 cm x15 cm and the collimator closed (Figure 9). The link between collimator size and the scattered radiation is evident because it can be seen that the dose close to the beam axis decreases with the collimator size so that the width of the plateau becomes larger. Therefore, the dose due to leakage remains the same but the dose due to the collimator scatter decreases with distance from the beam axis.
Fig 8: Comparison of the results of the 3 sets of experiment for the radiation quality 6 MV. Ionization chamber and TLD measurements. The data points refer to beam configurations shown in the box and in Figure 3.
M
A
N
U
S
C
R
IP
T
A
C
C
E
P
T
E
D
ACCEPTED MANUSCRIPT
1 2 3 4 5 6 7 8 9 10 11 12 13 14 15 16 17 18 19 20 21 22 23 24 25 26 27 28 29 30 31 32 33 34 35 36 37 38 39 40 41 42 43 44 45 46 47 48 49 50 51 52 53 54 55 56 57 58 59 60Fig 9: Out-of-field ionization chamber measurements in the phantom for various beam sizes from 15 cm x15 cm to 1cm².
Once the origin of the plateau and the slopes of the curves are established, it is possible to derive the contribution of the scatter due to the water, the collimator, and the leakage as explained in section 2.4. Table 3 presents the evaluation of the scattered components due to water and collimator as well as the leakage, as a function of the radiation quality of the beam. The boundaries of the intervals correspond to the upper and lower values recorded, for
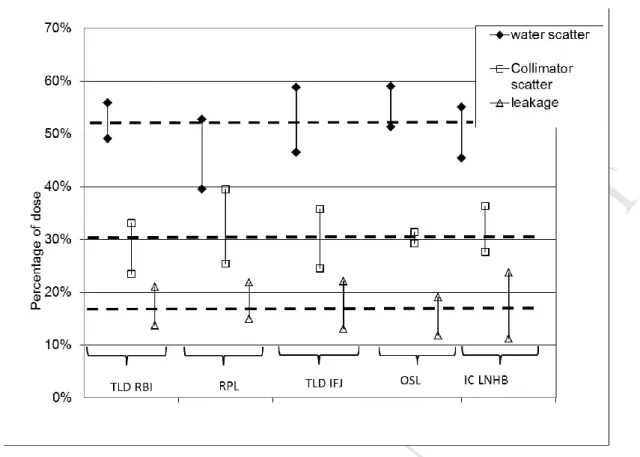
distances between 18 and 40 cm from the beam axis, using 6 measurements for each dosimeter type. Because the beam was not fully closed, one can see from Figure 9 that, between 18 and 25 cm from the beam axis, a small photon component scattered in air reaches the water tank. This component does not perturb significantly the evaluation of the water and collimator scatter and the leakage. It is noted that the percentages of the total dose due to water scatter decreases significantly when energy increases while the percentage due to the collimator remains relatively unchanging. It is also noted that, for 6 MV, collimator scatter and leakage are smaller and that leakages are very similar for the 12 and 20 MV beams (between 0.3 and 0.4 mGy). Figure 10 shows the results achieved for all the dosimeters at 6 MV. Dashed lines are given for guidance only.
Radiation quality
Percentage of out-of-field doses due to
Water scatter Collimator scatter “Leakage” estimate 6 MV 45 to 55 28 to 36 11 to 24 12 MV 37 to 42 29 to 43 17 to 30 20 MV 26 to 37 34 to 49 19 to 40
Table 3: Comparison of the out-of-field doses due to water scattering, collimator scattering and leakage for the three radiation qualities between 18 and 40 cm from the beam axis (ionisation chamber measurements).
M
A
N
U
S
C
R
IP
T
A
C
C
E
P
T
E
D
1 2 3 4 5 6 7 8 9 10 11 12 13 14 15 16 17 18 19 20 21 22 23 24 25 26 27 28 29 30 31 32 33 34 35 36 37 38 39 40 41 42 43 44 45 46 47 48 49 50 51 52 53 54 55 56 57 58 59 60 61 62Fig 10: Comparison of dosimeter results for the out of field doses due to the water scatter, collimator scatter and leakage; radiation quality 6 MV. The limits of the bars correspond to the upper and lower values recorded for distances between 18 and 40 cm from the beam axis. RBI stands for “Ruđer Bošković Institute”, IFJ stands for “Institute of Nuclear Physics” and LNHB stands for “Laboratoire National Henri Becquerel”.
Relative measurement uncertainties can be very high for low doses such as those due to leakage from the head of a LINAC. It is rather difficult in such cases to calculate an
uncertainty estimate, using a “bottom-up” method; that is to say looking at all the sources of uncertainty and combining them in a model following the “Guide to the expression of
Uncertainties in Measurements” advice (ISO, 1999). This is because some components of the total uncertainty can be over- or under-estimated and/or correlations can be ignored.
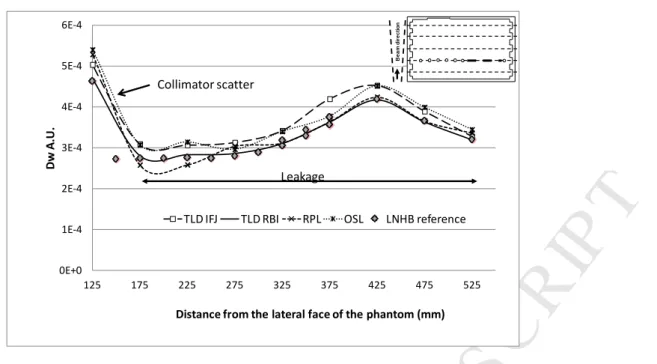
Nevertheless, an estimate of the uncertainty budget using the GUM method was made for OSL dosimeters, taking into account, among others, uncertainties on the reading, batch variation, calibration, orientation, dose rate and linearity, a standard uncertainty of 4.5% was found. Because good agreement with the reference values is found, another possibility, to derive an approximate global uncertainty, is to look at the spread in all the final results. Figure 11 presents an example of such an analysis. It can be seen that all the results for all the
dosimeters used are consistent and that their spreads show a maximum value of about 15%. Thinking that this overall uncertainty corresponds to a coverage factor of 3, the GUM and global method are in quite good agreement. These figures allow an overall evaluation of the maximum uncertainty which can be allotted to measurements of the scattered radiation and leakage in routine practice.
M
A
N
U
S
C
R
IP
T
A
C
C
E
P
T
E
D
ACCEPTED MANUSCRIPT
1 2 3 4 5 6 7 8 9 10 11 12 13 14 15 16 17 18 19 20 21 22 23 24 25 26 27 28 29 30 31 32 33 34 35 36 37 38 39 40 41 42 43 44 45 46 47 48 49 50 51 52 53 54 55 56 57 58 59 60Fig 11: Comparison of the results achieved with the four passive dosimeters and the ionization chamber. The beam is as closed as possible; the radiation quality is 12 MV.
4 Conclusions
The dosimeter calibration was checked in the reference beams of the LINAC at three photon radiation qualities. All the dosimeters used (TLD, RPL and OLS) exhibit a useful
measurement range which covers the expected range of out-of-field doses. A correction factor for the energy response was applied to the OSL measurements due to an over-estimate for energy below 200 keV whereas TLD measurements do not require such a correction. When used in the target volume, readings of RPL dosimeter type GD-352M should be corrected or types GD-301 and GD-302M (without Sn filter) which did not show an over-response for high energy photons, should be used (Mizuno et al, 2008 and Rah et al, 2009). The automatic readers for the OSL and the RPL allowed a fast and reliable reading of the dosimeters. However the number of dosimeters required to derive an accurate three dimensional distribution of the doses remains very large. A direct method of measurement in three
dimensions for example by using dosimetric gel or multiple two dimensional dose distribution measurements (for example using films) could obviate this difficulty. Nevertheless, these experiments allow the derivation of some interesting data about the amount and the origin of out-of-beam radiations. Thus, it has been shown that the ratios between water scatter,
collimator scatter and leakage depend on the photon energy. Water scatter decreases with energy while leakage increases with energy, and collimator scatter varies only slowly with energy. Following these experiments, the next stage of the WG9 work consists of irradiating dosimeters in anthropomorphic phantoms according to clinically realistic treatment plans to provide benchmarks (Miljanić et al., 2013).
0E+0 1E-4 2E-4 3E-4 4E-4 5E-4 6E-4 125 175 225 275 325 375 425 475 525 Dw A .U .
Distance from the lateral face of the phantom (mm)
TLD IFJ TLD RBI RPL OSL LNHB reference
Beam d ir e c ti o n Collimator scatter Leakage
M
A
N
U
S
C
R
IP
T
A
C
C
E
P
T
E
D
1 2 3 4 5 6 7 8 9 10 11 12 13 14 15 16 17 18 19 20 21 22 23 24 25 26 27 28 29 30 31 32 33 34 35 36 37 38 39 40 41 42 43 44 45 46 47 48 49 50 51 52 53 54 55 56 57 58 59 60 61 62 References:D'Agostino, E., Bogaerts, R., Defraene, G., De Freitas Nascimento, L., Van den Heuvel, F., Verellen, D., Duchateau, M., Vanhavere, F., 2013 Peripheral doses in radiotherapy: a comparison between IMRT and Tomotherapy, (This issue).
Harrison, R.M., 2013. Introduction to dosimetry and risk estimation of second cancer induction following radiotherapy, (this issue).
IAEA 2000. Technical reports series n°398, Absorbed Dose Determination in External Beam Radiotherapy, An International Code of Practice for Dosimetry Based on standards of
Absorbed Dose to Water. AIEA, Vienna, Austria.
IEC 1998. Medical electrical equipment: Particular requirements for the safety of electron accelerators in the range 1 MeV to 50 MeV, Document 60601-2-1, IEC, Geneva, Switzerland (1998).
ISO 1999. Guide to the expression of uncertainty in measurement, NF ENV 13005.
Kase, K.R., Svensson, G.K., Wolbarst, A.B., Marks, M.A., 1983. Measurements of dose from secondary radiation outside a treatment field. Int. J. Radiation Oncology Biol. Phys. 9, 1177-1183.
Knežević, Ž., Stolarczyk, L., Bessieres, I., Bordy, J.M., Miljanić, S., Olko, P., 2013. photon dosimetry methods: Optically stimulated luminescence (OSL), thermoluminescence (TL) and radiophotoluminescence (RPL) dosimetry, (This issue).
Miljanić, S., Bessieres, I., Bordy, J.M., d’Errico, F., di Fulvio, A., Kabat, D., Knežević, Z., Olko, P., Stolarczyk, L., Tana, L. and Harrison, R.M., 2013. Clinical simulations of prostate radiotherapy using BOMAB-like phantoms: results for photons. (This issue)
Mizuno, H., Kanai, T., Kusano,Y., Ko, S., Ono, M., Fukumura, A., Abe, K., Nishizawa, K., Shimbo, M., Sakata, S., Ishikura, S., Ikeda, H., 2008. Feasibility Study of Glass Dosimeter Postal Dosimetry Audit of High- Energy, Radiotherapy Photon Beams. Radiot. and Oncol. 85, 258-263.
Rah, J.-E., Hong, J.-Y, Kim,G.-Y., Kim, Y.-L., Shin, D.-O., Suh, T.-S., 2009a. A Comparison of the Dosimetric Characteristics of a Glass Rod Dosimeter and a Thermoluminescent
Dosimeter for Mailed Dosimeter. Radiat. Meas. 44, 18-22.
Salvat, F., Fernàndez-Varea, J. M., Acosta, E., and Sempau, J., 2001. PENELOPE-A code system for Monte Carlo Simulation of Electron and Photon Transport (Issy-les-Moulineaux: OECD Nuclear Energy Agency) (available in pdf format on the web at http://www.nea.fr) Xu, X.G., Bednarz, B., Paganetti, H., 2008. A review of dosimetry studies on external-beam radiation treatment with respect to second cancer induction. Phys. Med. Biol. 53, R193–R241.