HAL Id: hal-00296836
https://hal.archives-ouvertes.fr/hal-00296836
Submitted on 16 Dec 2005
HAL is a multi-disciplinary open access
archive for the deposit and dissemination of
sci-entific research documents, whether they are
pub-lished or not. The documents may come from
teaching and research institutions in France or
abroad, or from public or private research centers.
L’archive ouverte pluridisciplinaire HAL, est
destinée au dépôt et à la diffusion de documents
scientifiques de niveau recherche, publiés ou non,
émanant des établissements d’enseignement et de
recherche français ou étrangers, des laboratoires
publics ou privés.
Topography data harmonisation and uncertainties
applying SRTM, laser scanner and cartographic
elevation models
D. Haase, K. Frotscher
To cite this version:
D. Haase, K. Frotscher. Topography data harmonisation and uncertainties applying SRTM, laser
scanner and cartographic elevation models. Advances in Geosciences, European Geosciences Union,
2005, 5, pp.65-73. �hal-00296836�
Advances in Geosciences, 5, 65–73, 2005 SRef-ID: 1680-7359/adgeo/2005-5-65 European Geosciences Union
© 2005 Author(s). This work is licensed under a Creative Commons License.
Advances in
Geosciences
Topography data harmonisation and uncertainties applying SRTM,
laser scanner and cartographic elevation models
D. Haase1and K. Frotscher2
1UFZ – Centre for Environmental Research, Dept. of Applied Landscape Ecology, Permoserstr. 15, 04318 Leipzig, Germany 2Friedrich-Schiller-University Jena, Department of Geography, L¨obdergraben 10, 07743 Jena, Germany
Received: 7 January 2005 – Revised: 1 August 2005 – Accepted: 1 September 2005 – Published: 16 December 2005
Abstract. Only a few studies have attempted to quantify
topography-depending water fluxes, to evaluate retention and reservoir capacities and surface run-off paths within large river basins because data availability and data quality are crit-ical issues to face this objective. It becomes most relevant if water balance has to be calculated in large or transboundary river basins.
The advance of space based earth observation data offers a solution to this information problem. Therefore, this paper mainly focuses on weaknesses and strengths analyzing to-pography with SRTM (Shuttle Radar Toto-pography Mission) digital height data and thus provides techniques for their im-proved application in river network derivation, floodplain analysis, watershed hydrology in large as well as in large river basins (>1000 km2).
In the analysis different types of digital elevation mod-els (DEM), terrain modmod-els (DTM) and land cover classifica-tion data (biotope map, Corine Land Cover 1994) have been used. The DHMs are generated from Airborne Laser Scan-ning (0.5 m), topographic maps (10.0/50.0 m) and SRTM at 30.0 m and 90.0 m spatial resolution. SRTM digital height models are generated by Synthetic Aperture Radar (SAR) and show a high spatial variance in urban areas, regions of dense vegetation canopy, floodplains and water bodies. As study area serve the Elbe basin (Czech Republic, Ger-many) with its sub-basins and the Saale river basin (Ger-many, different federal countries Saxony-Anhalt, Saxony and Thuringia).
1 Introduction
One of the major challenges for an integrative European en-vironmental development is the integrated management of transboundary (water) resources and large river basins in or-der to secure a sufficient availability of clean water (Euro-Correspondence to: D. Haase
pean Union 2003, EC 2002a, b, Gleick 2003, GWP-TAC 2000). Thus, for integrated water management methodical designs are necessary which refer to the complexity of the river basins to be managed and the difficulty to predict the factors or driving forces influencing them (economic devel-opment, demographic change, migration, Lutz, 2001). As a severe problem regular flood events in the plains resulting enormous financial losses of >10 Millions of Euro have to be considered. Increasing demands on land utilization (set-tlements, trade) within the floodplains are the main reason therefore (Gleick, 2003).
Despite the above mentioned necessity only a few stud-ies, however, have attempted to quantify water flows or to evaluate topography-related retention and reservoir capaci-ties within large (transboundary) river basins because data availability and data quality are critical issues to face this objective. It is a methodical challenge to derive sound pa-rameter sets of terrain and there from derived hydrological data required for the implementation of the Water Frame-work Directive (WFD) in such large river basins or, at least across national and administrative boundaries (Pahl-Wostl et al., 20051; Lammersen et al., 2002).
Most of the higher resoluted elevation or terrain data are available often only for local sites, at the regional level for districts or federal states and, at most the national level. These data sets are not readily compatible at borderlines (Mysiak et al., 2004). Moreover, many higher resoluted ter-rain data (spatial resolution <50 m) are collected or compiled for specific purposes, projects or local/regional requirements and thus not available for larger areas/river basins.
Because of their ecological importance, spatial and topo-graphic heterogeneity it is still a challenge to analyse and to evaluate wetlands of large river basins, at regional, national and at transboundary level. Due to the ongoing exploitation
1Pahl-Wostl, C., Downing, T., Kabat, P., Magnuszewski, P.,
Meigh, J., Schlueter, M., Sendzimir, J., and Werners, S.: Transi-tions to Adaptive Water Management: The Newater Project, Water Policy, submitted, 2005.
66 D. Haase and K. Frotscher: Topography data harmonisation and uncertainties
Table 1. Properties of the Digital Elevation Model data set.
SRTM-3 SRTM-1 DTM10/50 Laser Scanner (LSM) type of data surface model surface model terrain model surface model resolution
horizontal vertical accuracy
300×300Lat & Long 90×90 m from 30×30 m
±6 m
100×100Lat & Long 30×30 m ±6 m different, e.g. 10×10 m ±0.5 m 0.5×0.5 m ±0.15 m Actuality Feb 2000 Feb 2000 different Apr 2003 data source Synthetic Aperture Radar
(C-Band-SAR)
Synthetic Aperture Radar (X-Band-SAR)
topographic data, e.g. isolines of topographic map 1:25 000
Last-Puls-Echo-Laser
Referring to borders cross-border, worldwide equivalent quality (80% of land surface) cross-border, worldwide equivalent quality (<80% of land surface) depending on national, regional borders, incon-sistent
depending on overflight-rights
Data availability free of charge, web-based, ftp-pull, available in blocks of 1◦Lat×1◦Lon
not free, available in blocks of 150Lat×150Lon per 400 EU
mostly not free of charge, distributed by national/regional agen-cies, different quality and data recording
blocks of 2×2 km TopoSys GmbH
of wetland reservoirs across Europe a successful protection and restoration of wetland functioning is extremely impor-tant and at a high level of the political agenda of the European environmental policy. Herewith related issues are a still miss-ing sound wetland classification and topographic inventory completed for most of the larger European catchments to carry out further hydrological and ecological assessment and to derive management options.
Earth observation (EO) platforms are the primary data source from which landscape patterns can be assessed (Her-zog et al., 2001; Blaschke et al., 2001). Without a priori information about these patterns, observations provided by remote sensing sensors data supply an independent and un-biased framework to analyse the land cover at multiple scales (Hay et al., 2002). Two important scale-specific characteris-tics need to be considered: first the spatial, spectral and tem-poral resolution of each image pixel and secondly the im-age characteristics themselves, i.e. geographical area, com-bined band-widths and temporal duration. Within these data sets, only objects with “real-world relevance” may serve as suggested units over a range of scales. Recent studies de-scribe how “image-objects”, nested in a hierarchical system of a multi-scale GIS framework are being detected and de-scribed by a Fractal Net Evolution Approach (FNEA) to re-duce this problem (Baatz et al., 2000; Schiewe, 2003; Hay et al., 2003). Our in the following presented approach is thus in agreement with the suggested key issues by latest landscape research: “data acquisition” and “scaling” (Wu and Hobbs, 2002; Jelinski and Wu, 1996).
The advance of space based earth observation (remote sensing) data offers a solution to the mentioned information and methodological problem.
2 Objectives of the paper
Therefore, this paper mainly focuses on the analysis of the topography information given by the Shuttle Radar Topog-raphy Mission (SRTM) digital height data in comparison to other public available (DTM10 for parts of the Elbe basin), high resolution topographic data sets (Laser Scanner Model of the Elbe river, see also Table 1) and Corine Land Cover data (1994, 2000) in order to answer the question: What are potential and accuracy problems of the new SRTM data set? Moreover, the paper provides information on how to quan-tify the land-cover-depending uncertainty of SRTM data. Fi-nally, first results of an application of the SRTM data in wa-tershed hydrology in two large river basins (transboundary Elbe basin, Saale basin) are presented. The investigation aims to support the establishment of spatial topography mod-els such as SRTM that will contribute directly to the deriva-tion of hydrological network data to be utilised for evaluaderiva-tion of wetlands regarding e.g. flood risk and wetland ecology. All data produced are embedded into a GIS-framework and thus applicable for water balance, run-off or other types of hydrological or land use modelling.
3 Propagation of uncertainty
In large or international river basins crossing (administra-tive/national) boundaries as well as in large wetlands the hy-drological response units (HRU) are often derived from a va-riety of data sets of different quality and resolution. An addi-tional source of uncertainty emerges from the need to trans-form these spatial data to a common map projection. We address especially on
– uncertainty due to boundary imprecision of the
D. Haase and K. Frotscher: Topography data harmonisation and uncertainties 67
14 Figures
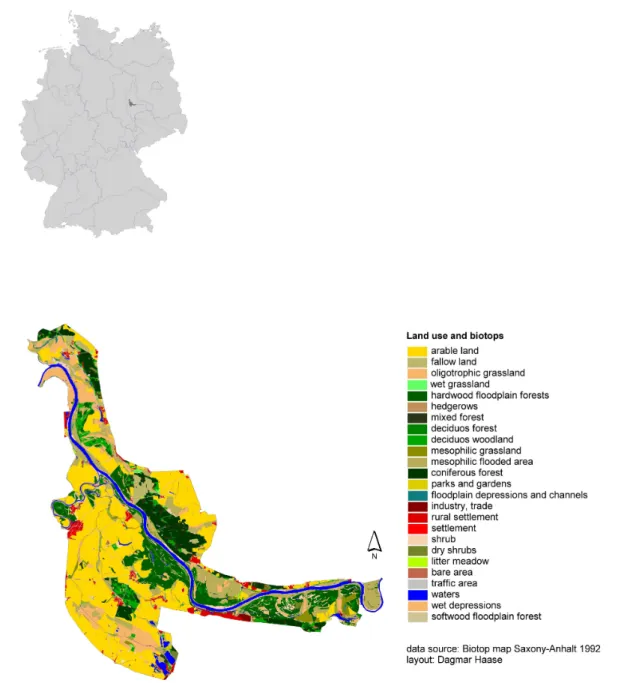
Figure 1: Land use types and biotops of the study area in the Elbe river basin.
Fig. 1. Land use types and biotops of the study area in the Elbe river basin.
– uncertainty surrounding different “land use/cover
classes” and “terrain (Figs. 2, 3) topography/slope in-dex” used as auxiliary variables,
– uncertainty resulting from using data aggregated to
larger spatial units (GTOPO DEM, http://edcdaac.usgs. gov/gtopo30/gtopo30.asp) and,
– at least uncertainty due to the integration of data
collected for different spatial units and using differ-ent methodologies/models (DTM50 of the Saale River basin utilised of the German implementation group of the WFD, DTM10 for the Elbe floodplains Decision Support System (DSS), Matthies et al. (2004), http: //elise.bafg.de, Fig. 6).
4 Study areas
An adequate example for large river basins is the Elbe basin covering areas of about 150 000 km2. The Elbe belongs to the largest river basins in Central Europe and has its outlet to the Northern Sea. Most parts of both basins are dominated by agrarian land use (arable land use: 43%, grassland: 16%, settlements: 16%) and therefore of interest for modeling dif-fuse matter discharge into the rivers. Moreover, the basins exceed federal boundaries in Germany and are affected by a considerable lack of basin-wide sound digital topography data.
As the major test site, the Elbe wetlands in the Ger-man federal country Saxony-Anhalt were selected (Fig. 1).
68 D. Haase and K. Frotscher: Topography data harmonisation and uncertainties
15
Figure 2: Methodical approach of data preparation (with CLC = Corine Land Cover 1994, SRTM = Shuttle Radar Topography Mission, DTM = Digital Terrain Model, ANOVA = Analyses of Variance).
Segmentation Hierarchical rule framework Co-registration, Resampling
Super Objects
Object features - Layer values
mean elev, stdev - Shape features
area, shape index - Texture - Thematic attribute CLC class member Digital Elevation Data Sets - SRTM - DTM - Laser Scanner CLC 1994 Biotope maps 1992 ANOVA for Object features Data quality and propagation of uncertainties for further applications
Primary data sets, worldwide available
Sub-Objects
Fig. 2. Methodical approach of data preparation (with CLC = Corine Land Cover 1994, SRTM = Shuttle Radar Topography Mis-sion, DTM = Digital Terrain Model, ANOVA = Analyses of Vari-ance).
Here, temporal flooding occurs. However, large parts of these unique floodplains are intensively used by agri-culture. Moreover, river embankment influences the an-nual inundation. In order to carry out a sound as-sessment procedure for monitoring these wetlands in the RIVA and EVALUWET projects (http://www.rhul.ac.uk/ environmental-research/evaluweb/index p.shtml) a set of in-dices describing the functionality of the floodplains had been developed, a.o. the spatial heterogeneity of topography. Therefore, the authors of this paper present results of the data harmonization and resolution analysis for the “L¨odderitzer forest” and the meadows “Sch¨oneberger Wiesen” in the Elbe floodplains near the city of Dessau which are characterized by high spatial heterogeneity, typical hardwood and soft-wood forests, a general high variety of species and a het-erogeneous floodplain topography (Fig. 1). As another com-parable large river basin the Saale basin had been included into the study to ensure the transferability of the findings dis-cussed here (Fig. 6).
For the derivation of the hydrological network based on SRTM data the 210.32 km long part of the Elbe river serves as study area (Figs. 1, 5, Table 4).
5 Methodical approach and data availability
5.1 Data sets
In the analysis different types of digital elevation models (DEM) and land cover classification data (biotope mapping, Corine Land Cover, 1994) have been used (Sun et al., 2003). The DEMs acquired are digital terrain models (DTM) gener-ated from topographic maps (10.0 m) and digital height mod-els (DHM) from Airborne Laser scanning (0.5 m) as well as SRTM height data at 30.0 m and 90.0 m spatial resolution (see also Table 1). In contrast to DTMs, DHMs represent
16
Figure 3: Mean elevation values for selected biotope map objects (1992) in data sets of Laser Scanner (5m), of DTM10 (10 meters) and SRTM-1/3 (X and C-Band; 30 and 60 meters)
Fig. 3. Mean elevation values for selected biotope map objects
(1992) in data sets of Laser Scanner (5 m), of DTM10 (10 m) and SRTM-1/3 (X and C-Band; 30 and 60 m).
surfaces including vertical height offsets over buildings and vegetation, depending from structure’s backscattering centre. In the course of the river basin analysis we used the data set obtained during the SRTM Shuttle Radar Topog-raphy Mission carried out by NASA, DLR and ASI (web-site: http://www2.jpl.nasa.gov/srtm/). The Shuttle Radar Topography Mission obtained elevation data (surface mod-els) on a near-global scale to generate the most complete high-resolution digital topographical database of Earth so far. SRTM consisted of a specially modified radar system car-ried on board the space shuttle Endeavour during an 11-day mission in February 2000 (Schmullius et al., 2000). SRTM digital height models are generated by C- and X-Band SAR and show a high spatial variance in urban areas, regions of dense vegetation canopy, floodplains and waterbodies. For comparison regional DTM data sets (10×10 m to 50×50 m for the Saale basin and the L¨odderitzer forest area) and 5 m to 30 m- resampled Laser Scanner Models (LSM, 0.5 m original spatial resolution for the Elbe basin, German Water Agency) have been used. They were obtained by the regional and na-tional authorities. In order to derive topographic parameters for large river basins from these DEM’s often boundary ef-fects and missing transfer pixel to other administrative units limit the use of the elevation data.
The SRTM data are available in Geographic Lat/Long ori-ented to the WGS84 ellipsoid and a reprojection and datum shift to the Bessel Ellipsoid and Potsdam Datum as refer-ence system was applied. In contrast to SRTM-3 the SRTM-1 data represent not geoidal but ellipsoidal heights with a mean height offset from 44 m over arable land in the test area. This corresponds with Koch et al. (2002) for a similar test area. The Radar backscatter in forested areas can considered as the sum of two main contributions, the scattering from the upper part of the forest canopy and from the ground. Backscatter at a high frequency (X-band) will be dominated by scattering processes in the crown layer of branches and foliage in the canopy. The lower the frequency (C-Band) the more major
D. Haase and K. Frotscher: Topography data harmonisation and uncertainties 69
Table 2. Data set description for Elbe test sites.
LC class No. of Objects Area DEM type Mean Object height Mean Object stdev Regression func-tion for DTM10 L¨odderitzer Forest Biotope map (focus on tree classes) 327 20 km2 LSM 5 m DTM10 SRTM-1 SRTM-3 56.20 56.60 60.90 59.70 0.91 0.48 3.26 1.65 −4.5+1.1× 26.8+0.5× 18.9+0.6× Part of the ELBE basin CLC (all) 251 275 km2 LSM 30 m SRTM-3 55.23 56.83 5.98 5.55
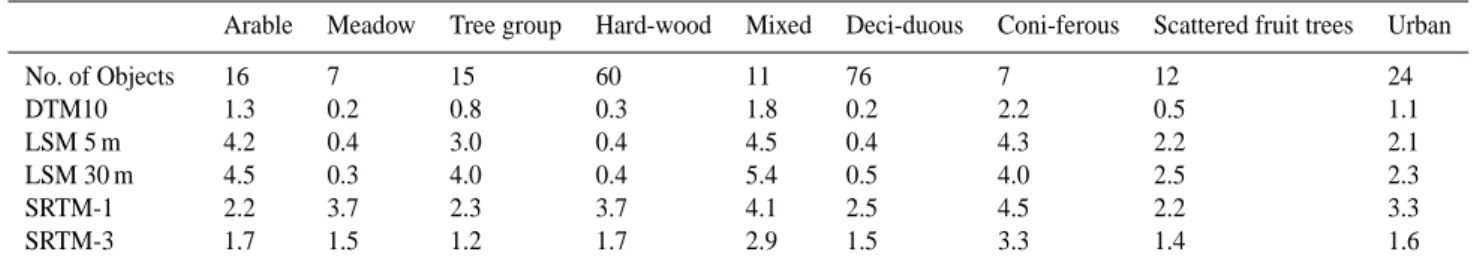
Table 3. Mean DEM standard deviations for specific Biotope map classes (L¨odderitzer Forest).
Arable Meadow Tree group Hard-wood Mixed Deci-duous Coni-ferous Scattered fruit trees Urban
No. of Objects 16 7 15 60 11 76 7 12 24 DTM10 1.3 0.2 0.8 0.3 1.8 0.2 2.2 0.5 1.1 LSM 5 m 4.2 0.4 3.0 0.4 4.5 0.4 4.3 2.2 2.1 LSM 30 m 4.5 0.3 4.0 0.4 5.4 0.5 4.0 2.5 2.3 SRTM-1 2.2 3.7 2.3 3.7 4.1 2.5 4.5 2.2 3.3 SRTM-3 1.7 1.5 1.2 1.7 2.9 1.5 3.3 1.4 1.6
woody biomass components are involved in the backscat-ter process. Next to the structure of scatbackscat-ters, the moisture content (dielectric constant) of the vegetation material has a strong influence (Ulaby et al., 1986). Studies on the relation-ship between backscatter coefficient and tree stem volume at the C-band have shown saturation of the backscatter already at low stem volumes from about 50–100 m3/ha (Askne et al., 1997). Above this level, the backscatter does not provide an additional height offset.
5.2 Derivation of relevant parameters for DEM analysis Different aspects have been chosen for detailed studies. First, we compared the absolute (mean elevation) and contextual (surface roughness) properties of high-resolution LSM, to-pographic models and medium-resolution Radar models for the specific part of the “L¨odderitzer Forst” in the Elbe flood-plains (Fig. 1). The standard deviation was computed as a measure of vertical structural variability. After outlier re-moval we thinned the high resolution LSM ASCII data out by keeping every 16th height value (2×2 m ground resolution) to reduce the data amount of the river-course-covering raster (7728 km2) from 32 to 4 Megabyte per square kilometre. Further, we applied cubic convolution resampling to 5×5 m and 30×30 m to get an integrated height value for the kernel in the generalized LSM image and performed tile mosaicing. Kellndorfer et al. (2004) showed that the relative vertical er-ror due to phase noise can be reduced significantly through sample averaging. In the LSM, buildings were masked out in the original data. These gaps were interpolated, so that in urban areas the model loose his surface model characteris-tics and can be seen as a terrain model. The SRTM-3 image data (3 arc seconds or about 90 m ground resolution) were
generated from 1 arc second C-Band SAR data (about 30 m ground resolution). Under this specification we resampled (cubic) the SRTM-3 data to 60×60 m ground resolution for a more detailed description of surface undulations. As result, we are able to compare the absolute and contextual high olution elevation information with DEMs on a medium res-olution scale level. Mean elevation is represented by image grey level values. Surface roughness can understand as im-age grey level texture with the standard deviation of elevation values as a description.
5.3 Statistics
First we applied a segmentation approach (eCognition soft-ware, Definiens, 2004) which allows the textual and spatial intersection of the continuous raster elevation data (Laser, Radar) to extract objects based on the corresponding spatial thematic vector data sets (Biotope map, 1994, Corine Land Cover nomenclature, 2000). Multiresolution segmentation is a bottom up region-merging technique starting with one-pixel objects. In numerous subsequent steps, smaller image objects are merged into bigger ones. The segmentation pro-cedure should produce highly homogeneous segments for the optimal separation and representation of image (height) gions. Segmented units which are too small or merging re-gions that do not belong to each other can control by applying meaningful scale parameter thresholds. Here, the land cover classes serve as super objects and sub-objects were created from DEM grey level elevation values within the super ob-ject boundaries. As a result we obtain attribute tables con-taining mean elevation, standard deviation, area, shape index and land cover class ID for every segmented sub-object.
70 D. Haase and K. Frotscher: Topography data harmonisation and uncertainties
17
Figure 4: Mean elevation values for selected Corine Land Cover objects (1994) in data sets of resampled Laser Scanner (30 meters) and SRTM-3 (C-Band; 60 meters)
Fig. 4. Mean elevation values for selected Corine Land Cover
ob-jects (1994) in data sets of resampled Laser Scanner (30 m) and SRTM-3 (C-Band; 60 m).
Secondly, we applied General Linear Models (GLM) and here the one-way analysis of variance (ANOVA) to test the attributes for significant differences between mean values by comparing variances. The GLM is a generalization of the linear regression model, such that effects can be tested for continuous predictor variables, as well as for effects for cat-egorical predictor variables. In one-way ANOVA designs, the effect of a single categorical grouping variable (BIOTOP map class or CORINE class) on one or more continuous de-pendent variables (e.g. Laser and Radar object mean eleva-tion or standard deviaeleva-tion values) can be evaluated.
By partitioning the total variation into different sources, we are able to compare the variance due to the between-groups (height values between different sensors) variabil-ity with that due to the within-group variabilvariabil-ity. Under the null hypothesis (that there are no mean differences between groups), the variance estimated from the within-group vari-ability should be about the same as the variance estimated from between-groups variability. This latter least square means effect from between-groups variability is then tested on statistical significance.
The confidence intervals (cf. Fig. 2) for the mean give a range of values around the mean where it can expect the “true” mean is located with a given level of certainty. Here should be mentioned that the width of the confidence inter-val depends on the sample size and on the variation of data values.
Last we analysed the DEM data in terms of automated flow path derivation. We created raster-formatted D8 flow grids for LSM and SRTM datasets which show the direc-tion that water moves from each pixel in the DEM. To at-tribute every channel segment in the river network we used vector-formatted tree-files and a Strahler-stream order. We pruned away the first to seventh order streams, getting an even coarser tree graph for a spatial comparison with the WFD-underlying hydrography.
18
Figure 5: Reliability of derived stream network from SRTM data for certain buffer distances around the Laser Altimetry Model derived main stream of the Elbe.
Fig. 5. Reliability of derived stream network from SRTM data for
certain buffer distances around the Laser Altimetry Model derived main stream of the Elbe.
6 Results
We compared the SRTM-3 data with different DEM and Land Cover data sets (Biotope map, Corine Land Cover). The procedure have been carried out for parts of the Elbe basin (utilizing biotope mapping classes, LSM5, DTM10 and SRTM-1 (Fig. 4) to find general statistical values of uncer-tainty of the elevation data with focus on vegetation (Ta-ble 2). Generally speaking, there is high concordance be-tween absolute elevation values of SRTM, DTM10 and Laser Scanner data. For some land cover classes, however, the differences caused by different backscatter laser and radar signals are considerable. Table 3 summarizes DEM sur-face roughness for different tree vegetation. The mean ob-ject standard deviation is by far lowest for the terrain model DTM10. The resampled LSMs show effects of high resolu-tion situaresolu-tions in the original ground resoluresolu-tion, where in less dense tree vegetation structures the laser pulse hits the tree, the ground or even a ditch. In contrast, SRTM with 30×30 m ground capturing integrates all structures. In this low resolu-tion situaresolu-tion the height offset depends from sensor’s vege-tation penetration capabilities and induce lower standard de-viations. The higher variances in SRTM-1 (X-band) are re-duced to objects close to the Elbe river course, which itself show very high variance in elevation values. Several factors such as terrain effects could lead to phase de-correlation in the X-SAR image. Obvious here is the backscattering mech-anism over water and ice (February 2000) which probably made the generation of the DEM difficult.
In Fig. 5 we compared SRTM-3 with LSM30 on the base of CLC classes for 275 km2 along the Elbe river course. Again, a high concordance between absolute mean eleva-tion values of the two models can point out. Considerable height differences were found for forests und shrubs and ex-plained with alternating horizontal and vertical high and low resolution situations during recording over generalized CLC classes.
D. Haase and K. Frotscher: Topography data harmonisation and uncertainties 71
Table 4. Deviation of the Elbe main stream derived from SRTM data compared to the Laser Altimetry (LSM) derived Elbe main stream
(L¨odderitzer Forest).
Buffer distance from LSM length SRTM derived Elbe ength SRTM derived Elbe main stream derived Elbe stream (m) main stream (m) within the buffer distance (%)
100 4 110.26 3.83 200 5 754.31 5.35 300 7 758.78 7.22 600 12 141.26 11.31 900 13 780.38 12.78
19
Figure 6: Reliability of derived stream network from SRTM data for certain buffer distances and different landscape types in the Saale river basin compared to the stream network derived from the cartographic 50x50 meters DTM (red - 180m and 2 pixels SRTM, orange - 540m and 6 pixels SRTM, light green – 1 350m and 5 pixels SRTM and dark green – 5 000m and 55 pixels SRTM).
Fig. 6. Reliability of derived stream network from SRTM data for certain buffer distances and different landscape types in the Saale river
basin compared to the stream network derived from the cartographic 50x50 meters DTM (red - 180 m and 2 pixels SRTM, orange – 540 m and 6 pixels SRTM, light green – 1350 m and 5 pixels SRTM and dark green – 5000 m and 55 pixels SRTM).
For hydrological analysis such as flow code computing a sound analysis of the digital topography data could be a sig-nificant source of errors when ignored. Therefore, as the last part of this paper a first application of the SRTM data set is given.
The application of the SRTM data set allowed the timely and costly collection of national data sets to be avoided and speeded up the application of hydrological models such as Hydro Tools (ESRI), SWAT (Soil and Water Assessment Tool, http://www.brc.tamus.edu/swat/) or the 2-D-flood fore-casting model TrimR2D (Haase et al., 2004). First, the from Laser Altimetry (LSM) derived main stream of the Elbe river course in the “L¨odderitzer Forst” area were compared to the same part of the Elbe stream network calculated from SRTM data (Fig. 5, Table 4). Here, with increasing distance to the LSM derived stream (buffer distances from 100 to 900 m
used) the percentage of predicted stream length according to SRTM increased too. Generally, due to the lowland po-sition of the “L¨odderitzer Forst” area, the error proportion of the SRTM derived stream course of the Elbe is considerable although it decreases from 96% to 87%. The reason for the low accuracy of SRTM in “meeting” the real stream course of the Elbe is that an artificial dam (error in SRTM data) in the “L¨odderitzer forest” area provokes that the “SRTM-stream” leaves the main valley and enters an old river course in the large floodplain. Otherwise, the replication of the LSM derived stream through SRTM derived stream course would have been higher (see also Fig. 6).
To prove the increasing accuracy of SRTM derived stream networks with increasing topography index and relief the hy-drological network of the total Saale river basin was derived from SRTM and DTM50 data utilizing the DEM-processing
72 D. Haase and K. Frotscher: Topography data harmonisation and uncertainties procedure of the River Tools software which allows
water-shed delineation due to the Strahler river network model (Fig. 6, Strahler, 1975). Figure 6 shows that most errors arise when deriving stream length and stream pathways in densely populated and vegetated lowland areas as for the Saale river basin (Leipzig lowlands, Thuringian lowlands). Here, major parts of the delineated Saale channel devi-ate more than 4500 m from the stream derived from the 50×50 m topographic-map or cartographic DEM. In con-trast, the deviation of the SRTM derived stream network compared to the cartographic model one in the hilly and mountainous areas in the south of the Saale basin is consid-erably lower (cf. Fig. 6).
Concluding for both stream network studies there was found that local disturbances in the flow path calculation from SRTM data are forced by land cover (urban areas, forested land) and phase de-correlation over larger water bodies. Moreover, the deviation of the derived stream net-work is the higher the topography index and the sloppiness decrease (similar findings have been found in the remote sensing working group of the University of Berlin, informa-tion by Patrick Hostert).
The results demonstrate how stream networks derived from the SRTM data deviate from stream networks (available for the scales 1:25 000 and 50 000) collected by the regional environmental agencies and national services. The shares of the buffer distances exceeded vary from lowlands to moun-tainous areas and show best results in hilly areas.
7 Conclusions
Concluding, there are two major outcome results of this study. First, with an adequate image comparison method-ology of Laser-, cartographic and Radar-DEMs we were able to illustrate the quality of SRTM-DHM’s compared with other digital elevation data sets such as Laser altimetry and topographic-map based DEM’s. Moreover, the paper gives first ideas how these SRTM data could be applied in meso-and macro-scale river network meso-and terrain analyses as well as terrain analysis at the examples of the Elbe river basin.
Besides investigating regional environmental problems the SRTM data sets are of major relevance for providing ter-rain information in large and transboundary river basins in the “new” and “data-poor” 25-Europe and the neighbouring countries such as Romania or the Ukraine where is basic data on topography needed.
There can be further concluded that the SRTM data sets are normally less precise than the small-scale topography data available at state or regional level, but, however, the inte-gration of the latter data from different sources when river basins and sub-basins extend into a number of states is also surrounded by considerable uncertainty. In most of the trans-boundary basins of Europe, comparable digital terrain data sets are not available.
Moreover, an a priori uncertainty assessment of the data is not supplied by the data collectors. Thus, there is a trade-off
between using standardised though less precise information and highly heterogeneous and more precise data. In addition, in the former case the information about the uncertainty is either already available or obtainable at low cost; in the latter the uncertainty assessment is often not a priori available and its completion is cost- and time-consuming. Here, the application of the SRTM data will be a cost-efficient and in-formative solution which is web-based worldwide available and appropriately to be implemented into a GIS-framework as shown in this paper and considering the here discussed uncertainties.
Edited by: P. Krause, K. Bongartz, and W.-A. Fl¨ugel Reviewed by: anonymous referees
References
Baatz, M. and A. Sch¨ape: Multiresolution segmentation – an opti-misation approach for high quality multi-scale image segmenta-tion, Angewandte Geographische Informationsverarbeitung XI, Vortr¨age zum AGIT-Symposium Salzburg, edited by: Strobl, J., Blaschke, T., and Griesebener, G., Herbert Wichmann, Heidel-berg, 12–23, 2000.
Blaschke, T., Conradi, M., and Lang, S.: Multi-scale image analy-sis for ecological monitoring of heterogeneous, small structured landscapes, Proceedings of SPIE, 4545, 35–44, 2001.
Definiens: http://www.definiens-imaging.com/, 2004.
European Union: Guidance for the analysis of pressures and im-pacts in accordance with the Water Framework Directive acces-sible on internet under http://forum.europa.eu.int (accessed on 20.06.2004), 2003.
European Commission: Cooperation without frontiers – Structural policies and European territory, European Union, Regional Pol-icy, European Communities, Luxembourg, 2002a.
European Commission: Raising environmental standards across Europe, Environment for Europeans, 9, 10–11, 2002b.
Gleick, P. H.: Global Freshwater Resources: Soft-Path Solutions for the 21st Century, Science, 302, 524–528, 2003.
GWP-TAC: Integrated Water Management, TEC Background Pa-pers No. 4, Global Water Partnership, SE-105 25 Stockholm, Sweden, ISBN 91-630-9229-8, 2000.
Haase, D., Hirt, U., M¨oller, M., Rosenberg, M., Schmidt, G., We-ichel, T., and M. Volk: Analysis of water and matter balance using Corine Land Cover data on different spatial scales, UBA-Texte, 4, 4, 229–233, 2004.
Hay, G. J., Dub´e, P., Bouchard, A., and Marceau, D. J.: A scale-space primer for exploring and quantifying complex landscapes, Ecological Modelling, 153, 27–49, 2002.
Hay, G. J., Blaschke, T., Marceau, D. J., and Bouchard, A.: A com-parison of three image-object methods for the multiscale analysis of landscape structure, ISPRS Journal of Photogrammetry & Re-mote Sensing, 57, 327–345, 2003.
Herzog, F., Lausch, A., M¨uller, E., Thulke, H.-H., Steinhardt, U., and Lehmann, S.: Landscape metrics for the assessment of landscape destruction and rehabilitation, Environmental Man-agement, 27(1), 91–107, 2001.
H¨ogland, L.: Household demand for water in Sweden with implica-tions of a potential tax on water use, Water Resour. Res., 35(12), 3853–3863, 1999.
Jelinski, D. E. and Wu, J.: The modifiable areal unit problem and implications for landscape ecology, Landscape Ecology, 11(3),
D. Haase and K. Frotscher: Topography data harmonisation and uncertainties 73
129–140, 1996.
Koch, A., Heipke, C., and Lohmann, P.: Bewertung von SRTM Digitalen Gel¨andemodellen – Methodik und Ergebnisse, Photogrammetrie-Fernerkundung-Geoinformation, 6, 389–398, 2002.
Krauß, S.: Qualitative Beschreibung von unsicheren topologischen Relationen innerhalb des Minimum-/Maximum-Modells, Diplo-marbeit Institut f¨ur Photogrammetrie, Universit¨at Stuttgart (un-ver¨off.), 1998.
Lammersen, R., Engel, van de Langemheen, H., and Buiteveld, H.: Impact of river training and retention measures on flood peaks along the Rhine, J. Hydrol., 267, 115–124, 2002.
Lutz, W.: The end of World Population Growth, Nature, 412, 543– 545, 2001.
Matthies, M., Berlekamp, J., Lautenbach, S., Graf, N., and Reimer, S.: Decision Support System for the Elbe River-Water Quality Management, http://mssanz.org.au/modsim03/ Media/Articles/Vol{\%}201{\%}20Articles/284-289.pdf, 2004. Mysiak, J., Rosenberg, M., Hirt, U., Haase, D., Petry, D., and
Frotscher, K.: Uncertainty in spatial data transformation for the implementation of the water framework directive, proceedings of the 10th EC-GI & GIS Workshop Warsaw 2004 (CD-version), 2004.
Schiewe, J.: Integration of multi-sensor data for landscape model-ing usmodel-ing a region-based approach, ISPRS Journal of Photogram-metry & Remote Sensing, 57, 371–379, 2003.
Schmullius, C., Fl¨ugel, W.-A., Frotscher, K., Hochschild, V., and M¨uschen, B.: The Shuttle Radar Topography Mission (SRTM) and Applications in Europe, Africa und Siberia, Photogrammetrie-Fernerkundung-Geoinformation, 5, 361–366, 2000.
Strahler, A. N.: Physical geography, 4th Ed., Wiley, New York, 1975.
Sun, G., Ranson, K. J., Kharuk, V. I., and Kovacs, K.: Validation of surface height from shuttle radar topography mission using shuttle laser altimeter, Remote Sensing of Environment, 88, 401– 411, 2003.
Ulaby, F. T., Moore, R. K., and Fung, A. K.: Microwave remote sensing: active and passive, Vols. 1–3, Dedham, MA, Artech House, 1986.
Wu, J. and Hobbs, R.: Key issues and research priorities in land-scape ecology, Landland-scape Ecology, 17(4), 355–365, 2002.