HAL Id: hal-00359811
https://hal.archives-ouvertes.fr/hal-00359811
Submitted on 9 Feb 2009
HAL is a multi-disciplinary open access
archive for the deposit and dissemination of
sci-entific research documents, whether they are
pub-lished or not. The documents may come from
teaching and research institutions in France or
abroad, or from public or private research centers.
L’archive ouverte pluridisciplinaire HAL, est
destinée au dépôt et à la diffusion de documents
scientifiques de niveau recherche, publiés ou non,
émanant des établissements d’enseignement et de
recherche français ou étrangers, des laboratoires
publics ou privés.
Ocean color measurements onboard a jet-ski: consistency
for calval exercise of high-resolution satellite imagery?
Nadège Martiny, Aurélie Dehouck, Jean-Marie Froidefond, Nadia Sénéchal
To cite this version:
Nadège Martiny, Aurélie Dehouck, Jean-Marie Froidefond, Nadia Sénéchal. Ocean color measurements
onboard a jet-ski: consistency for calval exercise of high-resolution satellite imagery?. SPIE, Nov 2008,
Nouméa, New Caledonia. 10 p. �hal-00359811�
Ocean color measurements onboard a jet-ski :
consistency for calval exercise of high-resolution satellite imagery?
Nadège Martiny
(1), Aurélie Dehouck
(1), Jean-Marie Froidefond
(1), and Nadia Sénéchal
(1)(1)
OASU-EPOC, UMR 5805 CNRS, Université Bordeaux 1, Av. Facultés, F-33405 Talence, France
(
[email protected]
)
ABSTRACT
An original data set has been acquired on the 5th of April 2008 during the international field experiment ECORS-Truc Vert 2008 (SW France) in the nearshore zone over a complex bathymetry and in moderate turbid waters (SPM <10 mg/l). This data set synchronizes in-situ reflectance measurements onboard a jet-ski, bathymetric surveys and a Formosat-2 high-resolution satellite acquisition.
The jet-ski provides an interesting mean to gather optical data in shallow waters and in environments hard to sample with traditional coastal ships. An experimental device has been implemented on the jet-ski, equipped with two TRIOS RAMSES sensors which measure simultaneous atmospheric downwelling irradiances Ed and in-water upwelling
radiances Lu in the 350-950nm range. Water samples have also been collected at different stages of the jet-ski trajectory
(3-25m water depth) in order to assess the concentrations of the ocean constituents (SPM and Chl-a).
In the current study we present a methodology to validate FORMOSAT-2 high-resolution ocean color data using “jet-ski” reflectance measurements, which first require a detailed analysis. The reflectance spectra measurements are shown to be consistent : (i) they are typical of the presence of mineral particles with light absorption at short wavelengths ; (ii) their shape and magnitude depend on the depth and the water type (turbidity) ; (iii) some of them, especially in low turbid waters, are similar to other reflectance spectra measured northward from a ship (Gironde mouth). Thus, the use of “jet-ski” ocean color measurements appears to be adequate for remote sensing calval activities in shallow case-2 waters. Keyword list: Coastal shallow case-2 waters; In-situ ocean color measurements; Jet-ski; High-resolution FORMOSAT-2 imagery
1.
INTRODUCTION
The ECORS-Truc Vert international field campaign took place in March-April 2008 in the South West of France, on the Aquitanian Coast. The goal of this experiment was to improve the understanding of nearshore hydrodynamics processes, for model calibration and validation. Several excellent field data sets have been collected since the 1970’s from a few beaches. The ECORS-Truc Vert campaign was designed to fill gaps in previous data sets [1]. In this framework, numerous instruments were set up in the ECORS-Truc Vert site to measure hydrodynamics processes, sediment characteristics and transport, and morphodynamics of the beach over many scales under energetic swell and macro-tidal conditions : for instance, video systems on the embryonic dune, pressure sensors lines above and under the sand, current sensors into the water. The topography/bathymetry was regularly surveyed using a GPS onboard a quad for the upper part of the beach and a jet-ski for the rest of the profile.
On the 5th of April 2008, a unique data set was acquired, synchronizing in-situ reflectance measurements onboard a jet-ski, bathymetric surveys and a FORMOSAT-2 high-resolution satellite scene.
The jet-ski, usually used for bathymetry surveys, was equipped with two spectroradiometers, in order to measure simultaneous atmospheric downwelling irradiances Ed and in-water upwelling radiances Lu in the 350-950nm range, and
a Garmin GPS in order to geolocalise the jet-ski trajectory. The goal of this experimental device was to collect in-situ ocean color measurements in shallow waters which are environments hard to sample with traditional coastal ship. Moreover, in-situ reflectance spectra measurements are essential to validate high-resolution ocean color satellite imagery in coastal environment. Indeed, high-resolution optical remote sensing is an important tool in beach morphodynamics
studies as the sand bar systems on the beach can be covered at a few-meter resolution over several kilometres alongshore.
This unique synchronous data set represents a good opportunity : i) to validate high-resolution “ocean color” products in coastal shallow and turbid waters, ii) to test empirical and optical inversion algorithms for mapping bathymetry. The latter work is discussed in a companion paper [2]. The former work first requires a preliminary step that is the validation of the jet-ski ocean color measurements. This is the issue of the current paper. The first part is dedicated to the presentation of the study site and the data sets. The second part presents the methodology. The third part focuses on the results. The discussions and conclusion close the paper.
2.
STUDY SITE AND DATA SETS
2.1 The study siteThe study site is located in the Bay of Biscay (Fig 1a), southward the Gironde mouth, and on the west of the Arcachon Lagoon (Fig 1b). The “ECORS-Truc Vert” site (lat. [44.73N:44.75N]; lon. [1.28W:1.23W]) is particularly interesting for dynamics studies as it presents a double sand bar system (Fig 1c). During the ECORS field experiment, a temporary scientific camp was installed on the Truc Vert beach from March to April 2008 (Fig 1d). The topography of the upper part of the beach (from +2m to +6m) was regularly evaluated by use of GPS onboard a quad. The bathymetry of the nearshore zone from water depths ranging from -25m to +2m was surveyed using a jet-ski.
Figure 1. Location of the study site : (a) Bay of Biscay as seen by MODIS; (b) the Arcachon Lagoon and the ECORS-Truc Vert site as
seen by SPOT-4 (10m) on the 7th of February 2008; (c) aerial photography of the ECORS-Truc Vert site in January 2008; (d) picture
of the scientific camp during the ECORS experiment (March 2008); (e) set-up of the TRIOS RAMSES sensors onboard the jet-ski
before measurements on the 5th of April 2008.
2.2 The data sets
The jet-ski, usually used for bathymetry surveys, was equipped with two TRIOS RAMSES sensors (Fig. 1e), which measure simultaneous atmospheric downwelling irradiances Ed and in-water upwelling radiances Lu in the 350-950nm
range, and a Garmin GPS with a 5-meter accuracy in order to geolocalise the jet-ski trajectory. The two
(a)
(c)
ECORS-Truc Vert site Arcachon lagoon ebb delta sand supplied by the southward littoral driftthe very huge Dune du Pilat (100 m height) Cap Ferret peninsula Bordeaux 40 km City of Arcachon ECORS-Truc Vert site Arcachon lagoon ebb delta sand supplied by the southward littoral drift
the very huge Dune du Pilat (100 m height) Cap Ferret peninsula Bordeaux 40 km City of Arcachon ECORS-Truc Vert site Arcachon lagoon ebb delta sand supplied by the southward littoral drift
the very huge Dune du Pilat (100 m height) Cap Ferret peninsula Bordeaux 40 km City of Arcachon
(b)
(c)
(d)
(e)
spectroradiometers were set up on the metallic structure at the back of the jet-ski. The irradiance sensor, which is at 1.5 meter from the water surface, points at the sky with a view zenith angle θv=0°. The radiance sensor, submerged by 10 to
50 centimers of water depending on the sea-state, points at the bottom with a view zenith angle θv=180°.
The jet-ski measurements started at 15H UT and ended at 16H UT on the 5th of April 2008. The sea-state conditions were optimum (mean wave heigth of 0.5m, tide level of +4m) and the sky was prefectly clear and stable (no clouds at all). The jet-ski covered a 2-km offshore transect and a 600-m alongshore distance before coming back to the departure point (Fig. 2a). The bathymetry map acquired the same day, using another jet-ski, shows water depths ranging from 3 to 12m (Fig. 2b). The extensive nearshore bathymetric map, combining jet-ski and ship surveys, and covering the entire jet-ski trajectory (3 to 25m), is not shown as it is not available yet. The radiance and irradiance measurements were recorded every 2 seconds along the jet-ski trajectory. Thus, more than 2000 spectra have been acquired and processed to invert remote sensing reflectances.
Figure 2. The cross-shore jet-ski trajectory on the 5th of April 2008 : (a) represented in red on an image of the the ECORS-Truc-Vert
site. The white spots indicate the location and the time of the water samples ; (b) partially superimposed to bathymetric surveys acquired the same day with another jet-ski.
Figure 3. The FORMOSAT-2 acquisitions on the 5th of April 2008 : (a) an 8-m multispectral scene of the Arcachon lagoon and the ECORS-Truc Vert site; (b) an 8-m multispectral scene of the Sanguinet Lake; (c) same as (a) with a 2-m panchromatic scene; (d) same
as (b) with a 2-m panchromatic scene.
During the jet-ski experiment, water samples were also collected at four different times and locations: at 15h21, 2km cross-shore (in supposedly clear waters), at 15h30, 15h41 and 15h47 on the way back (in supposedly moderate to turbid
1°16’W 1°15’W 1°14’W 1°17’W 4 4 °4 5 ’N 4 4 °4 4 ’N a 1°16’W 1°15’W 1°14’W 1°17’W 4 4 °4 5 ’N 4 4 °4 4 ’N 1°16’W 1°15’W 1°14’W 1°17’W 4 4 °4 5 ’N 4 4 °4 4 ’N a a
(a)
(b)
(b)
(c)
(d)
(a)
(b)
(b)
(c)
(d)
waters). These samples were analysed using Whatman GF/F filters to assess the concentrations of the ocean constituents (chlorophyll-a and Suspended Particulate Matter).
Independently from the ECORS campaign, high-resolution SPOT-4 and FORMOSAT-2 data sets are regularly acquired over the Arcachon lagoon and adjacent ocean beaches in the frame of the KALIDEOS-Littoral data base of the French spatial center (CNES). On the 5th of April 2008, two high-resolution FORMOSAT-2 scenes were successfully acquired: the fisrt one clearly pictures the Truc Vert site (Fig 3a and c), the second one pictures the Sanguinet Lake (Fig. 3b and d), located southward the Arcachon Lagoon (Fig. 1b). Only the former acquisition is adapted to the study. The acquisition time was at 10h38 UT, which is almost 1h after the spring low tide level (+0.66m above the lowest astronomical tide level). The FORMOSAT-2 L1A products (Top-Of-Atmosphere reflectance) were downloaded from the KALIDEOS-Littoral website (http://kalideos.cnes.fr ) for free in the frame of the KALIDEOS-Littoral partnership. The first scene is panchromatic (450-900nm), at a 2-meter spatial resolution (Fig. 3 b and d); the second one is multispectral (Tab. 1), at an 8-meter resolution (Fig. 3a and c).
Multispectral (MS)
Panchromatic (PAN) Spectral band Blue
450-520 nm Green 520-600 nm Red 630-690 nm Near Infrared 760-900 nm 450-900 nm Spatial resolution 8 m 2 m
Table 1. The FORMOSAT-2 spectral bands and associated spatial resolution.
3.
METHODOLOGY
The unique synchronous data set (in-situ ocean color measuements onboard a jet-ski, water samples, high-resolution satellite imagery and bathymetry surveys) acquired on the 5th of April 2008 represents a good opportunity : (a) to test the jet-ski device as a confident mean to collect optical data sets in shallow waters which are environments hard to sample with traditional coastal ship; (b) to validate and/or calibrate (calval) the high-resolution satellite imagery in coastal environments [3], [4].
In the following we present a calval methodology for high-resolution FORMOSAT-2 imagery using the jet-ski measurements.
3.1 FORMOSAT-2 water-leaving radiance
The FORMOSAT-2 Top-Of-Atmosphere radiance Lt can be expressed as follows [5]:
[
]
[
wc w]
o w wc g o atm tL
L
s
T
L
L
T
L
L
L
+
−
+
+
−
−
+
=
.
1
)
(
.
).
(
)
/
exp(
.
).
/
exp(
τ
µ
τ
µ
θ
θ
, (1)where τ is the total optical thickness, T the total atmospheric transmission, s the atmospheric spherical albedo, θ and θ0
the view and solar zenith angle, µ and µ0 the cosinus of θ and θ0, respectively.
Lg is the “glitter” radiance resulting form the Fresnel reflection and Lwc the “whitecaps” radiance resulting from the
presence of foam.
Latm is the atmospheric radiance that can be expressed as :
)
(
)
(
)
(
)
(
λ
aλ
rλ
raλ
atmL
L
L
L
=
+
+
, (2)with La the aerosol radiance, Lr the Rayleigh radiance, and Lra the radiance resulting the aerosol-molecule coupling.
Lw is the water-leaving radiance, which is a key parameter for ocean color remote sensing. This parameter can be
measured in-situ (e.g. [6]). Moreover, it enables to derive the concentrations of the ocean constituents through specific ocean color algorithms (e.g. [7]). Thus, Lw is the required parameter from the FORMOSAT-2 data set.
Lw results from Lt through complex atmospheric corrections (Eq. (1)). The atmospheric term Latm represents the main
component of the total signal (approximately 80%), but also the most difficult to model. It is first derived in the near infrared, where Lw is null considering the “black pixel” assumption [8], and extrapolated towards the short wavelengths
of the visible (green and blue). As it does not exceed 2%, the atmospheric corrections have to be extremely accurate, especially in coastal environments, because of the water turbidity (higher chlorophyll-a concentrations and presence of SPM, which make doubtful the black pixel assumption), and the complex atmosphere (higher concentrations of aerosols, with continental and/or marine origine, strong local specificities, and important spatio-temporal variabilities).
The thematic of atmospheric corrections in coastal environements emerged in the 90’s. Netherveless, it is still viewed as an important part of scientific researches in remote sensing. Achieving such exercise for high-resolution imagery is a supplementary challenge. The FORMOSAT-2 atmospheric scheme that has been developed by CNES requires to be validated, notably by use of atmospheric in-situ measurements. This exercise is actually being done by the set-up of a CIMEL instrument in the Arcachon Bay [9]. Once the validation of the FORMOSAT-2 atmospheric corrections will be achieved, FORMOSAT-2 ocean color products will be inverted and possibly validated by use of jet-ski measurements (see §5).
3.2 Jet-ski reflectance spectra measurements
The 2000 radiance Lu and irradiance Ed measurements were pre-processed in order to remove measurements acquired
while the radiance sensor was out of water (departure and arrival of the jet-ski). The irradiance measurements contaminated by shadows effects (the second jet-ski occupant was getting up to collect water samples) were also removed, together with simultaneous radiance measurements. From the remaining 1350 radiance and irradiance spectra (350-900nm), only the 560 spectra collected with a low inclination angle (<20°) were selected to compute the reflectance spectra ρm as the ratio between the measured in-water upwelling radiance at depth z, Lu’(z), and the measured atmospheric
downwelling irradiance, Ed+, (ρm= Lu’(z)/Ed+). Note that the remote sensing reflectances (ρrs=Lw/Ed+) can be computed
according to expressions (3), (4) and (5) :
) z ( ' u i ) z ( u
F
.
L
L
=
(3))
z
K
(
exp
L
L
u(0−)=
u(z) u (4) ) 0 ( u w0
.
544
L
L
=
− (5)The in-water upwelling radiances Lu’(z) were corrected by applying the immersion factors Fi found in the literature for the
TriOS Ramses sensors [10] (Eq. (3)) and related to the water surface Lu(0-) using the relationship (4) [11]. The immersion
depth of the radiance sensor z is known as it is automatically recorded during the survey. The vertically averaged diffuse attenuation coefficient for upwelling radiance Ku was set at 0.2 m-1 [12], previously measured in the inlets of the
Arcachon lagoon, in an environment very similar to the oceanic beaches (sandy seabed, same range of SPM concentrations).
In the following, we analyse the quality of the reflectance spectra ρm from the jet-ski measurements. This step is essential
to advance in the remote sensing calval activities in coastal environment.
4.
RESULTS
The analysis is split into three parts: (i) are the spectra typical of the presence of mineral particles with light absorption at short wavelengths?; (ii) are their shape and magnitude dependent on the depth and water type (turbidity)?; (iii) are they similar to other reflectance spectra previously measured in the region?
In order to remove any noise we averaged the reflectance spectra measurements for each minute (on average, there are 25 spectra per minute). As a result, we have 51 spectra to analyze.
4.1 Analysis of the reflectance spectra measurements
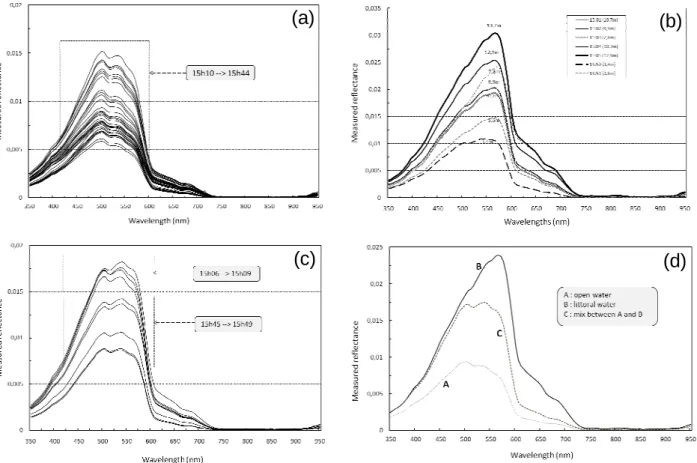
All the spectra presents a similar typical shape : low reflectance values at short wavelengths (350 nm), followed by an increase from 350 to 500 or 550 nm (depending on the spectra), for which the reflectance value is maximum. An important decrease is then observed until 605 nm, where a slope break is noticeable: reflectance values progressively decrease from 605 nm (low reflectance values) to 750 nm (no signal). At 950 nm, a slight increase of reflectance can be observed. The measured reflectance spectra appear to be typical of the presence of mineral particles with light absorption at short wavelengths [13], [14], [15]. Despite these common characteristics, slight differences between the reflectance spectra can be underlined. In order to define categories of spectra, we averaged reflectance spectra with similar shapes. The result shows 3 different categories (Fig. 4).
The first category of reflectance spectra (Fig. 4a) presents a peak at 500 nm and a peak at 530 nm. The former tends to be higher than the latter. There is also a weak signal at 560 nm. The maximum reflectance values vary from 0,006 to 0,015. This particular spectra shape is the most represented: overall 35 spectra that we averaged to obtain the Category-A shape (Fig. 4d). Category-A spectra correspond to jet-ski measurements acquired from 15h10 to 15h44. The cross-shore distance from the beach varies from 50m (at the beginning and at the end of the jet-ski trajectory) to 2km (at 15h20). The water depth varies from 10m (close to the beach) to 25m (2km cross-shore from the beach). Category A, for which the maximum reflectance value is lower than 0,01, is representative of “open water” (geographical denomination).
(a)
(b)
(c)
(d)
Figure 4: Measured reflectance spectra from the jet-ski on the 5th of April 2008. Three different categories of spectra are shown : (a)
from 15h10 to 15h44, “open water” (b) at the very beginning (15h01-15h05) and the very end (15h50-15h51) of the jet-ski trajectory, “littoral water”; (c) at the beginning (15h06-15h09) and the end (15h45-15h49) of the jet-ski trajectory, “mixed water”. (d) presents
the averages of the reflectance spectra: A for open water; B for littoral water and C for mixed water.
The second category of reflectance spectra (Fig. 4b) presents a single peak at 565 nm. The maximum reflectance varies from 0,01 to 0,03. These values are higher than the ones for Category-A spectra. Only seven spectra present this particular shape. The average of these spectra gives the Category-B spectra (Fig. 4d). Category-B spectra correspond to jet-ski measurements acquired at the very beginning (between 15h01 and 15h05) and the very end (15h50 and 15h51) of
the jet-ski trajectory. In both cases, this means that the jet-ski was close to the beach (tens of meters). The water depths were more important at the beginning (7-13 m) than at the end (3-5 m) because the jet-ski was not exactly at the same latitude (Fig. 2) and the water depth dependent on the tide level. Category-B spectra are measured in shallow waters that should be turbid, as the spectra shape is typical of the presence of mineral particles which absorbs in the short wavelengths. Category B, for which the maximum reflectance value is a bit lower than 0,025, is representative of “littoral water”.
The third category of reflectance spectra (Fig. 4c) presents a peak at 500 nm and a peak at 540 nm. The former peak is clearly lower than the latter one. There is also, like for Category-A spectra, a weak signal at 560 nm. The maximum reflectance values range between 0,009 and 0,018. These values are intermediary between than the ones observed for Category-A and Category-B spectra. Only nine spectra with this particular shape are averaged to give the Category-C spectra (Fig. 4d). Category-C spectra correspond to jet-ski measurements acquired at the beginning (between 15h06 and 15h09) and the end (between 15h45 and 15h49) of the jet-ski trajectory. In both cases, the jet-ski was close to the beach (tens of meters) and the water depths was between 5 and 13 m. Category-C spectra seems to be an intermediary spectra between Category-A and Category-B, a mix between “open” and “littoral” waters. Category C, for which the maximum reflectance value is a bit lower than 0,018, is representative of “mixed water”.
These results show that the reflectance spectra shapes can vary quickly along a 2-km cross-shore line. The water depths and the concentrations of particles may change quickly despite distances are short because of the nearby beach.
4.2 Relationship with ocean constituents concentrations
The water samples collected during the jet-ski trajectory (Fig. 2) were used to assess the concentrations in Suspended Particulate Matter ([SPM]) and Chlorophyll-a ([Chl-a]). Samples 21, 30 and 40 are characterized by low particulate load (both SPM and Chl-a). Sample 47, collected in brownish shallow waters (around 3 m) close to the beach (very end of the jet-ski trajectory), gives [SPM]=3.93 mg/l and [Chl-a]=0.68 µg/l. This confirmed spatial gradient in SPM and Chl-a concentrations is explained by strong rip currents that drive sediments offshore, from the runnel of the inner sandbar to outside the surf zone. Turbid water plumes are a common feature along the coastline extending rhythmically over tens to hundreds of meters alongshore and across the surf zone.
Site number UT [SPM] (mg/l) [Chl-a] (µg/l) Distance from the beach (m) Depth (m) 21 15h21 0.78 0.17 2000 25 30 15h30 0.96 0.29 1500 15-20 40 15h40 0.78 0.17 600 9 47 15h47 3.93 0.68 10-20 3
Table 2. Concentrations in Suspended Particulate Matter ([SPM] in mg/l) and Chlorophyll-a ([Chl-a] in µg/l) resulting from the Whatman GF/F filters analysis. Each water sample is numbered based on the time of sampling. The distance from the beach and the
water depth are also indicated.
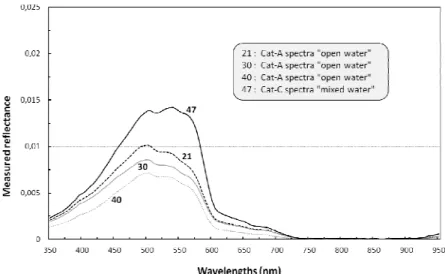
The samples 21, 30 and 40 are representative of Category-A spectra (“open water”) whereas the sample 47 is representative of Category-C spectra (“mixed water”) (Fig. 5). Without a priori knowledge of the reflectance spectra shape, no water sampling was done in the “littoral water”, supposedly the most turbid area.
The analysis of the reflectance spectra associated with water samples confirms that the “mixed water” (spectra 47) is more turbid than the “open water” (spectra 21, 30 and 40) : the shape of the spectra 47 changes (the 540-peak is more pronounced than the 500-peak) because of the higher SPM and Chl-a concentrations; the maximum reflectance value is higher (0,014) because of the occurrence of SPM, which reflects the light. The “mixed water” belongs to moderately turbid water types [16].
The “open water” belongs to low turbid water types [16]. The spectra 21 and 40, with similar concentrations but different water depths, experience slight discrepancies (Fig. 5). The water depth being higher for spectra 21 (Tab. 2), we should obtain a weaker signal than for spectra 40. It is the same for the spectra 21 and 30, with similar water depths but different concentrations, which also experience slight discrepancies (Fig. 5). The concentrations being higher for spectra 30 (Tab. 2), we should obtain a higher signal than for spectra 21. These paradoxes can be attributed to the relative uncertainty in
the concentrations assessments than can reach 25%. The discrepancies between spectra being slight, they are within the error bars of the method.
Figure 5: Reflectance spectra associated with water samples. Samples 21, 30 and 40 correspond to Category-A spectra whereas sample 47 corresponds to Category-C spectra.
The water depths and concentrations play a role on the reflectance spectra [12]. It is difficult to highlight these effects based on the available “open water” spectra, which experience too slight discrepancies.
4.3 Comparison with exogenous reflectance spectra
The reflectance spectra measurements at the ECORS-Truc Vert site are now compared with other measured reflectance spectra in the region. We consider the reflectance measurements from a ship during the OPTIC-PCAF campaign in 2004. The reflectance spectra in the Gironde mouth, highly turbid environment [17], have similar shapes than the jet-ski spectra measured at the ECORS-Truc Vert site. On Figure 6, we can clearly distinguish moderately turbid waters with reflectance spectra indicating a single peak at 560 nm (similar to Category-B spectra), and low turbid waters with a two-peak reflectance spectra (one at 500 nm, the other at 535), plus a signal at 560 nm (similar to Category-A spectra). We also note a signal at 950 nm.
Figure 6. Remote sensing reflectance spectra measurements from a ship in the Gironde mouth during the OPTIC-PCAF mission in 2004. The black (grey) curves represents a moderately (low) turbid water types.
The reflectance spectra measured from the jet-ski seem to be coherent with other reflectance spectra measurements acquired in stable conditions (ship) in similar environments (variable turbidity). Thus, this comparison is very encouraging.
5.
DISCUSSION/CONCLUSIONS
An original data set was acquired on the 5th of April 2008 during the international field experiment ECORS-Truc Vert 2008 (SW France) in the nearshore zone over a complex bathymetry and in moderate turbid waters (SPM <10 mg/l). This data set synchronizes in-situ reflectance measurements onboard a jet-ski, bathymetric surveys and a FOMOSAT-2 high-resolution satellite acquisition.
The jet-ski and can represent an innovative experimental approach for calval exercise of ocean color satellite imagery. In this paper, we propose a methodology to validate FORMOSAT-2 high-resolution ocean color data set using jet-ski reflectance measurements, which first require the evaluation of the quality of the jet-ski measurements.
The reflectance spectra measurements from the jet-ski have proved to be consistent : (i) the spectra are typical of the presence of mineral particles with light absorption at short wavelengths ; (ii) their shape and magnitude depend on the depth and the water type (turbidity) ; (iii) some of them, especially in low to moderately turbid waters, are similar to other reflectance spectra measured northward from a ship (Gironde mouth) in 2004.
Thus, preliminary results are very encouraging, and we plan to improve the jet-ski experiment by the development of the experimental device and a supplementary level of validation.
First of all, optical measurements require the most stable ocean and atmosphere conditions, which were a priori fulfilled on the 5th of April 2008: the sea-state was optimum and the sky perfectly clear. Nevertheless, we propose to test the experimental device (spectroradiometers onboard a jet-ski) on a flat surface as a lake. There are several lakes in the Aquitanian region, and it would be easily feasible using the jet-ski of our team.
The radiance sensor has to point at the bottom without any angle deviation : it would be worth using a better fixing for the sensor (no shift while the jet-ski moves forward). Moreover, in order to accurately evaluate the water depth, it would be worth using a pressure sensor. The irradiance sensor, which has to point vertically at the sky, has to be put in place a little bit higher than it was in order to avoid the shadows effects in case of water sampling. The water samples, if any, would have to be analysed immediately, and carefully, in order to minimize the assessment bias.
The downwelling atmospheric irradiance measurements are also planned to be validated using radiative transfer theory based on the successive order of scattering [18]. For a complete validation, the measured reflectance spectra are planned to be used as a first guess for the ocean color in order to simulate TOA reflectance (based on the radiative transfer theory), to be compared with FORMOSAT-2 L1A product.
As a conclusion, the reflectance spectra measurements onboard a jet-ski seems to be an interesting and consistent mean to collect optical data in coastal shallow case-2 waters and in environments hard to sample with traditional coastal ships, even though the experimental device and the methods need to be further developed and validated. These kinds of in-situ measurements may be interestingly adequate for the calval exercise of the high-resolution satellite imagery in coastal environments.
ACKNOWLEDGMENTS
The jet-ski experiment was funded by the ECORS project (SHOM-DGA). The authors would like to thank the topography team who worked in the frame of ECORS, especially Jean-Paul Parisot and Sylvain Capo, for providing us with the bathymetry data set, and Stéphane Bujan for carrying out the jet-ski trajectory. The authors are also grateful to the French Spatial Center (CNES) at Toulouse for providing us with the FORMOSAT-2 scenes through the KALIDEOS-Littoral database.
REFERENCES
[1] Sénechal, N., Ardhuin, F., Abadie, S., Almar, R., Arnaud, G., Austin, M., Barnoud, J.M., Barthélémy, E., Berni, C.,
et al., “ECORS Truc Vert : qualification des modèles de houle et de morphodynamique”, Proc. Of « Xème Journées Nationales de Génie Côtier – Génie Civil », Sophia Antipolis, 13-17 October 2008, in press (2008).
[2] Dehouck, A., Martiny, N., Froidefond, J.M., Sénéchal, N., Lafon, V., and Bujan, S., “In-water reflectance spectra measured onboard a jet-ski across a complex nearshore zone of case-2 waters during the ECORS experiment”, Proc. Of Ocean Optics XIX, Toscany, Italy, 6-10 October 2008, in press (2008).
[3] Martiny, N., Santer, R., Smolskaia, I., “Vicarious calibration of MERIS over dark waters in the near infrared”, Remote Sens. of Env. 94(4), 475-490 (2005a).
[4] Martiny, N., Frouin, R., Santer, R., “Radiometric calibration of SeaWiFS in the near infrared”, App. Optics 44(36), 7828-7844 (2005b).
[5] Tanré, D., Deroo, C., Duhaut, P., Herman, M., Morcrette, J., Perbos, J., and Deschamps, P.Y., “Description of a computer code to simulate the satellite signal in the solar spectrum: 5S code”, Int. J. Remote Sens. 11, 659-668 (1990). [6] Pinkerton, M. H., and Aiken, J., “Calibration and validation of remotely-sensed observations of ocean color from a moored data buoy”, Journal of Atmospheric and Oceanic Technology 16, 915-923 (1999).
[7] Doerffer, R., and Fisher, J., “Concentration of chlorophyll, suspended matter, and gelbstoff in case II waters derived from satellite coastal zone color scanner data with inverse modelling methods”, J. Geophys. Res. 99(C4), 7457-7466 (1994).
[8] Siegel, D. A., Wang, M., Maritorena, S., and Robinson, W., “Atmospheric correction of satellite ocean color imagery : the black pixel assumption”, Appl. Opt. 39(21), 3582-3591 (2000).
[9] Martiny, N., “Implantation d’un photomètre CIMEL sur le bassin d’Arcachon pour la validation des corrections atmosphériques des capteurs « couleur de l’eau », Project funded by University of Bordeaux, 1-12 (2008).
[10] Ohde, T. and Siegel, H., “Derivation of immersion factors for the hyperspectral TriOS radiance sensor”, Journal of optics A: pure and applied optics, 5, L12-L14 (2003).
[11] Fargion, G.S., and Mueller, J.L., “Ocean optics protocols for satellite ocean colour sensor validation”, Revision 2. NASA Tech. Memo. 209966. SeaWIFS Tech. Rep. Ser., NASA Goddard Space Flight Center (2000).
[12] Lafon, V., Froidefond, J.M., Lahet, F. and Castaing, P., “SPOT shallow water bathymetry of a moderately turbid tidal inlet based on field measurements”, Remote sensing of Environment 81, 136-148 (2002).
[13] Gordon, H. R., and McCluney, W. R., “Estimation of the sunlight penetration in the sea for remote sensing”, Applied Optics 14, 413–416 (1975).
[14] Morel, A., “Optics of marine particles and marine optics”, Optical Aspects of Oceanography, NATO ASI Series, G27, 141– 188 (1991).
[15] Froidefond, J.M., Doxaran, D, “Télédétection optique appliquée à l'étude des eaux côtières », Télédétection 4, 579-596, (2003).
[16] Morel, A., and Prieur, L., “Analysis of variations in ocean color”, Limnology and Oceanography 22, 709– 722 (1977).
[17] Doxaran, D., Froidefond, J.M., Lavender, S., and Castaing, P., “Spectral signature of highly turbid waters. Application with SPOT data to quantify suspended particulate matter concentrations”, Remote Sensing of Environment 81, 149-161 (2004).
[18] Deuzé, J.L., Herman, M., and Santer, R., “Fourier series expansion of the transfer equation in the atmosphere-ocean system.” Journal of Quantitative Spectroscopy and Radiatitive Transfer 41(6), 483-494 (1989).


![Table 2. Concentrations in Suspended Particulate Matter ([SPM] in mg/l) and Chlorophyll-a ([Chl-a] in µg/l) resulting from the Whatman GF/F filters analysis](https://thumb-eu.123doks.com/thumbv2/123doknet/14768759.589854/8.892.101.791.600.709/concentrations-suspended-particulate-matter-chlorophyll-resulting-whatman-analysis.webp)