HAL Id: insu-01624023
https://hal-insu.archives-ouvertes.fr/insu-01624023
Submitted on 12 Nov 2020
HAL is a multi-disciplinary open access
archive for the deposit and dissemination of
sci-entific research documents, whether they are
pub-lished or not. The documents may come from
teaching and research institutions in France or
abroad, or from public or private research centers.
L’archive ouverte pluridisciplinaire HAL, est
destinée au dépôt et à la diffusion de documents
scientifiques de niveau recherche, publiés ou non,
émanant des établissements d’enseignement et de
recherche français ou étrangers, des laboratoires
publics ou privés.
Data Package (release 2017) - Part 1: Ground-based
validation of total ozone column data products
Katerina Garane, Christophe Lerot, Melanie Coldewey-Egbers, Tijl Verhoelst,
Maria Elissavet Koukouli, Irène Zyrichidou, Dimitris S. Balis, Thomas
Danckaert, Florence Goutail, José Granville, et al.
To cite this version:
Katerina Garane, Christophe Lerot, Melanie Coldewey-Egbers, Tijl Verhoelst, Maria Elissavet
Koukouli, et al.. Quality assessment of the Ozone_cci Climate Research Data Package (release 2017)
-Part 1: Ground-based validation of total ozone column data products. Atmospheric Measurement
Techniques, European Geosciences Union, 2018, 11, pp.1385-1402. �10.5194/amt-11-1385-2018�.
�insu-01624023�
https://doi.org/10.5194/amt-11-1385-2018 © Author(s) 2018. This work is distributed under the Creative Commons Attribution 4.0 License.
Quality assessment of the Ozone_cci Climate Research Data
Package (release 2017) – Part 1: Ground-based validation of total
ozone column data products
Katerina Garane1, Christophe Lerot2, Melanie Coldewey-Egbers3, Tijl Verhoelst2, Maria Elissavet Koukouli1, Irene Zyrichidou1, Dimitris S. Balis1, Thomas Danckaert2, Florence Goutail4, Jose Granville2, Daan Hubert2, Arno Keppens2, Jean-Christopher Lambert2, Diego Loyola3, Jean-Pierre Pommereau4, Michel Van Roozendael2, and Claus Zehner5
1Laboratory of Atmospheric Physics, Aristotle University of Thessaloniki, Thessaloniki 54124, Greece 2Royal Belgian Institute for Space Aeronomy (BIRA-IASB), 3, Avenue Circulaire, 1180 Brussels, Belgium 3Deutsches Zentrum für Luft- und Raumfahrt (DLR), Institut für Methodik der Fernerkundung (IMF),
82234 Oberpfaffenhofen, Germany
4LATMOS, CNRS, University Versailles Saint-Quentin-en-Yvelines, Guyancourt, France 5European Space Agency, ESRIN, Frascati, Italy
Correspondence: Katerina Garane ([email protected])
Received: 23 October 2017 – Discussion started: 25 October 2017
Revised: 22 January 2018 – Accepted: 23 January 2018 – Published: 9 March 2018
Abstract. The GOME-type Total Ozone Essential Climate Variable (GTO-ECV) is a level-3 data record, which com-bines individual sensor products into one single cohesive record covering the 22-year period from 1995 to 2016, gen-erated in the frame of the European Space Agency’s Cli-mate Change Initiative Phase II. It is based on level-2 to-tal ozone data produced by the GODFIT (GOME-type Di-rect FITting) v4 algorithm as applied to the GOME/ERS-2, OMI/Aura, SCIAMACHY/Envisat and GOME-2/Metop-A and Metop-B observations. In this paper we examine whether GTO-ECV meets the specific requirements set by the interna-tional climate–chemistry modelling community for decadal stability long-term and short-term accuracy. In the follow-ing, we present the validation of the 2017 release of the Cli-mate Research Data Package Total Ozone Column (CRDP TOC) at both level 2 and level 3. The inter-sensor consis-tency of the individual level-2 data sets has mean differ-ences generally within 0.5 % at moderate latitudes (±50◦), whereas the level-3 data sets show mean differences with re-spect to the OMI reference data record that span between −0.2 ± 0.9 % (for GOME-2B) and 1.0 ± 1.4 % (for SCIA-MACHY). Very similar findings are reported for the level-2 validation against independent ground-based TOC observa-tions reported by Brewer, Dobson and SAOZ instruments:
the mean bias between GODFIT v4 satellite TOC and the ground instrument is well within 1.0 ± 1.0 % for all sensors, the drift per decade spans between −0.5 % and 1.0 ± 1.0 % depending on the sensor, and the peak-to-peak seasonality of the differences ranges from ∼ 1 % for GOME and OMI to ∼2 % for SCIAMACHY. For the level-3 validation, our first goal was to show that the level-3 CRDP produces findings consistent with the level-2 individual sensor comparisons. We show a very good agreement with 0.5 to 2 % peak-to-peak amplitude for the monthly mean difference time se-ries and a negligible drift per decade of the differences in the Northern Hemisphere of −0.11 ± 0.10 % decade−1 for Dobson and +0.22 ± 0.08 % decade−1 for Brewer colloca-tions. The exceptional quality of the level-3 GTO-ECV v3 TOC record temporal stability satisfies well the requirements for the total ozone measurement decadal stability of 1–3 % and the short-term and long-term accuracy requirements of 2 and 3 %, respectively, showing a remarkable inter-sensor consistency, both in the 2 GODFIT v4 and in the level-3 GTO-ECV vlevel-3 datasets, and thus can be used for longer-term analysis of the ozone layer, such as decadal trend stud-ies, chemistry–climate model evaluation and data assimila-tion applicaassimila-tions.
1 Introduction
The European Space Agency’s Climate Change Initiative (ESA-CCI) phases I and II focused on building consolidated climate-relevant ozone data sets as essential climate variables (ECVs). During Phase I, the Ozone_cci mostly concentrated on developing and demonstrating improved algorithms and methods, with the aim to define new baselines for the gen-eration of consistent, state-of-the-art and fully characterized long-term ozone data products derived from a complete suite of European nadir and limb-type sensors. For the first time, Earth observation science teams consisting of leading experts from European ozone sensing communities were gathered in a single project working towards common objectives defined against requirements formulated by the scientific user com-munity. This resulted in new synergies, exchanges of ideas and overall significant progress in terms of data harmoniza-tion and understanding of quality issues at level 1, level 2 and level 3. Three lines of multi-sensor ozone data products were hence developed: (i) total ozone columns (TOCs) from ultraviolet (UV) nadir instruments, (ii) low-resolution ozone profiles from nadir sensors and (iii) stratospheric and upper-tropospheric ozone profiles from limb and occultation types of sensors. During Phase II, existing state-of-the-art ozone retrieval algorithms were further developed and applied to long time series of observations from all relevant ESA at-mospheric chemistry sensors, with the aim to generate well-characterized and validated ozone data products that meet as closely as possible the requirements formulated by the Global Climate Observing System (GCOS) and the Climate Modelling User Group (CMUG) climate modelling commu-nity for ozone column and profile ECVs. The most important user requirements were identified as (i) homogenized multi-decadal records, (ii) records with good vertical resolution in the (lower) stratosphere and (iii) records with good horizon-tal resolution in the troposphere, the main gap being the lack of multi-decadal high-vertical resolution ozone profile data sets that cover the full ozone depletion time period (1980– present) and provide a potential to cover the upcoming ozone recovery time period.
This work addresses the first of these requirements, the level-2 and level-3 homogenized multi-decadal total ozone Climate Research Data Package (CRDP), with upcoming companion papers expanding on the limb (TBA) and nadir (Keppens et al., 2018) ozone profile CRDPs. With respect to total ozone, 22 years of harmonized level-2 data records from GOME/ERS-2 (Global Ozone Monitoring Experiment instrument on board the second European Remote Sensing satellite), OMI/Aura (Ozone Monitoring Instrument on board Aura satellite), SCIAMACHY/Envisat (Scanning Imaging Absorption Spectrometer for Atmospheric Cartography on board Envisat) and GOME-2/Metop-A and Metop-B (Global Ozone Monitoring Experiment-2 on board Metop-A and Metop-B satellites) sensors have been produced using an ad-vanced version of the direct-fitting GODFIT (GOME-type
Direct FITting) v4 algorithm. The ESA-CCI total ozone CRDP includes the level-2 products for each instrument (over the entire instrument lifetime) and a level-3 merged monthly mean gridded data set using GOME and OMI as long-term stability reference.
In the following section, we briefly present the GODFIT v4 algorithm that creates the level-2 CRDPs, followed by the validation against the Brewer, Dobson and SAOZ (Sys-tème d’Analyse par Observation Zénitale; Pommereau and Goutail, 1988) ground-based instruments and the compari-son to the independent solar backscatter ultraviolet measure-ments (SBUV) v8.6 long-term TOC record. Thereafter, the algorithm that merges the individual level-2 TOC records to create the level-3 dataset is presented, followed by the val-idation to the ground-based records and intercomparison to the individual level-2 validation findings. Summary and con-clusions are given in the last section.
2 Level-2 total ozone columns
2.1 Satellite total ozone column records
GODFIT is an algorithm jointly developed by BIRA-IASB (Royal Belgian Institute for Space Aeronomy), RT Solu-tions and DLR (German Aerospace Center) to retrieve TOC from satellite-borne nadir-viewing hyperspectral spectrome-ters, such as GOME(-2), SCIAMACHY and OMI. It relies on a non-linear least-squares minimization procedure, dur-ing which sun-normalized radiances simulated in the Hug-gins bands (325–335 nm) with the radiative transfer model LIDORT (Linearized Discrete Ordinate Radiative Transfer; Spurr et al., 2013) are adjusted to the level-1 measurements. As part of Phase I of the ESA Ozone_cci project, version 3 of GODFIT has been successfully transferred to other nadir sen-sors and is comprehensively described in Lerot et al. (2014) and validated in Koukouli et al. (2015). During the second phase of this project, a number of algorithmic improvements have been realized and the full time series of GOME, OMI, SCIAMACHY and GOME-2A/B have been entirely repro-cessed with the latest version (version 4) of GODFIT. The most important update is the adaptation of the level-1 soft-calibration scheme in order to restore the full independency of the satellite observations with respect to the ground-based measurements. This algorithm, described in detail in Rah-poe et al. (2017), is also the future baseline for generating the offline operational total ozone from the TROPOMI/S5-P (TROPOspheric Monitoring Instrument on board the Coper-nicus Sentinel-5 Precursor satellite) instrument that launched in October 2017.
The radiance simulations require that the atmosphere is properly defined at each iteration within the retrieval and so a series of auxiliary data is also required. Ozone verti-cal profiles are prescribed by the total ozone classified cli-matology recently released by Labow et al. (2015) using MLS (Microwave Limb Sounder) and sondes data, com-bined with the tropospheric column database constructed by Ziemke et al. (2011). The ozone absorption is modelled us-ing the temperature-dependent cross sections measured by Serdyuchenko et al. (2014). The temperature in each atmo-spheric layer is prescribed by a priori profiles, allowed to be shifted by a constant offset, determined simultaneously with the total column. All cross sections are pre-convolved at the respective instrumental resolution and an improved correc-tion for the so-called solar I0effect (Aliwell et al., 2002) has
been applied (Rahpoe et al., 2017). GODFIT has the capabil-ity to characterize instrumental slit function on an orbit basis by fitting pre-determined functions such as (super-)Gaussian shapes (Beirle et al., 2017) or by stretching slit functions pre-measured on the ground. To account for contamination by clouds and/or aerosols, an effective scene approach is used (Coldewey-Egbers et al., 2005) in which the effective albedo of a scene located in between the cloud top height and the ground surface is fitted during the retrieval. The altitude of this effective scene depends on both the effective cloud frac-tion and the cloud top altitude provided by independent cloud algorithms (FRESCO v7 by Wang et al., 2008, or the O2–
O2 product by Veefkind et al., 2016). Radiances are
simu-lated on the fly with the scalar radiative transfer model LI-DORT for GOME, SCIAMACHY and GOME-2. Because of the heavy computational burden of those simulations, the ra-diances may alternatively be extracted from a pre-computed look-up table, of which the granularity has been cautiously defined in order to limit interpolation errors while keeping a reasonable size (Rahpoe et al., 2017). Once simulated, cor-rection terms are applied to the radiances to correct for the impact of atmospheric polarization and inelastic scattering processes (Lerot et al., 2014).
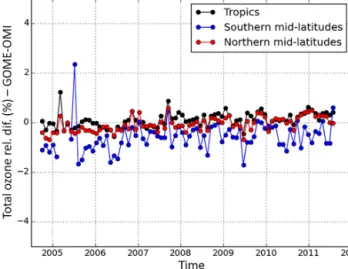
When a common retrieval algorithm is applied to var-ious instruments, systematic differences may remain due to calibration deficiencies or instrumental degradation ef-fects affecting the level-1 reflectance data. To generate the CCI total ozone data sets with the high inter-sensor consis-tency required for climate studies, an original soft-calibration scheme had been incorporated within GODFIT v3. This pro-cedure, extensively described in Lerot et al. (2014), relied on reference total column measurements at selected north-ern mid-latitude Brewer stations. Although it was shown to work well, this approach had the disadvantage of introducing a link between the satellite and ground-based measurements. As illustrated in Fig. 1, experience has shown that the GOME and OMI sensors perform in an extremely stable way and do not require any spectral soft-calibration procedure. Therefore it was decided to use these two instruments to soft-calibrate the spectra measured by SCIAMACHY and GOME-2A/B.
Figure 1. Time series of the relative differences between the total ozone columns retrieved from the GOME and OMI sensors for dif-ferent latitude bands. Retrievals have been performed without any soft calibration of the reflectances for both instruments.
Figure 2. Time series of the relative differences between the total ozone columns retrieved from GOME, SCIAMACHY and GOME-2A/B with respect to OMI.
In practice, for every cloud-free satellite pixel falling into a reference sector between 40◦S–50◦N and 175–145◦W, the closest reference clear-sky OMI (or GOME before 2005) col-umn is used to simulate a radiance (using the GODFIT for-ward model), which is then compared to the level-1 spectrum recorded by the sensor to be soft-calibrated. Such compar-isons are done systematically for a large number of pixels (e.g. several hundreds of thousands for GOME-2A) spanning most of the observation geometries and the full time series, which allows the identification and correction of systematic issues in the level-1 data. See Lerot et al. (2014) for more details on the soft-calibration approach.
Using this new GODFIT v4 baseline, the time series of GOME, SCIAMACHY, GOME-2A/B and OMI have been entirely reprocessed. Figure 2 illustrates the excellent consis-tency between the individual level-2 data sets with mean dif-ferences generally within 0.5 % at moderate latitudes (±50◦). The level-2 data sets are publicly available on the Ozone_cci website (http://www.esa-ozone-cci.org) and the time series are also regularly extended as part of the Copernicus Climate Change Service (C3S).
2.2 Ground-based total ozone column records
For the purposes of this work, both direct-sun measure-ments (from Dobson and Brewer UV spectrophotometers) and zenith-sky scattered-light (ZSL-DOAS) measurements were used as ground-based reference data.
Total ozone column measurements from Dobson and Brewer UV spectrophotometers were downloaded from the WOUDC (World Ozone Ultraviolet Radiation Data Center) archive (http://www.woudc.org); see Tables S2 and S3 in the Supplement for a complete list. The measurement techniques and the data analysis methodology are extensively analysed in Koukouli et al. (2015) and in references therein. It is im-portant to point out that according to Van Roozendael et al. (1998), the estimated total uncertainty for the Dobson spectrophotometer is about 1 % for cloud-free direct-sun ob-servations and 2–3 % for zenith-sky or cloudy obob-servations, while the error of individual total ozone measurements for a well-maintained Brewer instrument is about 1 % (e.g. Kerr et al., 1988).
The main issues that have to be taken into account during the validation process with these direct-sun instruments are as follows: (a) TOC measurements from Dobson spectrome-ters depend on the stratospheric effective temperature, which is manifested in the comparisons as a seasonality effect (Kerr et al., 1988; Kerr, 2002; Bernhard et al., 2005; Scarnato et al., 2009; Koukouli et al., 2016). (b) Even though the prin-ciples of operation between Dobson and Brewer spectrome-ters do not differ significantly, TOC measurements from the two types of instruments show small differences in the range of ±0.6 % due to the use of different wavelengths and the different temperature dependence for the ozone absorption coefficients (Staehelin et al., 2003). (c) Due to the limited number and poor spatial distribution of stations with Brewer instruments in the Southern Hemisphere (SH) (all of them allocated in the Antarctic), the Dobson network is consid-ered much more suitable to investigate spatial homogeneity of satellite products below the Equator.
TOC ground-based measurements from the abovemen-tioned instruments have been extensively used in past publi-cations for the purpose of analysis and validation of satellite data (see e.g. Balis et al., 2007a, b; Antón et al., 2009; Loyola et al., 2011; Koukouli et al., 2012, 2015; Labow et al., 2013; Bak et al., 2015). The ground-based stations were selected in accordance with the criteria discussed in detail in Balis et
al. (2007a, b). Their measurements are thoroughly inspected once a year, in terms of quality assurance and stability, fol-lowing the principles described in Fioletov et al. (1999), Van-icek (2006) and Fioletov et al. (2008), among others.
The GODFIT v4 TOCs were also compared against twi-light zenith-sky measurements obtained with ZSL-DOAS (zenith scattered-light differential optical absorption spec-troscopy) instruments. Most of these instruments form part of the SAOZ network (Pommereau and Goutail, 1988) of the Network for the Detection of Atmospheric Composition Change (NDACC). In NDACC, four slightly different ZSL-DOAS instruments are also routinely reporting data (see Ta-ble S1 for complete list of instruments used). To avoid con-fusion in the paper, hereafter they will all be referred to as “SAOZ measurements”.
The total accuracy of SAOZ measurements is of the or-der of 6 % (Hendrick et al., 2011), including a 3 % system-atic uncertainty of the absorption cross sections. However, since all NDACC SAOZ/ZSL-DOAS instruments are using the same cross sections, there is no systematic error between them. The random error of SAOZ spectral analysis is less than 2 %, to which one should add the random error on the air mass factor, mainly impacted by clouds (up to 3.3 %). Thus, significantly better performance, of the order of 2 %, can be expected in differential analyses of cloud-free data.
These twilight zenith-sky measurements are complemen-tary to the Brewer and Dobson measurements for several rea-sons: (a) they use spectral features of the visible Chappuis band, where the ozone differential absorption cross sections are temperature insensitive; (b) the long horizontal strato-spheric optical path allows measurements of the column above cloudy scenes; and (c) measurements are always per-formed in the same small solar zenith angle (SZA) range (86– 91◦). For further details on the measurement procedures and on the specific collocation approach, taking into account the actual area of measurement sensitivity, we refer to Balis et al. (2007a), Koukouli et al. (2015) and references therein. After quality control and the application of thresholds on the minimum number of collocated measurements, data from about 20 instruments were used, covering both the Northern Hemisphere (NH) and SH up to high latitudes and leaving only the equatorial region poorly sampled (see Fig. S1 in the Supplement for the locations of all three types of instru-ments). In spite of the dedicated collocation method, some residual errors due to collocation mismatch may persist and must be kept in mind, in particular at high latitudes, as shown by Verhoelst et al. (2015).
2.3 Level-2 validation results and discussion
As a basis for the validation process of the satellite TOC measurements, pairs of collocated satellite and daily-mean ground-based measurements are formed and their percent-age difference is calculated. Specific criteria are applied to minimize the noise of the comparison:
i. For the Dobson and Brewer instruments, (a) the maxi-mum search radius between the ground-based stations and the centre coordinates of the satellite pixel is set to 150 km and the spatially closest satellite observa-tions are paired with the ground-based station’s daily-mean measurement and (b) only direct-sun ground-based measurements are used for the validation process, since they are deemed to be most accurate.
ii. For the SAOZ measurements, the large displacement (with respect to the instrument location) of the actual measurement sensitivity is taken into account by requir-ing satellite pixels to intersect with a 2-D (lat, long) polygon describing the true area of measurement sensi-tivity; see Balis et al. (2007a) and Verhoelst et al. (2015) for full details.
Following those criteria, three time series (one for each type of ground-based instrument) of the percentage differences are formed. Hereupon, a statistical analysis of the time series is performed, separately for each type of instrument, so as to study a variety of possible dependences on geospatial param-eters such as the season, latitude and observation geometry. The results of the analysis are shown in the following graphs and are summed up in Table 1. In the figures presented in this section, the dependency of the percentage difference be-tween satellite and ground-based TOC measurements on pa-rameters such as the ones mentioned above is displayed (the line colours used for Figs. 3–6 are black for GOME, blue for SCIAMACHY, cyan for OMI, green for GOME-2A and orange for GOME-2B). It should be noted that SH GOME measurements are only shown before 2003, when it encoun-tered downlink telemetry problems.
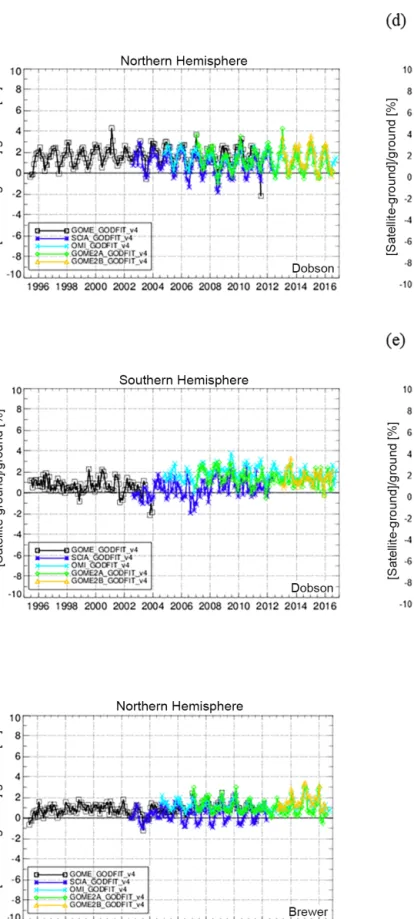
In Fig. 3 the time series of the percentage difference be-tween the TOC measurements from five different satellites to the collocated Dobson, Brewer and SAOZ ground-based measurements are shown. In all panels the entire available time series from each satellite instrument is displayed (ex-cept for GOME for the SH, as mentioned above) in the form of monthly mean difference (in %). The monthly means for each sensor were calculated using the percentage differ-ences of all the available collocations from all stations for each month, without any weighting. The comparison with the Dobson measurements is presented in panel (a), which cor-responds to the NH stations, and panel (b), which presents the SH percentage differences. It is shown that the NH time series are highly consistent and stable for all five satellites, with an amplitude of ∼ 2 % for all sensors apart from SCIA-MACHY, which shows a slightly increased variability, with certain months underestimating the ground-based mean (dif-ferences reaching −1 %). Part of the seasonality observed in Fig. 3a and b is due to the known Dobson dependency on the effective temperature of the stratosphere (Koukouli et al., 2016). The ∼ 1.5 % bias of the satellite TOCs compared to the Dobson TOCs is in agreement with the bias of ±2 % found by the Absorption Cross Sections of Ozone (ACSO)
committee (Orphal et al., 2016) and might be related to sys-tematic uncertainties in the different ozone absorption cross sections used to retrieve satellite and ground-based mea-surements. Dobson and Brewer TOC data records are based on Bass and Paur (1985) ozone absorption cross sections, whereas, as it is mentioned in the previous section, the re-spective satellite TOCs are produced using the cross section measured by Serdyuchenko et al. (2014).
The comparison for the SH Dobson measurements (Fig. 3b) shows higher variability due to the fact that the number of available stations in this part of the globe is lim-ited and their measurements are greatly affected by the vigor-ous phenomena developing over the Antarctic. However, all time series present a rather consistent and stable behaviour, similar to that shown in the NH, with a bias of the order of 1–1.5 % for OMI, GOME-2A and GOME-2B.
In Fig. 3c, the same plot of the percentage differences between the satellites and Brewer ground-based measure-ments performed at stations located in the NH is shown. Due to the extremely limited number of stations with Brewer spectrophotometers in the SH, positioned exclusively in the Antarctic, it was decided not to present the respective plot. The consistency and the stability of the satellite measure-ments is evident for the whole time period of available data and for the whole set of five sensors: the overall bias of the comparison is up to 1 % for GOME, 0 % for SCIAMACHY and 1.5 % for the rest of the instruments, with peak-to-peak amplitude of the order of 1–2.5 %.
Panels (d) and (e) of Fig. 3 depict the time series of the comparison to the SAOZ network for the NH and SH, re-spectively. The known seasonality effect, which is present in comparisons between SAOZ and direct-sun measurements (Hendrick et al., 2011), is obviously stronger in these figures than in the other three panels. Asides from the cross sec-tions’ stratospheric effective temperature dependence, affect-ing Dobson and lesser Brewer and satellite measurements, the SAOZ seasonality observed on panels (d) and (e) comes from the comparison performed up to high latitudes in win-ter; this is in contrast to the Dobson and Brewer instruments, which are “blind” at that latitude in winter. In addition, SAOZ comparisons at high latitudes are known to be affected by collocation mismatch (Verhoelst et al., 2015). Finally, the overall bias of the SAOZ comparison is fairly stable at 1.5 % in the NH but rather variable for the SH, which can be at-tributed to the large number of high-latitude stations con-tributing to the statistics.
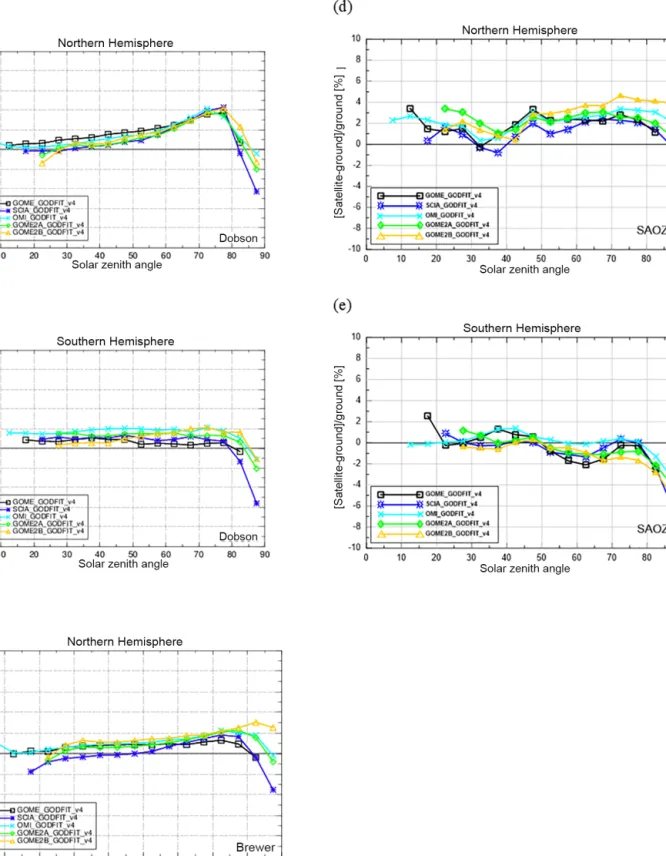
The dependence of the percentage differences of the five satellites measurements to the ground-based TOC measure-ments on SZA was investigated, as shown in Fig. 4, where panels (a) and (b) depict Dobson NH and SH comparisons, panel (c) shows the Brewer NH-only comparisons and pan-els (d) and (e) show the SAOZ NH and SH comparisons, re-spectively. It should be noted that the SZA values used for the grouping in the plots are the SZAs of the satellite and not the ground-based measurements, which are downloaded
Figure 3. The time series of the monthly mean percentage differences between the five satellite instruments and the co-located ground-based TOC measurements performed by Dobson (a Northern Hemisphere and b Southern Hemisphere), Brewer (c Northern Hemisphere) and SAOZ (d Northern Hemisphere and e Southern Hemisphere) instruments.
as daily means from the WOUDC database. First, as it is seen in Fig. 4, all curves in each plot have highly consis-tent dependencies on SZA, which proves that, irrespective of its magnitude, the dependence can be contributed mainly on the ground-based measurements of each kind. Specifi-cally, in panel (a) the NH comparison is shown, and there is a strong but very consistent dependence on SZA for all five satellite instruments, whereas in the SH (panel b) al-most no dependency is seen for SZAs < 80◦. The first rea-son for this dissimilar behaviour is the fact that in the NH most Dobson ground-based stations are located in the mid-dle latitudes, contrary to the SH stations that are much more homogeneously distributed. Additionally, since the measure-ments of the Dobson stations are affected by the varia-tion of the stratospheric effective temperature, the data pro-vided by NOAA/National Weather Service (http://www.cpc. ncep.noaa.gov/products/stratosphere/temperature/) were in-vestigated to see whether there is a difference in the strato-spheric temperature between the mid-latitudes of the two hemispheres. The results are very consistent with the two plots of the panels (a) and (b): the peak-to-peak amplitude of the stratospheric effective temperature annual variation above the mid-latitudes of the NH is about 3–4◦C greater compared in the variation above the respective latitudes of the SH, which resulted to the stronger variability of the NH Dobson measurements, seen in panel (a). Of course, further investigation on this issue is needed, but it is beyond the scope of this work.
Figure 4c shows that the percentage difference of the mea-surements is almost constant for the Brewer comparison and increases for SZAs larger than 70◦. SCIAMACHY, how-ever, shows a slightly stronger dependence on SZA starting from low angles. Comparisons performed at SZAs over 75◦
and below 25◦are affected by the limited number of obser-vations and the uncertainties of the ground-based measure-ments themselves. Hence, it is difficult to assess their signif-icance level.
In Fig. 4d–e, we show that the SZA dependence between satellite and SAOZ ground measurements was up to 4 % at the highest satellite-viewed SZAs (> 80◦) at all high-latitude stations, irrespective of season. There was also some mi-nor dependence at very small SZAs in the mi-northern tropics, but this is based on only a few tropical stations with lim-ited data, and it is not confirmed by the Brewer comparisons. There are also some systematic inter-hemispheric differences for SAOZ measurements, which is obvious when comparing panels (d) and (e) of Fig. 4, in particular due to comparisons at some northern high-latitude stations being biased high (up to 5 %), and those at southern high-latitude stations being bi-ased low (of the order of 2 %), as shown in Fig. 5c, which will be commented on below.
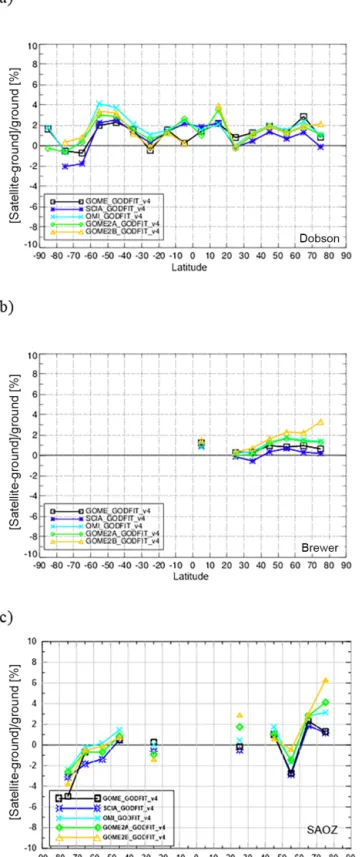
Additionally, the dependency of the satellite and ground-based measurements percentage difference on latitude is pre-sented. In Fig. 5a, the ground-based measurements are per-formed by Dobson spectrophotometers, in panel (b) Brewer
data are used, while in panel (c) the comparison with the SAOZ data record is shown. It is obvious in this exercise that all five satellite sensors appear to be very consistent, regard-less of the ground-based instrument type, which is the main concern of this work. It is also noticeable that, mainly for Brewer and Dobson ground-based measurements, the depen-dency on latitude is less eminent for the NH due to the much higher number of collocations found there. Specifically, the comparisons with Dobson measurements show differences between 0 and 2 % for latitudes between −40 and 0◦ as well as for the entire NH, similar to the Brewer comparisons. In the SH, especially southwards of −40◦, the comparisons show differences ranging between −2 and 4 %, depending on the satellite sensor, attributable partially to the small number of stations located in that part of the Earth and partially to the higher variability of the TOCs within the southern po-lar vortex (see also Verhoelst et al., 2015). In Fig. 5c, where the comparison with the SAOZ measurements is shown, a higher dependency on latitude is eminent even for the NH, where the other two ground-based instruments have com-pletely different performances. Nevertheless, the inter-sensor consistency is very satisfactory in this comparison, too, ex-cept for the high-altitude Izaña station located at 28◦N (near the NH tropics), for which the differences were adjusted to take into account the missing column in the ground-based measurement but some residual effect due to different satel-lite pixel sizes is probably still present. The correction for the station’s altitude is described in Verhoelst et al. (2015) and uses an ERA-Interim based estimate of the column below the instrument altitude in the immediate vicinity of the island and/or mountain, at the resolution of the reanalysis, and not taking into account the exact satellite pixel size and location. For the SAOZ/ZSL-DOAS network, Izaña and Jungfraujoch are the only stations for which a significant missing column was derived with this methodology (about 2.8 and 3.2 %, re-spectively, with some seasonal variation) due to their iso-lated mountain-top locations. Any pixel-size dependence at Jungfraujoch is less evident in Fig. 5c as that latitude bin con-tains three other stations not located on mountain tops. More-over, the measurements performed by the stations located in the 70–80◦N belt show larger differences between sensors, but these discrepancies are not confirmed by the Brewer or the Dobson networks and they are most probably related to the larger (and pixel-size-dependent) horizontal smoothing difference errors between SAOZ and the satellite measure-ments.
According to the guidelines given at the Ozone_cci project’s User Requirement Document (version 2.1) (Van Weele et al., 2016), Table 5, the stability of the total ozone column measurements must be among 1 and 3 % decade−1, the evolution of the ozone layer (radiative forcing) has to be less than 2 % and the seasonal cycle and inter-annual (short-term) variability should be less than 3 %. To investi-gate whether the five satellite data records are compliant to those requirements, a statistical analysis of the percentage
Figure 4. The dependence of the percentage differences between the satellite TOC measurements to the measurements of the Dobson (a for NH and b for SH), Brewer (c, NH only) and SAOZ (d for NH and e for SH) ground-based stations, on solar zenith angle.
Figure 5. The percentage difference between the five satellites TOC measurements and ground-based measurements from Dobson (a), Brewer (b) and SAOZ (c) instruments, as a function of latitude.
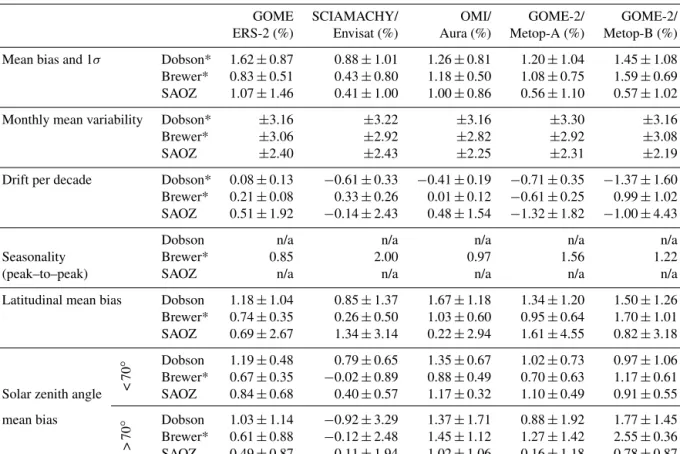
deviation between satellite and ground-based measurements was performed, with the statistics presented in Table 1. The first column enumerates the physical quantity studied, the second column differentiates between Brewer, Dobson and SAOZ collocations, the third column shows the results of the statistical analysis for GOME/ERS-2, the fourth column for SCIAMACHY/Envisat, the fifth for OMI/Aura, the sixth for GOME-2/Metop-A and the seventh for GOME-2/Metop-B sensor. The rows of Table 1 depict (1) the mean bias and stan-dard deviation (1σ ), computed from the monthly mean dif-ferences of the entire record for each sensor, shown in Fig. 3; (2) the monthly mean variability, i.e. the variability of the standard deviations of differences in individual months, cal-culated by the root mean square; (3) the drift per decade, i.e. the decadal drift and associated standard deviation; (4) the seasonality, i.e. the peak-to-peak amplitude of the seasonal variability; (5) the latitudinal mean bias, i.e. the mean bias and standard deviation as calculated by the latitudinal vari-ability plots (Fig. 5) on a global scale; and (6) the SZA mean bias, i.e. the mean bias and standard deviation as calculated from the SZA ranges shown in Fig. 4, on a global scale. The values of the table are all measured in percent and all the quantities for the Brewer measurements, as well as quantities (1), (2) and (3) for the Dobson measurements, are calculated for the NH only.
The percentages listed in Table 1 prove that the prod-ucts of the GODFIT v4 algorithm for all five sensors ful-fill the requirements set by the European Space Agency’s Ozone_cci project (Lambert et al., 2018), since the am-plitude of the short-term variability (seasonality) is less than 2 % and the maximum drift per decade is equal to −1.37 ± 1.60 % decade−1 for GOME-2/Metop-B, whose time series is only 3.5 years long and as a result its drift per decade cannot be considered statistically significant. For the rest of the sensors the maximum drift per decade is less than ±1 %. In conclusion, the statistics presented in Table 1 indi-cate that the data sets produced by the Ozone_cci GODFIT v4 algorithm for all five sensors under validation are reliable, homogeneous and consistent.
In order to further demonstrate the long-term inter-sensor consistency of the GODFIT v4 level-2 TOCs, comparisons to the SBUV data products are shown. Daily level-2 overpass files of total ozone column measurements produced by the SBUV v8.6 algorithm for the locations of the ground-based stations were downloaded from https://acd-ext.gsfc.nasa. gov/Data_services/merged/ and are described by McPeters et al. (2013) and Frith et al. (2014). The instruments and the re-spective time periods of measurements used for this compar-ison are NOAA 14 SBUV/2 (February 1995 to March 2006), NOAA 16 SBUV/2 (October 2000 to May 2014), NOAA 17 SBUV/2 (July 2002 to March 2013), NOAA 18 SBUV/2 (July 2005 to November 2012) and NOAA 19 SBUV/2 (April 2009 to February 2017). As reported by Labow et al. (2013), their measurements were also validated against
Figure 6. The time series of the percentage differences between satellite and ground-based monthly mean TOC measurements in the Northern Hemisphere, separated into two time periods: 1995–2012 (a) and 2005–2017 (b). (a) NOAA 14 SBUV/2 (black line), NOAA 16 SBUV/2 (blue line), NOAA 17 SBUV/2 (cyan line), GOME GODFIT v4 (green line) and SCIAMACHY GODFIT v4 (orange line). (b) NOAA 18 SBUV/2 (black line), NOAA 19 SBUV/2 (blue line), OMI GODFIT v4 (cyan line), GOME-2A GODFIT v4 (green line) and GOME-2B GODFIT v4 (orange line).
Table 1. Statistics of the comparison between satellite ground-based TOC measurements.
GOME SCIAMACHY/ OMI/ GOME-2/ GOME-2/ ERS-2 (%) Envisat (%) Aura (%) Metop-A (%) Metop-B (%) Mean bias and 1σ Dobson* 1.62 ± 0.87 0.88 ± 1.01 1.26 ± 0.81 1.20 ± 1.04 1.45 ± 1.08 Brewer* 0.83 ± 0.51 0.43 ± 0.80 1.18 ± 0.50 1.08 ± 0.75 1.59 ± 0.69 SAOZ 1.07 ± 1.46 0.41 ± 1.00 1.00 ± 0.86 0.56 ± 1.10 0.57 ± 1.02 Monthly mean variability Dobson* ±3.16 ±3.22 ±3.16 ±3.30 ±3.16 Brewer* ±3.06 ±2.92 ±2.82 ±2.92 ±3.08 SAOZ ±2.40 ±2.43 ±2.25 ±2.31 ±2.19 Drift per decade Dobson* 0.08 ± 0.13 −0.61 ± 0.33 −0.41 ± 0.19 −0.71 ± 0.35 −1.37 ± 1.60 Brewer* 0.21 ± 0.08 0.33 ± 0.26 0.01 ± 0.12 −0.61 ± 0.25 0.99 ± 1.02 SAOZ 0.51 ± 1.92 −0.14 ± 2.43 0.48 ± 1.54 −1.32 ± 1.82 −1.00 ± 4.43
Dobson n/a n/a n/a n/a n/a
Seasonality Brewer* 0.85 2.00 0.97 1.56 1.22
(peak–to–peak) SAOZ n/a n/a n/a n/a n/a
Latitudinal mean bias Dobson 1.18 ± 1.04 0.85 ± 1.37 1.67 ± 1.18 1.34 ± 1.20 1.50 ± 1.26 Brewer* 0.74 ± 0.35 0.26 ± 0.50 1.03 ± 0.60 0.95 ± 0.64 1.70 ± 1.01 SAOZ 0.69 ± 2.67 1.34 ± 3.14 0.22 ± 2.94 1.61 ± 4.55 0.82 ± 3.18 < 70 ◦ Dobson 1.19 ± 0.48 0.79 ± 0.65 1.35 ± 0.67 1.02 ± 0.73 0.97 ± 1.06 Brewer* 0.67 ± 0.35 −0.02 ± 0.89 0.88 ± 0.49 0.70 ± 0.63 1.17 ± 0.61 Solar zenith angle SAOZ 0.84 ± 0.68 0.40 ± 0.57 1.17 ± 0.32 1.10 ± 0.49 0.91 ± 0.55 mean bias > 70 ◦ Dobson 1.03 ± 1.14 −0.92 ± 3.29 1.37 ± 1.71 0.88 ± 1.92 1.77 ± 1.45 Brewer* 0.61 ± 0.88 −0.12 ± 2.48 1.45 ± 1.12 1.27 ± 1.42 2.55 ± 0.36 SAOZ 0.49 ± 0.87 −0.11 ± 1.94 1.02 ± 1.06 0.16 ± 1.18 0.78 ± 0.87
Brewer and Dobson ground-based measurements, showing an agreement of the order of ±1 %.
In Fig. 6 the percentage deviation of NH SBUV and GOD-FIT v4 satellite data sets from the respective ground-based measurements performed by the Dobson instrument is dis-played. In Fig. 6a, the time period 1995 to 2012 is shown, en-compassing the available data sets from NOAA 14 SBUV/2, NOAA 16 SBUV/2, NOAA 17 SBUV/2, GOME and SCIA-MACHY. In Fig. 6b, the time series of NOAA 18 SBUV/2, NOAA 19 SBUV/2, OMI, GOME-2A and GOME-2B for the years 2005 to 2017 are shown. The purpose of these plots is to investigate the consistency, the stability and the homo-geneity of 10 completely different time series generated with two different algorithms. It is well shown that, for the two time periods under consideration, all sensors are in very good agreement, with very similar seasonality amplitudes and bi-ases, further testifying to the homogeneity and stability of the GODFIT v4 products.
3 Level-3 total ozone columns
3.1 The level-3 GOME-type Total Ozone Essential Climate Variable (GTO-ECV) data record
One of the main aims of the ESA Ozone_cci project is to construct the homogeneous global long-term GOME-type to-tal ozone climate data record, hereafter termed GTO-ECV v3. The individual level-2 observations (presented and vali-dated above in Sect. 2) are converted into a level-3 product and then combined into one single cohesive record spanning the entire 22-year period, from 1995 to 2016. This section summarizes the main characteristics of the merging method-ology as well as the latest improvements and extensions im-plemented within the second phase of the Ozone_cci project. A detailed description of the predecessor of GTO-ECV v3 has been presented and validated in Loyola et al. (2009) and Coldewey-Egbers et al. (2015).
In short, at first, the individual level-2 measurements pro-cessed with the GODFIT v4 retrieval algorithm are mapped onto a regular global grid of 1◦×1◦ in latitude and lon-gitude to construct daily averages for each sensor. Before combining the individual gridded data, adjustments are made in order to account for possible biases and drifts between the instruments. In the previous algorithm version, which spanned the 15-year period between March 1996 and June 2011 (Coldewey-Egbers et al., 2015), the GOME TOCs were used as a reference to the other sensors; in this version the OMI measurements serve as a baseline for the inter-sensor calibration. Their long-term stability with respect to ground-based observation data is noteworthy (see Fig. 3a and c and Table 1) and the periods of overlap with the other sensors are sufficiently long, at least 4 years.
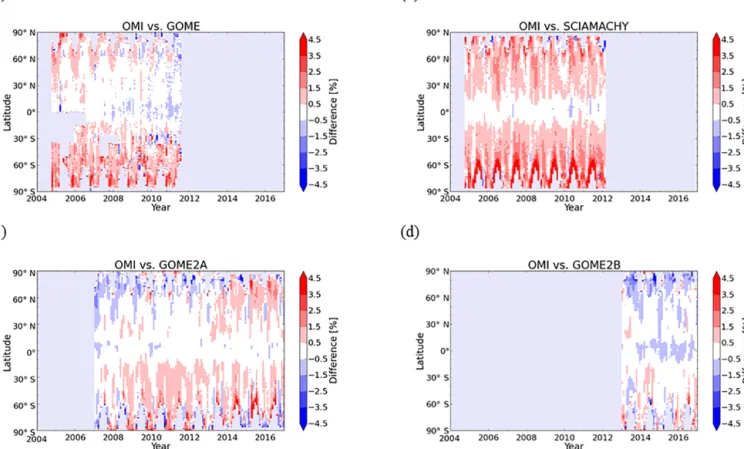
Figure 7 shows the percentage differences between OMI and the other four sensors for 1◦zonal monthly mean ozone columns during overlap periods. These zonal means were
computed for collocated daily gridded data in order to min-imize the impact of differences in the sampling pattern for OMI and the corresponding second sensor. In general, the inter-sensor consistency is very good; mean differences are between −0.2 ± 0.9 % (for GOME-2B, panel d) and 1.0 ± 1.4 % (for SCIAMACHY, panel b). In the inner trop-ics the bias is slightly negative for all sensors and it increases toward higher latitudes. The differences between OMI and GOME show slightly larger scatter in the SH due to signifi-cantly reduced spatial coverage of GOME as a consequence of the tape recorder failure in June 2003. The differences be-tween OMI and SCIAMACHY indicate a positive bias for most parts of the globe, with a maximum in the SH around the polar night. For both GOME and SCIAMACHY we ap-ply a static correction that depends on latitude and month of the year, using the seasonal mean differences calculated from the seasonal mean average of all available years with respect to OMI as a function of latitude. The differences between OMI and GOME-2A indicate a positive drift of ∼ 0.15 % per annum in the middle latitudes of both hemispheres, which we take into account during the adjustment. For both GOME-2A and GOME-2B, the correction factors with respect to OMI depend on time (month) and latitude. The adjustment is then applied to the daily gridded data for each individual sensor. Thereby the monthly correction factors are linearly interpo-lated in time.
Figure 8 shows the percentage differences between OMI and the other sensors without (orange–red curves) and with (green curves) the adjustment to OMI for the near global (60◦N–60◦S) mean ozone column as a function of time dur-ing the periods of overlap. The comparison with GOME is omitted in this plot because we use these data only until June 2003 in the final product. After the application of the cor-rection the mean biases are almost completely reduced, the scatter (standard deviation) decreased by 15–40 % and the drift in the differences between GOME-2A and OMI is elim-inated.
Subsequently, the individual (adjusted) data sets are com-bined into one single record. In contrast to the previous ver-sion (Coldewey-Egbers et al., 2015), where we used only one instrument at any given time, in GTO-ECV v3 we now aver-age all available daily measurements (weighted by the num-ber of measurements per day and grid box for the correspond-ing sensor), which improves the representativeness of the monthly averages. GOME data are restricted up to and until June 2003. As the ground-based validation of SCIAMACHY level-2 data indicates some lingering issues with the level-2 TOCs (see Sect. 2.3), we use SCIAMACHY only until Oc-tober 2004 in order to fill the data gap between the GOME loss of global coverage and the launch date of OMI. For the calculation of monthly means we apply the same latitudi-nal constraints as defined in Coldewey-Egbers et al. (2015; see their Table 2), in order to provide representative averages that contain a sufficient number of measurements equally dis-tributed over time. The complete merged GTO-ECV v3 data
Figure 7. Percentage differences between OMI and the other four sensors for 1◦zonal monthly mean ozone columns during overlap periods. (a) GOME, (b) SCIAMACHY, (c) GOME-2A and (d) GOME-2B.
Figure 8. Percentage differences between SCIAMACHY and OMI (circles), GOME-2A and OMI (squares), and GOME-2B and OMI (diamonds) as a function of time for the periods of overlap. Orange– red curves denote the differences without adjustment to OMI, and green curves denote the differences after the adjustment to OMI.
record with typical ozone characteristics is shown in Fig. 9. The highest ozone values occur in NH springtime, whereas monthly mean values are below 200 D.U. from September to November southwards of 70◦S. Black horizontal lines indi-cate the period for each sensor included.
Figure 9. GTO-ECV total ozone column data record as a function of latitude and time from July 1995 to March 2017. Blue horizon-tal lines indicate the period for each sensor included in the merged product.
3.2 Level-3 validation results and discussion
The validation of the new level-3 GTO-ECV v3 merged product was performed using as ground truth the Brewer and Dobson spectrophotometer network described in Sect. 2.2, as was applied in the validation of the previous level-3 record (Coldewey-Egbers et al., 2015). In order to create the
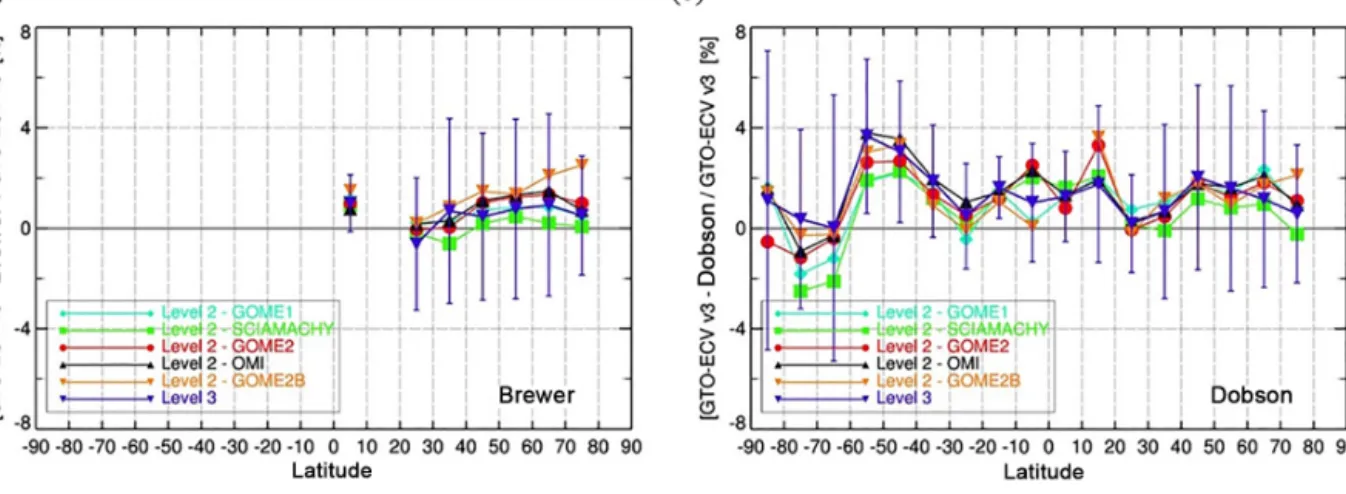
level-Figure 10. Latitudinal variability of the percentage difference between satellite observations and ground-based measurements. (a) for the Brewer network and (b) for the Dobson network. The light blue line is GOME level-2 comparison, the green line is SCIAMACHY level-2 comparison, the red line is GOME-2A level-2 comparison, the black line is OMI level-2 comparison, the orange line is GOME-2B level-2 comparison and the purple line is level-3 GTO-ECV v3 comparison. The 1σ standard deviation of the average is also displayed only for the level-3 lines.
3 TOC field, based on the WOUDC ground-based stations, the reported TOCs were gridded into the same 1◦×1◦grid as the GTO-ECV v3 data, on a monthly basis, with most grid points being represented by only one reporting station. In detail, direct-sun measurements were considered for the gridding of the ground-based TOCs into level-3 grid points, even though in some cases this choice severely decreases the number of measurements. As also performed in Coldewey-Egbers et al. (2015), the threshold on the number of mea-surements available before the computation of the associated monthly mean was investigated. As a compromise between obtaining the highest global coverage possible and the most representative monthly means, especially at high latitudes, a lower limit of 10 measurements per month and per grid box was enforced so that the temporal representativeness er-rors are minimized. We note here that restricting the monthly collocated measurements with respect to their mean effec-tive day, which is a measure for the temporal distribution of the daily measurements within a month, did not alter sig-nificantly the findings, whereas it excluded entire zones and months from the comparative process and we opted not to apply such a restriction here.
Figure 10 shows the percentage difference between the satellite and the Brewer (panel a) and Dobson (panel b) TOC records as a function of latitude. The five individual satel-lite TOCs are very consistent with each other for all latitudes and in very close agreement with the ground-based data. The level-3 comparisons (purple line) show very good agreement with the individual level-2 lines. In particular, over the NH, all level-2 comparisons (apart from SCIAMACHY, in green) show a slight positive deviation of 0–2 % to the ground-based data for both ground-based instrument types. In the SH the level-3 comparisons show a near-perfect agreement with the
level-2 comparisons apart from the 70–80◦S belt, where the spread in comparisons reaches the 3.0 % level, which may be attributed to sampling differences between the level-2 and level-3 data (see Coldewey-Egbers et al., 2015, for more in-depth discussion of this issue).
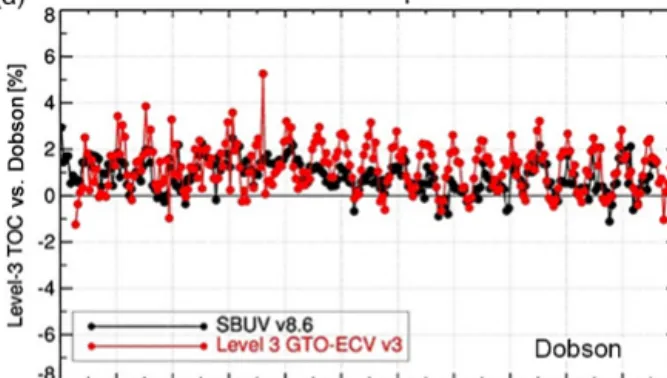
In Fig. 11 the NH and SH time-series comparisons of the level-2 and level-3 data records with the Dobson and Brewer measurements are shown. The Dobson comparisons for SH (panel a) and NH (panel b) show very good agreement be-tween level-3 and individual level-2 lines, within the 1 % dif-ference level for most of the 22-year data record, except for a small number of outliers. The Brewer comparison in the NH (panel c) shows less amplitude than the Dobson comparisons throughout the full time series, for reasons discussed already in Sect. 2.2 and 2.3.
The agreement between the five datasets and the ground-based measurements is outstanding, with 0.5 to 1.5 % peak-to-peak amplitude. For the entire time series of the level-3 data record the mean difference remains mainly posi-tive for all time-series comparisons shown in Fig. 11. Con-cerning the level-3 comparisons in the NH, the drift per decade of the differences with respect to ground-based data is negligible, −0.11 ± 0.10 % decade−1for Dobson and +0.22 ± 0.08 % decade−1for Brewer collocations. Similarly to level 3, no long-term drift in the differences of the in-dividual level-2 data sets was found for either Dobson and Brewer comparisons, with OMI showing the smallest drift per decade (+0.05 ± 0.12 % for Brewer and −0.39 ± 0.19 % for Dobson in the NH; −0.15 ± 0.15 % for Dobson measure-ments in the SH). The good quality of the GTO-ECV v3 level-3 TOC record temporal stability, which satisfies well the requirements for the long-term stability for total ozone measurements of between 1 and 3 % decade−1 (Van Weele
Figure 11. Time series of the percentage difference between satel-lite observations and ground-based measurements for the Dobson network in the NH (a) and in the SH (b) and for the Brewer net-work, NH only (c). The light blue line is GOME level-2 compar-ison, the green line is SCIAMACHY level-2 comparcompar-ison, the red line is GOME-2A level-2 comparison, the black line is OMI level-2 comparison, the orange line is GOME-2B level-2 comparison and the purple line is level-3 GTO-ECV v3 comparison.
et al., 2016), and the excellent inter-sensor consistency make the new level-3 GTO-ECV v3 dataset suitable and useful for longer-term analysis of the ozone layer, such as decadal trend studies (e.g. Coldewey-Egbers et al., 2015), the evaluation of chemistry–climate model projections and data assimilation applications.
Figure 12. Same as in Fig. 11. The black line is SBUV merged comparison and the red line is level-3 GTO-ECV v3 comparison.
In order to assess and ensure the quality of the new level-3 GTO-ECV vlevel-3 dataset, comparisons are performed against the SBUV merged data product, also shown above in the level-2 TOC validation section and recently quality assured in Frith et al. (2017). In Fig. 12, the time-series comparison
between GTO-ECV v3 and SBUV merged is presented for the NH and Dobson (panel a), the SH and Dobson (panel b) and the NH and Brewer (panel c) instrument types. The level-3 GTO-ECV vlevel-3 (red line) and SBUV merged (black line) datasets show an agreement of within ±1.5 %, considering their individual instrumental and algorithm differences, as well as a very similar seasonal variability with a peak-to-peak amplitude between −1 and +2 % in Dobson and −0.5 and +1 % in Brewer cases over the entire time period. Fur-thermore, the two datasets show almost the same negligible drift per decade in the NH for both ground-based instrument networks, whereas in the SH for Dobson collocations the drift per decade is +0.23 ± 0.09 % and −0.09 ± 0.07 % for the level-3 GTO-ECV v3 and the SBUV merged TOCs, re-spectively.
4 Summary and conclusions
In this work, the Essential Climate Variable (ECV) Cli-mate Research Data Package Total Ozone Column (CRDP TOC), refined and updated via the ESA-CCI Phase II, is presented and validated against independent ground-based TOC observations. Level-2 TOCs, produced by the GODFIT v4 algorithm as applied to the GOME/ERS-2, OMI/Aura, SCIAMACHY/Envisat and GOME-2/A and Metop-B observations, form the basis for a 22-year-long consistent, smooth and homogeneous CRDP. In addition, the individual sensor products have been combined and merged into one single cohesive level-3 data record, GTO-ECV v3. Detailed quality control and assurance against specific requirements from the international climate–chemistry modelling commu-nity showed that the product more than meets the official user requirements, i.e. that the stability of the TOC measurements has to be between 1 and 3 % decade−1, that the radiative forc-ing introduced by the evolution of the ozone layer has to be less than 2 % and that the short-term variability has to be less than 3 %.
The individual level-2 data sets show excellent inter-sensor consistency with mean differences within 1.0 % at moderate latitudes (±50◦), whereas the level-3 data sets show mean differences with respect to the OMI reference data record that span between −0.2 ± 0.9 % (for GOME-2B) and 1.0 ± 1.4 % ( for SCIAMACHY).
For the level-2 validation against ground-based measure-ments, the mean bias between GODFIT v4 satellite and Brewer, Dobson and SAOZ-reported TOCs is well within 1.5 ± 1.0 % for all sensors, the drift per decade spans be-tween 0 % and 1.4 ± 1.0 % depending on the sensor and the peak-to-peak seasonality ranges from ∼ 1 % for GOME and OMI to ∼ 2 % for SCIAMACHY.
For the level-3 validation against ground-based mea-surements a remarkable agreement is shown with 0.5 to 1.5 % peak-to-peak amplitude for the monthly mean time series, as well as a negligible drift in the NH with
differences at −0.11 ± 0.10 % decade−1 for Dobson and +0.22 ± 0.08 % decade−1for Brewer collocations.
We hence conclude that the quality of the GTO-ECV v3 level-3 TOC record temporal stability satisfies well the re-quirements of 1–3 % decade−1. The prominent inter-sensor consistency renders both the level-2 GODFIT v4, as well as the level-3 GTO-ECV v3 datasets, suitable and useful for longer-term analysis of the ozone layer, such as decadal trend studies, the evaluation of model simulations and data assim-ilation applications.
The Ozone_cci CRDP includes data products for TOCs, ozone profiles from nadir sensors and stratospheric ozone profiles from limb and occultation sensors. All data sets are reported in netCDF-CF format following CCI and GCOS standards and are freely available on the Ozone_cci web site (http://www.esa-ozone-cci.org/?q=node/160).
Data availability. The level-2 and level-3 ESA Ozone_cci datasets are available at http://www.esa-ozone-cci.org/?q=node/160 (Lerot et al., 2014, and Coldewey-Egbers et al., 2015). The SBUV v8.6 datasets are available at https://acd-ext.gsfc.nasa.gov/Data_ services/merged/ (McPeters et al., 2013). The Brewer and Dobson datasets used in this work can be downloaded from the WOUDC database (https://doi.org/10.14287/10000004; https://woudc.org/ data/dataset_info.php?id=totalozone; WMO/GAW Ozone Monitor-ing Community, 2017), while the SAOZ ground-based data are available at the NDACC database (http://www.ndaccdemo.org/) and from http://saoz.obs.uvsq.fr/ (Pommereau and Goutail, 1988).
The Supplement related to this article is available online at https://doi.org/10.5194/amt-11-1385-2018-supplement.
Competing interests. The authors declare that they have no conflict of interest.
Special issue statement. This article is part of the special issue “Quadrennial Ozone Symposium 2016 – Status and trends of at-mospheric ozone (ACP/AMT inter-journal SI)”. It is a result of the Quadrennial Ozone Symposium 2016, Edinburgh, United King-dom, 4–9 September 2016.
Acknowledgements. The authors are grateful to ESA’s Climate Change Initiative Ozone project, Phase II, for providing the support and funding necessary for this work. The ground-based data used in this publication were obtained as part of WMO’s Global Atmosphere Watch (GAW) and the Network for the Detection of Atmospheric Composition Change (NDACC). They are publicly available via the World Ozone and UV Data Centre (WOUDC) and the NDACC Data Host Facility. We would like to acknowledge and warmly thank all the investigators that provide data to these reposi-tories on a timely basis, as well as the handlers of these databases
for their upkeep and quality-guaranteed efforts. We would also like to acknowledge the SBUV instrument team members for their work producing SBUV version 8.6 TOC data record.
Edited by: Richard Eckman
Reviewed by: two anonymous referees
References
Aliwell, S. R., Van Roozendael, M., Johnston, P. V., Richter, A., Wagner, T., Arlander, D. W., Burrows, J. P., Fish, D. J., Jones, R. L., Tørnkvist, K. K., Lambert, J.-C., Pfeilsticker, K., and Pundt, I.: Analysis for BrO in zenith-sky spectra: An intercomparison exercise for analysis improvement, J. Geophys. Res., 107, 1–20., https://doi.org/10.1029/2001JD000329, 2002.
Antón, M., Loyola, D., López, M., Vilaplana, J. M., Bañón, M., Zimmer, W., and Serrano, A.: Comparison of GOME-2/MetOp total ozone data with Brewer spectroradiometer data over the Iberian Peninsula, Ann. Geophys., 27, 1377–1386, https://doi.org/10.5194/angeo-27-1377-2009, 2009.
Bak, J., Liu, X., Kim, J. H., Chance, K., and Haffner, D. P.: Validation of OMI total ozone retrievals from the SAO ozone profile algorithm and three operational algorithms with Brewer measurements, Atmos. Chem. Phys., 15, 667–683, https://doi.org/10.5194/acp-15-667-2015, 2015.
Balis, D., Kroon, M., Koukouli, M. E., Brinksma, E. J., Labow, G., Veefkind, J. P., and McPeters, R. D.: Valida-tion of Ozone Monitoring Instrument total ozone column measurements using Brewer and Dobson spectrophotometer ground-based observations, J. Geophys. Res., 112, D24S46, https://doi.org/10.1029/2007JD008796, 2007a.
Balis, D., Lambert, J.-C., Van Roozendael, M., Spurr, R., Loyola, D., Livschitz, Y., Valks, P., Amiridis, V., Gerard, P., Granville, J., and Zehner, C.: Ten years of GOME/ERS2 total ozone data – The new GOME data processor (GDP) version 4: 2. Ground-based validation and comparisons with TOMS V7/V8, J. Geophys. Res., 112, D07307, https://doi.org/10.1029/2005JD006376, 2007b.
Bass, A. M. and Paur, R. J.: The Ultraviolet Cross–sections of Ozone: I. The Measurements II. Results and Temperature De-pendence, in Atmospheric Ozone, Proceedings of the Quadren-nial Ozone Symposium, Halkidiki, Greece, edited by: Zerefos, C. and Ghazi, A., Reidel, Dordrecht, the Netherlands, 606–616, 1985.
Beirle, S., Lampel, J., Lerot, C., Sihler, H., and Wagner, T.: Pa-rameterizing the instrumental spectral response function and its changes by a super-Gaussian and its derivatives, Atmos. Meas. Tech., 10, 581–598, https://doi.org/10.5194/amt-10-581-2017, 2017.
Bernhard, G., Evans, R. D., Labow, G. J., and Oltmans, S. J.: Bias in Dobson total ozone measurements at high lati-tudes due to approximations in calculations of ozone absorp-tion coefficients and air mass, J.Geophys. Res, 110, D10305, https://doi.org/10.1029/2004JD005559, 2005.
Coldewey-Egbers, M., Weber, M., Lamsal, L. N., de Beek, R., Buchwitz, M., and Burrows, J. P.: Total ozone retrieval from GOME UV spectral data using the weighting
func-tion DOAS approach, Atmos. Chem. Phys., 5, 1015–1025, https://doi.org/10.5194/acp-5-1015-2005, 2005.
Coldewey-Egbers, M., Loyola, D. G., Koukouli, M., Balis, D., Lambert, J.-C., Verhoelst, T., Granville, J., van Roozendael, M., Lerot, C., Spurr, R., Frith, S. M., and Zehner, C.: The GOME-type Total Ozone Essential Climate Variable (GTO-ECV) data record from the ESA Climate Change Initiative, Atmos. Meas. Tech., 8, 3923–3940, https://doi.org/10.5194/amt-8-3923-2015, 2015.
Fioletov, V. E., Kerr, J. B., Hare, E. W., Labow, G. J., and McPeters, R. D.: An assessment of the world ground-based total ozone network performance from the compari-son with satellite data, J. Geophys. Res., 104, 1737–1747, https://doi.org/10.1029/1998JD100046, 1999.
Fioletov, V. E., Labow, G., Evans, R., Hare, E. W., Köhler, U., McElroy, C. T., Miyagawa, K., Redondas, A., Savastiouk, V., Shalamyansky, A. M., Staehelin, J., Vanicek, K., and Web, M.: Performance of the ground-based total ozone network as-sessed using satellite data, J. Geophys. Res., 113, D14313, https://doi.org/10.1029/2008JD009809, 2008.
Frith, S. M., Kramarova, N. A., Stolarski, R. S., McPeters, R. D., Bhartia, P. K., and Labow, G. J.: Recent changes in to-tal column ozone based on the SBUV Version 8.6 Merged Ozone Data Set, J. Geophys. Res.-Atmos., 119, 9735–9751, https://doi.org/10.1002/2014JD021889, 2014.
Frith, S. M., Stolarski, R. S., Kramarova, N. A., and McPeters, R. D.: Estimating uncertainties in the SBUV Version 8.6 merged profile ozone data set, Atmos. Chem. Phys., 17, 14695–14707, https://doi.org/10.5194/acp-17-14695-2017, 2017.
Hendrick, F., Pommereau, J.-P., Goutail, F., Evans, R. D., Ionov, D., Pazmino, A., Kyrö, E., Held, G., Eriksen, P., Dorokhov, V., Gil, M., and Van Roozendael, M.: NDACC/SAOZ UV-visible total ozone measurements: improved retrieval and comparison with correlative ground-based and satellite observations, At-mos. Chem. Phys., 11, 5975–5995, https://doi.org/10.5194/acp-11-5975-2011, 2011.
Keppens, A., Lambert, J.-C., Granville, J., Hubert, D., Verhoelst, T., Compernolle, S., Latter, B., Kerridge, B., Siddans, R., Boy-nard, A., Hadji-Lazaro, J., Clerbaux, C., Wespes, C., Hurtmans, D. R., Coheur, P.-F., van Peet, J. C. A., van der A, R. J., Garane, K., Koukouli, M. E., Balis, D. S., Delcloo, A., Kivi, R., Stübi, R., Godin-Beekmann, S., Van Roozendael, M., and Zehner, C.: Quality assessment of the Ozone_cci Climate Re-search Data Package (release 2017): 2. Ground-based validation of nadir ozone profile data products, Atmos. Meas. Tech. Dis-cuss., https://doi.org/10.5194/amt-2017-447, in review, 2018. Kerr, J. B.: New methodology for deriving total ozone and
other atmospheric variables from Brewer spectropho-tometer direct sun spectra, J. Geophys. Res., 107, 4731, https://doi.org/10.1029/2001JD001227, 2002.
Kerr, J. B., Asbridge, I. A., and Evans, W. F. J.: Intercompari-son of total ozone measured by the Brewer and DobIntercompari-son spec-trophotometers at Toronto, J. Geophys. Res., 93, 11129–11140, https://doi.org/10.1029/JD093iD09p11129, 1988.
Koukouli, M. E., Balis, D. S., Loyola, D., Valks, P., Zimmer, W., Hao, N., Lambert, J.-C., Van Roozendael, M., Lerot, C., and Spurr, R. J. D.: Geophysical validation and long-term consistency between GOME-2/MetOp-A total ozone column and measurements from the sensors GOME/ERS-2,
SCIA-MACHY/ENVISAT and OMI/Aura, Atmos. Meas. Tech., 5, 2169–2181, https://doi.org/10.5194/amt-5-2169-2012, 2012. Koukouli, M. E., Lerot, C., Granville, J., Goutail, F., Lambert, J.-C.,
Pommereau, J.-P., Balis, D., Zyrichidou, I., Van Roozendael, M., Coldewey-Egbers, M., Loyola, D., Labow, G., Frith, S., Spurr, R., and Zehner, C.: Evaluating a new homogeneous total ozone climate data record from GOME/ERS-2, SCIAMACHY/Envisat, and GOME-2/MetOp-A, J. Geophys. Res., 120, 12296–12312, https://doi.org/10.1002/2015JD023699, 2015.
Koukouli, M. E., Zara, M., Lerot, C., Fragkos, K., Balis, D., van Roozendael, M., Allart, M. A. F., and van der A, R. J.: The impact of the ozone effective temperature on satellite validation using the Dobson spectrophotometer network, Atmos. Meas. Tech., 9, 2055–2065, https://doi.org/10.5194/amt-9-2055-2016, 2016. Labow, G. J., McPeters, R. D., Bhartia, P. K., and Kramarova, N.: A
comparison of 40 years of SBUV measurements of column ozone with data from the Dobson/Brewer network, J. Geophys. Res.-Atmos., 118, 7370–7378, https://doi.org/10.1002/jgrd.50503, 2013.
Labow, G. J., Ziemke, J. R., McPeters, R. D., Haffner, D. P., and Bhartia, P. K.: A Total Ozone Dependent Ozone Profile Climatology based on Ozone-Sondes and Aura MLS Data, J. Geophys. Res.-Atmos., 120, 2537–2545, https://doi.org/10.1002/2014JD022634, 2015.
Lambert, J.-C., Balis, D., Delcloo, A., Garane, K., Goutail, F., Granville, J., Hubert, D., Keppens, A., Kivi, R., Koukouli, M. L., Pommereau, J.-P., Stübi, R., Verhoelst, T., Loyola, D., Siddans, R., van der A, R., Clerbaux, C., Laeng, A., Sofieva, V., We-ber, M., Van Roozendael M., and Zehner, C.: ESA Climate Change Initiative – Ozone_cci: Product Validation and Inter-comparison Report (PVIR), Ozone_cci_Phase-II_PVIR_3.0, Is-sue 3.0/Rev. 0, available at: http://esa-ozone-cci.org/?q=webfm_ send/177, last access: 2 March 2018.
Lerot, C., Van Roozendael, M., Spurr, R., Loyola, D., Coldewey-Egbers, M., Kochenova, S., van Gent, J., Koukouli, M., Balis, D., Lambert, J.-C., Granville, J., and Zehner, C.: Homogenized total ozone data records from the European sensors GOME/ERS-2, SCIAMACHY/Envisat, and GOME-2/MetOp-A, J. Geophys. Res.-Atmos., 119, 1639–1662, https://doi.org/10.1002/2013JD020831, 2014.
Loyola, D. G., Coldewey-Egbers, M., Dameris, M., Garny, H., Stenke, A., van Roozendael, M., Lerot, C., Balis, D., and Kouk-ouli, M.: Global long-term monitoring of the ozone layer – a pre-requisite for predictions, Int. J. Remote Sens., 30, 4295–4318, 2009.
Loyola, D. G., Koukouli, M. E., Valks, P., Balis, D. S., Hao, N., Van Roozendael, M., Spurr, R. J. D., Zimmer, W., Kiemle, S., Lerot, C., and ambert, J.-C.: The GOME-2 Total Column Ozone Prod-uct: Retrieval Algorithm and Ground-Based Validation, J. Geo-phys. Res., 116, https://doi.org/10.1029/2010JD014675, 2011. McPeters, R. D., Bhartia, P. K., Haffner, D., Labow, G. J.,
and Flynn, L.: The version 8.6 SBUV ozone data record: An overview, J. Geophys. Res.-Atmos., 118, 8032–8039, https://doi.org/10.1002/jgrd.50597, 2013.
Orphal, J., Staehelin, J., Tamminen, J., Braathen, G., De Backer, M.-R., Bais, A., Balis, D., Barbe, A., Bhartia, P. K., Birk, M., Burkholder, J. B., Chance, K., von Clarmann, T., Cox, A., Degenstein, D., Evans, R., Flaud, J.-M., Flittner, D., Godin-Beekmann, S., Gorshelev, V., Gratien, A., Hare, E., Janssen, C.,
Kyrölä, E., McElroy, T., McPeters, R., Pastel, M., Petersen, M., Petropavlovskikh, I., Picquet-Varrault, B., Pitts, M., Labow, G., Rotger-Languereau, M., Leblanc, T., Lerot, C., Liu, X., Moussay, P., Redondas, A., Van Roozendael, M., Sander, S. P., Schnei-der, M., Serdyuchenko, A., Veefkind, P., Viallon, J., Viatte, C., Wagner, G., Weber, M., Wielgosz, R. I., and Zehner, C.: Absorp-tion cross-secAbsorp-tions of ozone in the ultraviolet and visible spectral regions: Status report 2015, J. Mol. Spectrosc., 327, 105–121, https://doi.org/10.1016/j.jms.2016.07.007, 2016.
Pommereau, J. and Goutail, F.: O3 and NO2 ground-based
measurements by visible spectrometry during Arctic winter and spring, Geophys. Res. Lett., 15, 891–894, https://doi.org/10.1029/GL015i008p00891, 1988.
Rahpoe, N., van der A, R., Adams, C., Bernath, P., von Clarmann, T., Coldewey-Egbers, M., Degenstein, D., Dudhia, A., Harg-reaves, R., Laeng, A., Lerot, C., Loyola, D., van Peet, J., Sofieva, V., Stiller, G., Tamminen, J., Urban, J., Van Roozendael, M., Weber, M., Danckaert, T., Astoreca, R., Heue, K.-P., Sheese, P., Walker, K., and Tukiainen, S.: Algorithm Theoretical Basis Doc-ument Version 2 (ATBDv2), Ozone_cci Phase-2 (Project Deliv-erable), Reference: Ozone_cci_ATBD_Phase2_V2, Ozone-CCI, 2017, available at: http://www.esa-ozone-cci.org/?q=webfm_ send/198 (last access: 2 March 2018), 2017.
Scarnato, B., Staehelin, J., Peter, T., Gröbner, J., and Stübi, R.: Temperature and slant path effects in Dobson and Brewer total ozone measurements, J. Geophys. Res., 114, D24303, https://doi.org/10.1029/2009JD012349, 2009.
Serdyuchenko, A., Gorshelev, V., Weber, M., Chehade, W., and Burrows, J. P.: High spectral resolution ozone absorption cross-sections – Part 2: Temperature dependence, Atmos. Meas. Tech., 7, 625–636, https://doi.org/10.5194/amt-7-625-2014, 2014. Spurr, R., Natraj, V., Lerot, C., Van Roozendael, M., and Loyola,
D.: Linearization of the Principal Component Analysis method for radiative transfer acceleration: Application to retrieval algo-rithms and sensitivity studies, J. Quant. Spectrosc. Ra., 125, 1– 17, 2013.
Staehelin, J., Kerr, J., Evans, R., and Vanicek, K.: Comparison Of Total Ozone Measurements of Dobson and Brewer Spectropho-tometers and Recommended Transfer Functions, WMO TD No. 1147, World Meteorological Organization, Global Atmosphere Watch, No. 149, available at: https://library.wmo.int/pmb_ged/ wmo-td_1147.pdf (last access: 2 March 2018), 2003.
Van Weele, M., Dameris, M., Braesicke, P., and van der A, R.: User Requirements Document Ozone_cci, Issue 3, Ozone_cci Phase-2 (Project Deliverable D1.1), ESA-ESRIN, Reference: Ozone_cci_URD_3, Ozone-CCI, 2016, available at: http://www. esa-ozone-cci.org/?q=webfm_send/175 (last access: 2 March 2018), 2016.
Vanicek, K.: Differences between ground Dobson, Brewer and satellite TOMS-8, GOME-WFDOAS total ozone observations at Hradec Kralove, Czech, Atmos. Chem. Phys., 6, 5163–5171, https://doi.org/10.5194/acp-6-5163-2006, 2006.
Van Roozendael, M., Peeters, P., Roscoe, H. K., De Backer, H., Jones, A., Bartlett, L., Vaughan, G., Goutail, F., Pommereau, J.-P., Kyro, E., Wahlstrom, C., Braathen, G., and Simon, P.: Vali-dation of Ground-Based Visible Measurements of Total Ozone by Comparison with Dobson and Brewer Spectrophotometers, J. Atmos. Chemi., 29, 55–83, 1998.
Veefkind, J. P., de Haan, J. F., Sneep, M., and Levelt, P. F.: Im-provements to the OMI O2–O2operational cloud algorithm and
comparisons with ground-based radar–lidar observations, At-mos. Meas. Tech., 9, 6035–6049, https://doi.org/10.5194/amt-9-6035-2016, 2016.
Verhoelst, T., Granville, J., Hendrick, F., Köhler, U., Lerot, C., Pom-mereau, J.-P., Redondas, A., Van Roozendael, M., and Lambert, J.-C.: Metrology of ground-based satellite validation: co-location mismatch and smoothing issues of total ozone comparisons, At-mos. Meas. Tech., 8, 5039–5062, https://doi.org/10.5194/amt-8-5039-2015, 2015.
Wang, P., Stammes, P., van der A, R., Pinardi, G., and van Roozen-dael, M.: FRESCO+: an improved O2 A-band cloud retrieval
algorithm for tropospheric trace gas retrievals, Atmos. Chem. Phys., 8, 6565–6576, https://doi.org/10.5194/acp-8-6565-2008, 2008.
WMO/GAW Ozone Monitoring Community: World Mete-orological Organization-Global Atmosphere Watch Pro-gram (WMO-GAW)/World Ozone and Ultraviolet Radia-tion Data Centre (WOUDC) total ozone data, available at: https://doi.org/10.14287/10000004, last access: 15 December 2017.
Ziemke, J. R., Chandra, S., Labow, G. J., Bhartia, P. K., Froide-vaux, L., and Witte, J. C.: A global climatology of tropo-spheric and stratotropo-spheric ozone derived from Aura OMI and MLS measurements, Atmos. Chem. Phys., 11, 9237–9251, https://doi.org/10.5194/acp-11-9237-2011, 2011.