HAL Id: hal-02902217
https://hal.archives-ouvertes.fr/hal-02902217
Submitted on 18 Jul 2020
Carneic Acids from an Endophytic Phomopsis sp. as
Dengue Virus Polymerase Inhibitors
Laure-Anne Peyrat, Véronique Eparvier, Cecilia Eydoux, Jean-Claude
Guillemot, Marc Litaudon, Didier Stien
To cite this version:
Laure-Anne Peyrat, Véronique Eparvier, Cecilia Eydoux, Jean-Claude Guillemot, Marc Litaudon, et al.. Carneic Acids from an Endophytic Phomopsis sp. as Dengue Virus Polymerase Inhibitors. Journal of Natural Products, American Chemical Society, 2020, �10.1021/acs.jnatprod.9b01169�. �hal-02902217�
Carneic Acids from an Endophytic Phomopsis sp. as
Dengue Virus Polymerase Inhibitors
Laure-Anne Peyrat,† Véronique Eparvier,† Cécilia Eydoux,‡ Jean-Claude Guillemot,‡ Marc
Litaudon,*,† and Didier Stien*,§
†Université Paris-Saclay, CNRS, Institut de Chimie des Substances Naturelles, UPR 2301,
91198, Gif-sur-Yvette, France
‡Centre de Recherche Architecture et Fonction des Macromolécules Biologiques, UMR 7257
CNRS, Aix-Marseille Univ., 163 Avenue de Luminy, 13288-Marseille Cedex 09, France
§Sorbonne Université, CNRS, Laboratoire de Biodiversité et Biotechnologies Microbiennes,
Thirteen carneic acids were isolated from the fungal endophyte Phomopsis sp. SNB-LAP1-7-32.
Their structures were identified by mass spectrometry and extensive one- and two-dimensional
NMR spectroscopy and through comparison with data reported in the literature. Compounds
1-13 were investigated for their antipolymerase activities against DENV polymerase and Zika
NS5. Five of them exhibited significant inhibition of dengue polymerase with IC50s in the 10 to
Endophytes are microorganisms growing intra- and/or intercellularly in the tissues of
their host plant without causing symptoms. These microorganisms, either bacteria or fungi, can
spend all or part of their life cycle inside the tissues of their host.1 They contribute to the host’s
protection from biotic and abiotic stress factors. Endophytes are an important source of bioactive
natural products and can be considered a source of economic potential in the agrochemical and
pharmaceutical industries. Since the discovery in 1993 of paclitaxel in Taxomyces brevifolia,2 a
fungal endophyte associated with the phloem of the Pacific yew, Taxus brevifolia, endophytes
have captured the attention of many microbiologists and chemists, and the discovery of new
compounds endowed with antibacterial, antiviral, antifungal, cytotoxic, and antiprotozoal
properties has increased exponentially.3–8
Recently, our group screened extracts from 1500 tropical plants using a dengue replicon virus-cell-based assay. The results were examined from a phylogenic perspective, leading to the selection of several species of the Diospyros genus for further investigation.9,10 A series of
antiviral ursane- and lupane-type triterpenoids were identified from D. glans and D. carbonaria. Thereafter, we undertook a study of endophytic fungi associated with D. carbonaria, a species growing in dense rainforest in French Guiana. Thirty-eight fungi belonging to 5 genera were isolated from the leaves and bark of this species, among which a strain identified by sequencing as Phomopsis sp. exhibited the most potent anti-dengue activity.10 Phomopsis (teleomorph
Diaporthe) species are ubiquitous as endophytes of many hosts worldwide. They also comprise
phytopathogens causing cankers, root and fruit rots, leaf spots decay, blights and wilts on a wide range of plant hosts.11
and its endophyte Phomopsis sp. SNB-LAP1-7-32, although the capacity of the fungus to biosynthesize betulinic acid faded upon subculturing.10 Nevertheless, dengue virus replication
inhibitory potential remained in the fungal extract. We therefore embarked upon investigating
Phomopsis sp. SNB-LAP1-7-32 secondary metabolites and evaluating their anti-dengue
potential. Similar to dengue virus, Zika virus belongs to the Flaviviridae family and possesses the same vector, a similar genome and the same replication mechanism. To find new viral pan-inhibitors, compounds isolated from Phomopsis sp. have also been evaluated against Zika virus. ■ RESULTS AND DISCUSSION
Phomopsis sp. (SNB-LAP1-7-32) was isolated from the leaves of Diospyros carbonaria Benoist.
It was cultivated on potato dextrose agar (PDA), and the ethyl acetate extract of the culture exhibited a significant inhibition of dengue virus replication (60 % at 10 μg/mL) without cytotoxicity (100 % of viable COS cells at 10 μg/mL). The extract was subjected to C18 flash
chromatography to yield 8 fractions, which were evaluated in the dengue polymerase assay (Supporting information, Table S1). Most of the fractions showed at least some polymerase-inhibiting activity, and fractions 6, 7 and 8 exhibited a clear dose-related effect. All fractions were eventually submitted to semipreparative HPLC, which yielded 13 new carneic acids (1-13). Betulinic acid was isolated from fraction 8.10
The HRESIMS of compound 1 indicated a molecular formula C21H30O3, a compound
with 7 degrees of unsaturation. The 1H NMR data (Table 1) revealed four methyl groups at δH
1.62, 1.58, 1.50, and 0.91 and six vinylic protons at δH 7.35, 6.13, 6.10, 5.79, 5.25, and 5.22. The 13
C NMR (Table 2) and HSQC spectra revealed the presence of a carboxylic acid (δC 171.6)
(1689.63 cm-1), eight other sp2 carbons (δC 152.2, 147.1, 134.5, 133.5, 127.2, 125.7, 124.3, and
117.9), and seven sp3 methines (δC 69.8, 50.0, 44.9, 34.9, 46.9, 42.3, 40.9, and 56.7), one of
which is oxygenated (C-10). This information suggested that compound 1 could be an analogue
of carneic acids A and B, described by Quang et al. (Figure S1).12,13 The COSY spectrum
revealed two spin systems, one from 2 to 15, including the methyl substituents 19 and
C-20, and the second from C-17 to C-18 and C-21 (Figure 1). The spin system from C-2 to C-15
allowed building most of the decaline skeleton. Long-range COSY correlations Me-21/H-17 and
from H3-20 and H3-21 to their respective neighboring carbons, suggested that the methylpropyl
unit was linked to C-15. HMBC correlations also confirmed the ring junction with C-12, as
depicted in Figure 1. The H-2–H-3 coupling constant (J = 15.3 Hz) allowed us to ascertain the E
configuration of the C-2–C-3 double bond. The magnetic proximity of protons H-4 and H-5
induced second-order figures and precluded the reading of the H-4–H-5 coupling constant. At
this point, the configuration of the C-4–C-5 double bond was uncertain. However, comparison of
1
H and 13C spectra in the 13 carneic acid series indicated that the C-4–C-5 double bond was
Table 1. 1H NMR Spectroscopic Data (CDCl3) for Compounds 1−7. Position 1a 2a 3b 4a 5a 6a 7a 2 5.79 d (15.3) 5.79 d (15.3) 5.79 d (15.2) 5.83 d (15.3) 5.80 brd (15.3) 5.83 brd (14.5) 5.78 d (15.3) 3 7.35 m 7.35 brddd (15.3, 6.9, 3.1) 7.36 m 7.36 dd (15.3, 10.9) 7.33 brdd (9.8, 15.2) 7.18 dd (14.5, 10.7) 7.33 m 4 6.10 m 6.122 m 6.15 m 6.20 dd (15.3, 10.9) 6.13 m 6.17 dd (15.0, 10.7) 6.13 m 5 6.13 m 6.120 m 6.12 m 6.08 dd (15.3, 10.6) 6.12 m 6.07 dd (15.0, 10.5) 6.15 m 6 2.39 brtd (10.4, 5.8) 2.49 m 2.49 m 2.48 brtd (10.6, 6.0) 2.45 brtd (10.3, 6.3) 2.52 m 2.51 m 7 1.20 q (10.4) 1.23 brq (10.2) 1.26 brq (10.2) 1.44 brq (10.2) 1.20 d (10.3) 1.29 brq (10.3) 1.32 brq (10.2) 8 1.35 m 1.65 m 1.58 m 1.81 brdsext (9.0, 6.8) 1.36 m 1.65 m 1.18 m 9 a : 1.09 brq (11.9) b: 1.92 brd (12.6) a: 1.32 brtd (14.0, 2.3) b: 1.73 brdq (14.4, 2.3) a: 1.29 m b: 1.81 brdq (14.6, 3.0) a: 2.05 dd (14.5, 6.8) b: 2.57 dd (14.5, 6.8) a: 1.09 q (11.7) b: 1.93 m a: 1.30 m b: 1.72 brdq (14.1, 2.5) 3.17 brtd (10.1, 4.6) 10 3.70 brtt (10.9, 4.4) 4.14 brquint (2.3) 5.07 brquint (2.9) 3.70 m 4.04 brt (2.5) a: 1.40 brqd (12.0, 3.2) b: 2.04 m 11 a: 1.11 brq (10.8) b: 2.01 brd (11.9) a: 1.36 brtd (13.5, 2.1) b: 1.79 brdq (13.5, 2.2) a: 1.35 brtd (13.8, 2.6) b: 1.89 brdq (13.8, 2.9) a: 2.04 brt (14.9) b: 2.47 brd (14.9) a: 1.10 q (11.9) b: 2.01 brd (11.9) a: 1.36 td (13.5, 2.5) b: 1.78 brdq (13.5, 2.5) a: 1.19 m b: 1.77 m 12 1.79 brt (11.1) 2.27 brt (11.3) 2.16 m 2.33 m 1.80 brt (11.7) 2.28 brt (11.6) 1.79 m 13 5.25 s 5.20 brs 5.19 brs 5.26 brs 5.29 brs 5.25 brs 5.31 brs 15 2.53 brd (5.3) 2.52 brd (5.4) 2.53 brd (5.6) 2.62 brd (5.7) 2.57 brd (5.4) 2.56 brd (4.9) 2.56 brd (5.5) 17 5.22 brq (6.7) 5.21 brq (6.7) 5.21 brq (6.7) 5.25 brq (6.8) 5.41 brt (6.5) 5.38 brt (6.3) 5.41 brt (6.4) 18 1.62 d (6.7) 1.62 d (6.7) 1.61 d (6.7) 1.64 brd (6.8) a: 4.21 dd (12.6, 6.8) b: 4.24 dd (12.6, 6.8) a: 4.14 dd (13.0, 6.1) b: 4.17 dd (13.0, 6.6) a: 4.20 dd (12.8, 6.6) b: 4.25 dd (12.8, 6.6) 19 0.91 d (6.3) 0.86 d (6.3) 0.86 d (6.4) 0.93 d (6.6) 0.91 d (6.1) 0.89 d (6.4) 1.03 d (6.2) 20 1.50 brs 1.50 s 1.50 brs 1.54 brs 1.53 s 1.54 s 1.53 s 21 1.58 brs 1.58 s 1.57 s 1.61 brs 1.65 s 1.66 s 1.66 s 23 2.05 s a δ
Table 2. 13C NMR Spectroscopic Data (CDCl3) for Compounds 1−13. Position 1a 2a 3b 4a 5a 6a 7a 8b 9b 10b 11b 12b 13b 1 171.6, C 171.3 170.8 171.4 169.4 170.6 170.9 170.2 172.2 n.d. 171.2 172.3 172.0 2 117.9, CH 117.8 117.5 118.8 117.6 115.6 118.3 117.8 120.2 n.d. 119.6 118.7 118.6 3 147.1, CH 147.1 147.2 146.4 146.4 144.8 146.8 147.4 145.5 n.d. 146 .4 146 5 146.5 4 125.7, CH 125.7 125.7 127.2 125.9 127.8 126.2 126.0 127.6 128.2 126.2 125.9 126.0 5 152.2, CH 152.5 152.5 149.2 150.8 150.5 151.2 152.4 148.1 148.2 150.7 151.0 150.9 6 50.0, CH 50.0 50.0 49.6 49.3 51.5 50.3 50.4 49.0 49.5 49.7 49.8 49.8 7 44.9, CH 45.7 45.3 43.5 44.7 47.0 43.8 46.0 43.5 43.9 45.1 43.5 43.3 8 34.9, CH 30.6 31.3 34.4 34.7 32.1 43.8 36.5 34.5 34.7 35.2 43.5 40.2 9 46.9, CH2 44.1 40.8 48.8 46.6 45.2 76.4, CH 38.2 48.9 49.1 47.0 76.1, CH 78.1, CH 10 69.8, CH 66.8 70.1 211.7, C 69.1 67.6 35.4, CH2 26.6, CH2 212.4, C 211.8, C 69.8 35.0, CH2 31.2 CH2 11 42.3, CH2 40.1 37.0 46.8 42.2 41.2 31.0 34.0, CH2 46.7 47.2 42.4 30.7 30.3 12 40.9, CH 35.8 36.6 39.9 40.6 37.3 42.9 43.4 39.7 40.2 41.1 42.4 42.2 13 127.2, CH 127.6 127.1 125.1 127.7 129.8 128.3 129.5 125.8 126.4 128.3 128.2 127.7 14 134.5, C 134.3 134.5 133.3 133.4 134.7 133.4 132.9 137.7 135.9 133.4 132.9 129.1 15 56.7, CH 56.5 56.5 55.7 56.2 57.9 56.3 56.7 55.4 56.0 56.4 56.0 55.9 16 133.5, C 133.7 133.6 135.5 136.8 137.7 137.3 137.7 136.7 139.6 139.8 139.6 136.9 17 124.3, CH 124.2 124.3 124.5 129.2 130.6 129.4 129.4 129.1 124.9 124.6 123.9 129.1 18 13.5, CH3 13.6 13.6 13.6 59.2, CH2 59.8, CH2 59.5, CH2 59.7, CH2 59.0, CH2 61.5, CH2 61.3, CH2 61.2, CH2 59.1, CH2 19 22.8, CH3 22.8 22.7 23.4 22.4 23.6 18.2 23.6 23.4 23.8, 23.0 18.0 17.8 20 21.3, CH3 21.4 21.4 21.4 20.9 22.0 21.3 21.6 21.6 21.8 21.6 21.3 21.32 21 17.6, CH3 17.7 17.6 17.9 18.0 19.0 18.4 18.3 n.d. 18.8 18.3 18.2 18.1 22 170.6, C 171.5 171.2 171.3 171.0 23 21.4, CH3 21.3 21.2 21.0 21.29
Unless otherwise specified, the carbon type was identical to that of compound 1. a δ
The relative configuration was established by a careful analysis of the 1H-1H coupling
constants and the NOESY spectrum. The sequence of NOE correlations between protons H-15,
H-6, H-12, H-10, H-9b and H-8 suggested that these protons were on the same side of the
molecule (Figure 2). The relative configuration at C-10 was confirmed by the coupling constants
of H-9a (11.9 Hz) and H-11a (J = 10.8 Hz) with H-10. These values suggested that the three
protons were in an axial position. The large couplings (≈ 10.4 Hz) between H-7 and its vicinal
protons H-6, H-8 and H-12 indicated that all these protons were axial, therefore suggesting a
trans decaline skeleton. Finally, the strong NOE correlation between H-7 and H-21 further
confirmed the configuration at C-15. Interestingly, carbon C-21 was almost never detected in 13C NMR spectra of compounds 1−13. Steric hindrance most likely decreased its relaxation rate. Compound 1 was named carneic acid C.
Figure 2. Key NOESY correlations of carneic acid C (1).
Compound 2 had the same molecular formula as 1, as evidenced by the protonated
molecular ion detected by HRESIMS. The 1H and 13C NMR spectroscopic data (Tables 1 and 2)
were almost identical to those of 1. Only slight differences were observed for the chemical shifts
of C-10 and H-10 (δC 69.8, δH 3.70 for 1 and δC 66.8, δH 4.14 for 2). The HMBC and COSY
spectra did not show any noticeable differences from those of 1, but the coupling pattern of
proton H-10 was significantly different [brquint (J = 2.3 Hz) in 2 compared to a brtt (J = 10.9,
4.4 Hz) in 1]. In addition, NOE correlations between H-10 and H-9a, H-9b, H-11a and H-11b
further suggested an equatorial position of H-10 in compound 2, which was named carneic acid
D.
A [M+H]+ ion peak at m/z 373.2384 was detected in the HRESIMS spectrum of
compound 3, which suggested a molecular formula of C23H32O4. The molecular formula
23 and H-10 correlating with C-22 at δC 170.9. ROESY correlations revealed that 6, 8,
H-11b and H-12 were on the same side of the molecule. The H-10 signal splitting pattern (brquint,
J = 2.9 Hz) and ROESY correlations between H-10 and H-9a, H-9b, H-11a, and H-11b revealed
an equatorial position of H-10. This compound was named carneic acid E.
A [M+H]+ ion peak at m/z 329.2114 was detected in the HRESIMS spectrum of
compound 4, which suggested a molecular formula of C21H28O3. The 1H and 13C NMR spectra
(Tables 1 and 2) were almost identical to those of 1, except for C-10, which turned out to be a
carbonyl group (δC 211.7). This compound was named carneic acid F.
Compounds 5 and 6 had the same molecular formula as indicated by HRESIMS.
Compound 5 showed an ion at m/z 329.2117 [M+H–H2O]+ and compound 6 an ion at m/z
329.2103 [M+H–H2O]+. Their molecular formula (C21H30O4) and their 13C and 1H NMR spectra
(Tables 1 and 2) suggested the same carbon skeleton as 1 and 2, but with an additional hydroxy
group in C-18 (δC-18 59.2,δH-18 4.21 for 5, and δC-18 59.8,δH-18 4.14 for 6). The position of the
hydroxy group was confirmed by the HMBC correlations H-17/C-18 and H-21/C-18. The two
compounds differed by their relative configuration of C-10, H-10 being axial in 5 and equatorial
in 6. These compounds were named carneic acid G (5) and H (6).
Compound 7 had the same molecular formula as 5 and 6. Its HRESIMS indicated a
protonated and dehydrated molecule at m/z 329.2124 [M+H–H2O]+. The 1H and 13C NMR
spectroscopic data (Tables 1 and 2) were almost identical to those of 5 and 6, except for C-9 (δC
76.4, δH 3.17) and C-10 (δC 35.4, δH 1.40, 2.04). Chemical shifts suggested that 7 was
hydroxylated at C-9 rather than at C-10. The relative configuration was determined by analysis
the same side of the molecule, and correlations between H-6, H-12, and H-15 indicated that these
protons were on the other side of the molecule. The large H-8–H-9 coupling also confirmed the
equatorial orientation of the hydroxy group in C-9. This compound was named carneic acid I.
Compound 8 had the molecular formula C21H30O3, as evidenced by the protonated,
dehydrated ion at m/z 313.2168 [M+H–H2O]+ detected in HRESIMS. Comparison of the 1H and 13
C NMR spectroscopic data with that of 7 (Tables 1-3) revealed that 8 was not hydroxylated in
C-9. The left cyclohexane was fully aliphatic, and the compound was hydroxylated at C-18. This
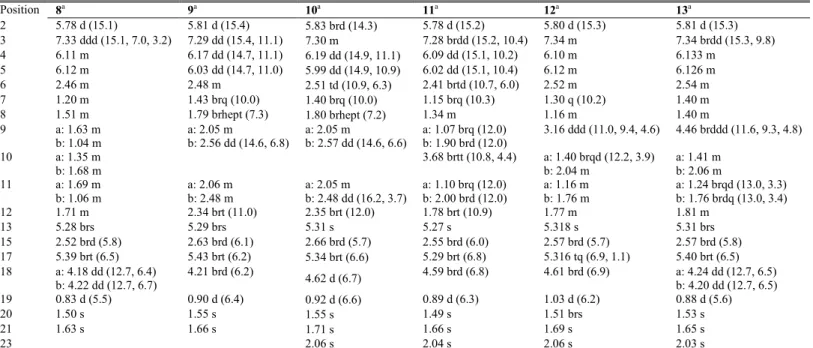
Table 3. 1H NMR Spectroscopic Data (CDCl3) for Compounds 8−13. Position 8a 9a 10a 11a 12a 13a 2 5.78 d (15.1) 5.81 d (15.4) 5.83 brd (14.3) 5.78 d (15.2) 5.80 d (15.3) 5.81 d (15.3) 3 7.33 ddd (15.1, 7.0, 3.2) 7.29 dd (15.4, 11.1) 7.30 m 7.28 brdd (15.2, 10.4) 7.34 m 7.34 brdd (15.3, 9.8) 4 6.11 m 6.17 dd (14.7, 11.1) 6.19 dd (14.9, 11.1) 6.09 dd (15.1, 10.2) 6.10 m 6.133 m 5 6.12 m 6.03 dd (14.7, 11.0) 5.99 dd (14.9, 10.9) 6.02 dd (15.1, 10.4) 6.12 m 6.126 m 6 2.46 m 2.48 m 2.51 td (10.9, 6.3) 2.41 brtd (10.7, 6.0) 2.52 m 2.54 m 7 1.20 m 1.43 brq (10.0) 1.40 brq (10.0) 1.15 brq (10.3) 1.30 q (10.2) 1.40 m 8 1.51 m 1.79 brhept (7.3) 1.80 brhept (7.2) 1.34 m 1.16 m 1.40 m 9 a: 1.63 m b: 1.04 m a: 2.05 m b: 2.56 dd (14.6, 6.8) a: 2.05 m b: 2.57 dd (14.6, 6.6) a: 1.07 brq (12.0) b: 1.90 brd (12.0) 3.16 ddd (11.0, 9.4, 4.6) 4.46 brddd (11.6, 9.3, 4.8) 10 a: 1.35 m b: 1.68 m 3.68 brtt (10.8, 4.4) a: 1.40 brqd (12.2, 3.9) b: 2.04 m a: 1.41 m b: 2.06 m 11 a: 1.69 m b: 1.06 m a: 2.06 m b: 2.48 m a: 2.05 m b: 2.48 dd (16.2, 3.7) a: 1.10 brq (12.0) b: 2.00 brd (12.0) a: 1.16 m b: 1.76 m a: 1.24 brqd (13.0, 3.3) b: 1.76 brdq (13.0, 3.4) 12 1.71 m 2.34 brt (11.0) 2.35 brt (12.0) 1.78 brt (10.9) 1.77 m 1.81 m 13 5.28 brs 5.29 brs 5.31 s 5.27 s 5.318 s 5.31 brs 15 2.52 brd (5.8) 2.63 brd (6.1) 2.66 brd (5.7) 2.55 brd (6.0) 2.57 brd (5.7) 2.57 brd (5.8) 17 5.39 brt (6.5) 5.43 brt (6.2) 5.34 brt (6.6) 5.29 brt (6.8) 5.316 tq (6.9, 1.1) 5.40 brt (6.5) 18 a: 4.18 dd (12.7, 6.4) b: 4.22 dd (12.7, 6.7) 4.21 brd (6.2) 4.62 d (6.7) 4.59 brd (6.8) 4.61 brd (6.9) a: 4.24 dd (12.7, 6.5) b: 4.20 dd (12.7, 6.5) 19 0.83 d (5.5) 0.90 d (6.4) 0.92 d (6.6) 0.89 d (6.3) 1.03 d (6.2) 0.88 d (5.6) 20 1.50 s 1.55 s 1.55 s 1.49 s 1.51 brs 1.53 s 21 1.63 s 1.66 s 1.71 s 1.66 s 1.69 s 1.65 s 23 2.06 s 2.04 s 2.06 s 2.03 s a δ
Compound 9 had the molecular formula C21H28O4, as evidenced by the [M+H–H2O]+ ion
at m/z 327.1955 detected by HRESIMS. The 1H and 13C NMR data were almost identical to
those of 4 (Tables 2 and 3). The only significant difference was the chemical shifts in position 18
(δC 13.6, δH 1.64 for 4 and δC 59.0, δH 4.21 for 9). The molecular formula, 13C NMR and 1H NMR
spectra suggested the same carbon skeleton as for 4, with an additional hydroxy group in C-18.
Compound 9 was named carneic acid K.
The HRESIMS of compound 10 suggested a molecular formula of C23H30O5. The 1H and 13
C NMR spectroscopic data were almost identical to those of 9 (Tables 2 and 3), in which the
hydroxy group in C-18 had been acetylated [δC 61.5, δH 4.62 (d, J = 6.7 Hz)]. This compound
was named carneic acid L.
Compound 11 has the molecular formula C23H32O5, as evidenced by the [M+H–H2O]+
ion at m/z 371.2224 detected in HRESIMS. The 1H and 13C NMR data compared to those of 10
(Tables 2 and 3) revealed the presence of a hydroxy group in C-10 (δC 69.8, δH 3.68). The latter
was equatorial (and proton H-10 axial), as evidenced by ROE correlations between H-10 axial
and both H-8 and H-12. This compound was named carneic acid M.
Compounds 12 and 13 both had molecular formulas identical to that of compound 11,
i.e., C23H32O5, as evidenced by the [M+H–H2O]+ ions at m/z 371.2227 for 12 and 371.2212 for
13. The 1H and 13C NMR spectroscopic data were almost identical to those of 11 (Tables 2 and
molecule. In 13, H-9 correlated with H-10a and H-10b, which is typical of an equatorial position.
These compounds were named carneic acids N (12) and O (13).
To determine their viral inhibition potential, compounds 1−13 were evaluated on a DENV RNA-dependent RNA polymerase assay (Table 4). The IC50 values of the most active
compounds (> 75 % inhibition at 50 µg/mL) were calculated. These compounds were also
evaluated on Zika-NS5 (Table 4).
Table 4. Antiviral Activity and Cytotoxicity of Compounds 1−13.
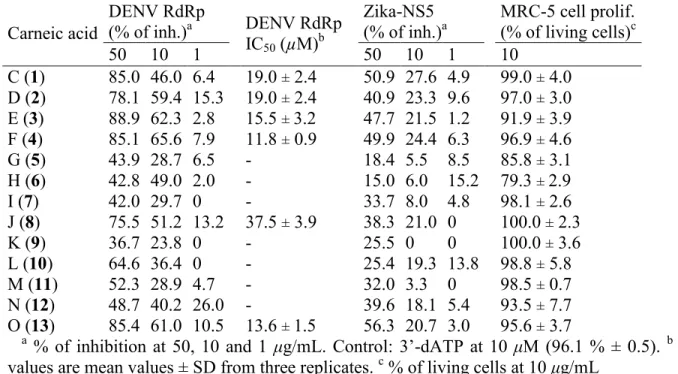
Carneic acid DENV RdRp (% of inh.)a DENV RdRp IC50 (µM)b Zika-NS5 (% of inh.)a MRC-5 cell prolif. (% of living cells)c 50 10 1 50 10 1 10 C (1) 85.0 46.0 6.4 19.0 ± 2.4 50.9 27.6 4.9 99.0 ± 4.0 D (2) 78.1 59.4 15.3 19.0 ± 2.4 40.9 23.3 9.6 97.0 ± 3.0 E (3) 88.9 62.3 2.8 15.5 ± 3.2 47.7 21.5 1.2 91.9 ± 3.9 F (4) 85.1 65.6 7.9 11.8 ± 0.9 49.9 24.4 6.3 96.9 ± 4.6 G (5) 43.9 28.7 6.5 - 18.4 5.5 8.5 85.8 ± 3.1 H (6) 42.8 49.0 2.0 - 15.0 6.0 15.2 79.3 ± 2.9 I (7) 42.0 29.7 0 - 33.7 8.0 4.8 98.1 ± 2.6 J (8) 75.5 51.2 13.2 37.5 ± 3.9 38.3 21.0 0 100.0 ± 2.3 K (9) 36.7 23.8 0 - 25.5 0 0 100.0 ± 3.6 L (10) 64.6 36.4 0 - 25.4 19.3 13.8 98.8 ± 5.8 M (11) 52.3 28.9 4.7 - 32.0 3.3 0 98.5 ± 0.7 N (12) 48.7 40.2 26.0 - 39.6 18.1 5.4 93.5 ± 7.7 O (13) 85.4 61.0 10.5 13.6 ± 1.5 56.3 20.7 3.0 95.6 ± 3.7
a % of inhibition at 50, 10 and 1 μg/mL. Control: 3’-dATP at 10 μM (96.1 % ± 0.5). b IC 50
values are mean values ± SD from three replicates. c % of living cells at 10 μg/mL
None of the tested compounds showed cytotoxicity. The Zika bioassay did not reveal
significant inhibition of NS5. Only carneic acids C (1), D (2), E (3), F (4) and O (13) exhibited
significant DENV-2 polymerase inhibition activity, with IC50 values in the 10.0 - 20.0 μM range,
compounds 4 and 13 being the most active of the series. All other compounds were considered
Some very interesting observations can be summarized from the DENV-2 polymerase
bioassay results. In the carneic acid series (1–13), it is suggested that the 1-methypropenyl unit in
position C-15 plays an important role in the DENV-2 enzyme inhibiting activity. When this
subunit is oxidized at C-18, the compounds are less active (1 vs 5 and 11, 2 vs 6, 4 vs 9 and 10).
The anti-DENV2 enzyme activities of compounds 1–4 are almost identical, indicating that the
oxidation pattern on the left ring (compounds 1–4) does not influence the biological activity.
Finally, compounds 5–13 all possess a 3-hydroxy-1-methylpropenyl unit or a
3-acetoxy-1-methylpropenyl unit at C-15 but are differently substituted on the decaline left ring. In this series,
since only compound 13 showed significant inhibitory activity on DENV2 polymerase, it can be
inferred that a -OH group in C-9 can promote enzyme inhibitory activity. Unfortunately, it was not possible at this stage to isolate a carneic acid bearing both a -OH group in C-9 and a 1-methypropenyl side chain in C-15.
The previous study on carneic acids from Hypoxylon carneum described that carneic
acids A and B showed weak antibacterial and moderate antifungal activities.12 The closest
structural analogue of the carneic acids is phomopsidin, an antibiotic cis-decaline isolated from a
marine Phomopsis sp. that was shown to inhibit microtubule assembly.14,15 Two other
structurally related compounds have been isolated from Fusarium (Fusarielins)16 and Phoma sp.
(MK8383).15 Our work is the first to demonstrate antiviral activity within this class of
CDCl3, MeOH or Pyridine on a Bruker 600 MHz or 500 MHz spectrometer equipped with a
1-mm inverse detection probe.
UHPLC was performed with a Waters Acquity UPLC system equipped with a Waters Acquity PDA detector. The wavelength range was between 210 to 410 nm. Separation was achieved on a Kromasil BEH C18 column (1.7 μm, 2.1 mm × 50 mm) at a flow rate of 0.6
mL/min. Elution was conducted with a H2O–acetonitrile (ACN) gradient as follows: 95:5 to
0:100 in 5.5 min. The UPLC system was coupled to a Waters LCT Premier XE mass spectrometer equipped with an electrospray ionization source. The ionization was carried out in positive mode in the 80-1500 m/z range. The ACN used for HPLC and UHPLC chromatography was LC-MS grade (Fisher Scientific, Illkirch, FR). Deionized water was obtained from a Millipore (Bedford, USA) Milli-Q purification system. For all HPLC and UHPLC analyses, 0.1 % formic acid was added to ACN and water.
Flash chromatography was performed on a Grace Reveleris system with dual UV and
ELSD detection equipped with a Reveleris 40 g silica C18 cartridge. For purification of fraction 6,
normal flash chromatography was used (Puriflash 12 g silica cartridge). Effluents were
monitored at 254 and 280 nm. H2O, ACN, dichloromethane (DCM) and tetrahydrofuran (THF)
were used for Flash chromatography. Thin-layer chromatography (TLC) was conducted on 60 A
F254 Merck plates, visualized using UV detection, and sprayed with a 1 % solution of vanillin in
concentrated sulfuric acid. Thermo Kromasil analytical and preparative C18 columns (250 × 4.6
mm and 250 × 21.2 mm, 5 μm) were used for HPLC separations using a Waters autopurification
system equipped with a sample manager (Waters 2767), a column fluidics organizer, a binary
pump (Waters 2525), a UV-vis diode array detector (190-600 nm, Waters 2996), and a Polymer
analysis and 21 mL/min for preparative HPLC analysis, using a gradient of H2O mixed with an
increasing proportion of ACN. Both solvents were modified with 0.1 % formic acid.
Plant Material. The leaves and bark of D. carbonaria were collected in October 2013 in
French Guiana (Saint Elie). The species was identified by Dr. V. Eparvier. A voucher specimen
was deposited in the Cayenne Herbarium (CAYVE18).
Isolation, Identification and Extraction of Endophytes. The general procedures
adopted for isolation and identification of the endophytic microorganisms followed the
methodology described by Casella et al.6 Thirty-eight fungal strains were isolated from D.
carbonaria leaves and bark. All strains were sequenced externally by BACTUP-France for
identification. The fungal rDNA sequences obtained were aligned with DNA sequences from
GenBank, NCBI (http://www.ncbi.nlm.nih.gov/genbank, consulted in July 2015) for
identification. The sequence of the endophyte Phomopsis sp. SNB-LAP1-7-32 was deposited in
GenBank with the accession number KU977311.
Large-scale Cultivation and Extraction of SNB-LAP1-7-32. Phomopsis sp. was
cultivated on solid PDA medium at 26 °C for 15 d on 482 14-cm-diameter Petri dishes (total
36.9 m2). The contents of the Petri dishes were cut into small pieces, transferred into a large
container, and macerated with EtOAc 3 times for 24 h. After each maceration, the organic
solvent was collected by filtration. The combined organic phases were washed with water in a
Isolation of Compounds from Phomopsis sp. The extract (3.4 g) was purified by flash
chromatography with a gradient of H2O–ACN (95:5 - 80:20 - 50:50 - 20:80 - 0:100), followed by
ACN–THF (50:50, and 100:0) at 40 mL/min. Eight fractions were gathered based on their TLC
profiles and were separated with preparative HPLC (flow rate 21 mL/min).
Three carneic acids were isolated from fraction V (160.2 mg) by prep-HPLC using a
gradient of H2O–ACN (70:30 to 0:100 in 70 min): carneic acid G (5) (2.4 mg, tR = 11.9 min),
carneic acid H (6) (1.2 mg, tR = 12.1 min) and carneic acid I (7) (3.7 mg, tR = 14.8 min). Fraction
VI (139.6 mg) was separated by normal flash chromatography into 8 subfractions. Subfraction 4
(100.6 mg) was purified by prep-HPLC using a gradient of H2O–ACN (50:50 to 0:100 in 30
min). Two compounds were isolated: carneic acid L (10) (0.9 mg, tR = 9.2 min) and carneic acid
F (4) (1.5 mg, tR = 13.3 min). Subfraction 5 (100.6 mg), purified by prep-HPLC eluted with H2O–
ACN 45:55, yielded carneic acids K (9) (0.9 mg, tR = 4.7 min), M (11) (0.7 mg, tR = 6.4 min), N
(12) (1.6 mg, tR = 10.4 min), C (1) (2.6 mg, tR = 11.1 min), O (13) (1.3 mg, tR = 12.5 min), D (2)
(1.6 mg, tR = 15.4 min) and J (8) (0.5 mg, tR = 15.7 min). Fraction VII (139.6 mg), purified by
prep-HPLC with a gradient of H2O–ACN (40:60 to 0:100 in 40 min), allowed isolation of
carneic acid E (3) (0.3 mg, tR = 7.3 min).
Carneic acid C (1): [α]25D –595.0 (c 0.1, CDCl3); UV (MeOH) λmax (log ε) 201 (5.18) nm; IR
(CDCl3) γmax 3369.99, 1689.63, 1635.63, 1250.33, 1007.75 cm-1; 1H and 13C NMR data in Tables
1 and 2; HRMS m/z 331.2289 [M+H]+ (calcd. for C21H31O3+, 331.2268).
Carneic acid D (2): [α]25D –279.0 (c 0.1, CDCl3); UV (MeOH) λmax (log ε) 201 (4.71), 261 (4.37)
nm; IR (CDCl3) γmax 3384.94, 1690.63, 1636.20, 1253.29, 1009.52 cm-1; 1H and 13C NMR data
Carneic acid E (3): [α]25D –46.0 (c 0.05, CDCl3); 1H and 13C NMR data in Tables 1 and 2;
HRMS m/z 373.2384 [M+H]+ (calcd. for C23H33O4+, 373.2373).
Carneic acid F (4): [α]25D –147.0 (c 0.1, CDCl3); 1H and 13C NMR data in Tables 1 and 2;
HRMS m/z 329.2114 [M+H]+ (calcd. for C21H29O3+, 329.2111).
Carneic acid G (5): [α]25D –5.0 (c 0.1, CDCl3); 1H and 13C NMR data in Tables 1 and 2; HRMS
m/z 329.2117 [M+H–H2O]+ (calcd. for C21H29O3+, 329.2111).
Carneic acid H (6): [α]25D –12.0 (c 0.1, CDCl3); 1H and 13C NMR data in Tables 1 and 2; HRMS
m/z 329.2103 [M+H–H2O]+ (calcd. for C21H29O3+, 329.2111).
Carneic acid I (7): [α]25D –122.0 (c 0.1, CDCl3); UV (MeOH) λmax (log ε) 201 (4.51), 260 (4.04)
nm; IR (CDCl3) γmax 3371.65, 1685.80, 1636.75, 1258.04, 1012.79 cm-1; 1H and 13C NMR data
in Tables 1 and 2; HRMS m/z 329.2124 [M+H–H2O]+ (calcd. for C21H29O3+, 329.2111).
Carneic acid J (8): [α]25D –38.0 (c 0.1, CDCl3); 1H and 13C NMR data in Tables 3 and 2; HRMS
m/z 313.2168 [M+H–H2O]+ (calcd. for C21H29O2+, 313.2162).
Carneic acid K (9): [α]25D –206.0 (c 0.1, CDCl3); IR (CDCl3) γmax 1702.74, 1640.21, 1393.95,
1260.53, 1066.15 cm-1; 1H and 13C NMR data in Tables 3 and 2; HRMS m/z 327.1955 [M+H–
H2O]+ (calcd. for C21H27O3+, 327.1955 ).
Carneic acid M (11): [α]25D –86.0 (c 0.1, CDCl3); 1H and 13C NMR data in Tables 3 and 2;
HRMS m/z 371.2224 [M+H–H2O]+ (calcd. for C23H31O4+, 371.2217).
Carneic acid N (12): [α]25D –81.0 (c 0.1, CDCl3); 1H and 13C NMR data in Tables 3 and 2;
HRMS m/z 371.2227 [M+H–H2O]+ (calcd. for C23H31O4+, 371.2217).
Carneic acid O (13): [α]25D –112.0 (c 0.1, CDCl3); 1H and 13C NMR data in Tables 3 and 2;
HRMS m/z 371.2212 [M+H–H2O]+ (calcd. for C23H31O4+, 371.2217).
Viral Polymerase Assays. Fractions and pure compounds from Phomopsis sp. were
diluted in DMSO 100 % at 1 mg/mL and tested on a DENV RNA-dependent RNA polymerase assay (DENV RdRp assay). The DENV RdRp bioassay has been described previously.17
Pure compounds from Phomopsis sp. were also evaluated against Zika virus. All samples were diluted in DMSO 100 % at 1 mg/mL and tested in a Zika-NS5 assay by measurement of the relative polymerase activity. The compound concentration leading to 50 % inhibition of Zika NS5-mediated RNA synthesis was determined in reaction buffer (50 mM HEPES pH 8.0, 10 mM KCl, 2 mM MnCl2, 2 mM MgCl2, 10 mM DTT) containing 100 nM of homopolymeric uridine
RNA template, 40 nM of Zika NS5 and 7 concentrations of compound. Five ranges of inhibitor were available (0.01 to 5 µM / 0,1 to 50 µM / 0,5 to 50 µM / 1 to 100 µM / 5 to 400 µM) (Table 5). Reactions were conducted in a 40-µL volume on a 96-well Nunc plate. All experiments were robotized by using a BioMek 3000 automate (Beckman). A volume of 2 µL of each diluted compound in 100 % DMSO was added to plate wells to the chosen concentration (5 % DMSO final concentration). For each assay, the enzyme mix was then distributed in the plate wells. Reactions were then started by the addition of the nucleotide mix (100 µM ATP) and were
incubated at 30 °C for 10 min. Reaction assays were stopped by the addition of 20 µl of EDTA 100 mM.
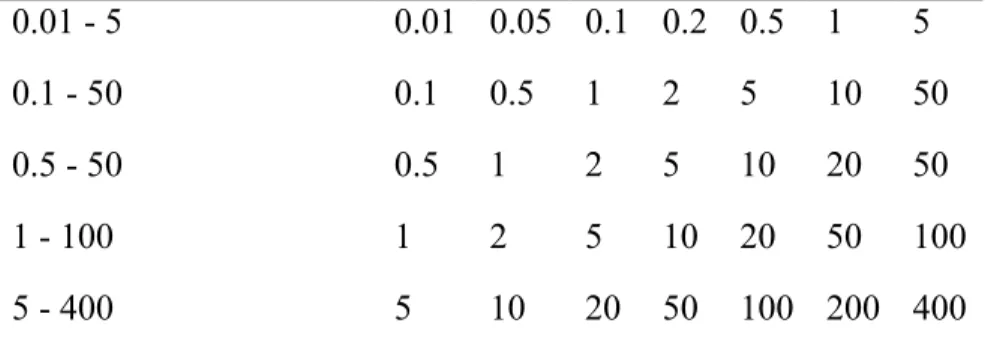
Table 5. Range of Inhibitor and Concentrations in the IC50 Assay.
Range of inhibitor (µM) Concentrations of inhibitor (µM) 0.01 - 5 0.01 0.05 0.1 0.2 0.5 1 5 0.1 - 50 0.1 0.5 1 2 5 10 50 0.5 - 50 0.5 1 2 5 10 20 50 1 - 100 1 2 5 10 20 50 100 5 - 400 5 10 20 50 100 200 400
Negative and positive controls consisted of a reaction mix with 5 % DMSO final concentration or 100 mM EDTA, respectively, in place of the compound.
Reaction mixes were then transferred to Greiner plate using a Biomek NX automate (Beckman). Picogreen® fluorescent reagent from Molecular Probes was diluted to 1/800° in TE buffer according the manufacturer’s recommendation, and 60 µl of reagent was distributed into each well of the Greiner plate. The plate was incubated for 5 min in the dark at room
temperature, and the fluorescence signal was then read at 480 nm (excitation) and 530 nm (emission) using a TecanSafire2. IC50 was determined using the equation % of active enzyme =
100 / (1 + (I)2 / IC50), where I is the concentration of inhibitor and 100 % of activity is the
fluorescence intensity without inhibitor. For each value, the results were obtained in triplicate in a single experiment.
37 °C in a humidified atmosphere containing 5 % CO2. Living cells were determined by an MTS
assay according to the manufacturer’s instructions (Promega, Madison, WI, USA). Briefly, the cells were seeded in 96-well plates (2.5 × 10³ cells/well) containing 200 μl of growth medium.
After 24 h of culture, the cells were treated with the tested compounds at 10 μM final
concentrations. After 72 h of incubation, 40 μl of resazurin was added 2 h before recording the absorbance at 490 nm with a spectrophotometric plate reader. The percent of living cells was calculated from three experiments.
ASSOCIATED CONTENT
The Supporting Information is available free of charge on the ACS Publications website at DOI: Fractions antiviral activity and NMR (1H, COSY, HSQC, HMBC, ROESY or NOESY and 13C)
and mass spectra for compounds 1−13 (DOCX). The authors declare no competing financial interests. AUTHOR INFORMATION
Corresponding Authors
*Tel: +33169823085, E-mail address: [email protected] (M. Litaudon). *Tel: +33430192476, E-mail address: [email protected] (D. Stien).
Author Contributions
This manuscript was written with contributions from all authors. All authors have given approval of the final version of the manuscript.
This work has benefited from an “Investissement d'Avenir” grant managed by Agence Nationale de la Recherche (CEBA, ref. ANR-10-LABX-25-01). We would like to express our appreciation
to J.-F. Gallard, who performed NMR experiments.
REFERENCES
(1) Petrini, O. Fungal Endophytes of Tree Leaves. In Microbial Ecology of Leaves; Andrews, J. H., Hirano, S. S., Eds.; Springer: New York, NY, 1991; pp 179–197.
(2) Stierle, A.; Strobel, G.; Stierle, D. Science 1993, 260, 214–216.
(3) Kharwar, R. N.; Verma, V. C.; Kumar, A.; Gond, S. K.; Harper, J. K.; Hess, W. M.; Lobkovosky, E.; Ma, C.; Ren, Y.; Strobel, G. A. Curr. Microbiol. 2009, 58, 233–238.
(4) Kellogg, J. J.; Todd, D. A.; Egan, J. M.; Raja, H. A.; Oberlies, N. H.; Kvalheim, O. M.; Cech, N. B. J. Nat. Prod. 2016, 79, 376–386.
(5) Barthélémy, M.; Elie, N.; Pellissier, L.; Wolfender, J.-L.; Stien, D.; Touboul, D.; Eparvier, V. Int. J. Mol. Sci. 2019, 20, 2006.
(6) Casella, T. M.; Eparvier, V.; Mandavid, H.; Bendelac, A.; Odonne, G.; Dayan, L.; Duplais, C.; Espindola, L. S.; Stien, D. Phytochemistry 2013, 96, 370–377.
(7) Mandavid, H.; Rodrigues, A. M. S.; Espíndola, L. S.; Eparvier, V.; Stien, D. J. Nat. Prod.
(9) Peyrat, L.-A.; Eparvier, V.; Eydoux, C.; Guillemot, J.-C.; Stien, D.; Litaudon, M.
Fitoterapia 2016, 112, 9–15.
(10) Peyrat, L.-A.; Eparvier, V.; Eydoux, C.; Guillemot, J.-C.; Litaudon, M.; Stien, D. Chem.
Biodivers. 2017, 14, e1600171.
(11) Udayanga, D.; Liu, X.; Mckenzie, E. H. C.; Chukeatirote, E.; Bahkali, A. H. A.; Hyde, K. D. Fungal Divers. 2011, 50, 189–225.
(12) Quang, D. N.; Stadler, M.; Fournier, J.; Asakawa, Y. J. Nat. Prod. 2006, 69, 1198–1202. (13) Yamakoshi, S.; Hayashi, N.; Suzuki, T.; Nakada, M. Tetrahedron Lett. 2009, 50, 5372– 5375.
(14) Kobayashi, H.; Meguro, S.; Yoshimoto, T.; Namikoshi, M. Tetrahedron 2003, 59, 455– 459.
(15) Namikoshi, M.; Kobayashi, H.; Yoshimoto, T.; Meguro, S.; Akano, K. Chem. Pharm.
Bull. 2000, 48, 1452–1457.
(16) Kobayashi, H.; Sunaga, R.; Furihata, K.; Morisaki, N.; Iwasaki, S. J. Antibiot. 2012, 48, 42–52.
(17) Benmansour, F.; Eydoux, C.; Querat, G.; de Lamballerie, X.; Canard, B.; Alvarez, K.; Guillemot, J.-C.; Barral, K. Eur. J. Med. Chem. 2016, 109, 146–156.