HAL Id: hal-02891748
https://hal.archives-ouvertes.fr/hal-02891748
Submitted on 7 Jul 2020HAL is a multi-disciplinary open access archive for the deposit and dissemination of sci-entific research documents, whether they are pub-lished or not. The documents may come from teaching and research institutions in France or abroad, or from public or private research centers.
L’archive ouverte pluridisciplinaire HAL, est destinée au dépôt et à la diffusion de documents scientifiques de niveau recherche, publiés ou non, émanant des établissements d’enseignement et de recherche français ou étrangers, des laboratoires publics ou privés.
Training Set Class Distribution Analysis for Deep
Learning Model - Application to Cancer Detection
Ismat Ara Reshma, Margot Gaspard, Camille Franchet, Pierre Brousset,
Emmanuel Faure, Sonia Mejbri, Josiane Mothe
To cite this version:
Ismat Ara Reshma, Margot Gaspard, Camille Franchet, Pierre Brousset, Emmanuel Faure, et al.. Training Set Class Distribution Analysis for Deep Learning Model - Application to Cancer Detection. 1st International Conference on Advances in Signal Processing and Artificial Intelligence (ASPAI 2019), Mar 2019, Barcelona, Spain. pp.123-127. �hal-02891748�
Any correspondence concerning this service should be sent
to the repository administrator:
[email protected]
This is an author’s version published in:
http://oatao.univ-toulouse.fr/26163
Open Archive Toulouse Archive Ouverte
OATAO is an open access repository that collects the work of Toulouse
researchers and makes it freely available over the web where possible
To cite this version: Reshma, Ismat-Ara and Gaspard, Margot and
Franchet, Camille and Brousset, Pierre and Faure, Emmanuel and
Mejbri, Sonia and Mothe, Josiane Training Set Class Distribution
Analysis for Deep Learning Model - Application to Cancer Detection.
(2019) In: 1st International Conference on Advances in Signal
Processing and Artificial Intelligence (ASPAI 2019), 20 March 2019 -
22 March 2019 (Barcelona, Spain).
Training Set Class Distribution Analysis
for Deep Learning Model – Application to Cancer Detection
Ismat Ara Reshma1,2, Margot Gaspard3, Camille Franchet3, Pierre Brousset2,3, Emmanuel Faure1, Sonia Mejbri1,2, and Josiane Mothe1,2
1IRIT UMR5505 CNRS,118 Route de Narbonne,F-31062 TOULOUSE, France 2Univ. de Toulouse, TOULOUSE, France
3Univ. Cancer Institute Toulouse Oncopole, 1 avenue Irène Joliot-Curie, 31059 TOULOUSE, France E-mail: [email protected]
Summary: Deep learning models specifically CNNs have been used successfully in many tasks including medical image classification. CNN effectiveness depends on the availability of large training data set to train which is generally costly to obtain for new applications or new cases. However, there is a little concrete recommendation about training set creation. In this research, we analyze the impact of different class distributions in the training data to a CNN model. We consider the case of cancer detection task from histopathological images for cancer diagnosis and derive some useful hypotheses about the distribution of classes in the training data. We found that using all the training data leads to the best recall -precision trade-off, while training with a reduced number of examples from some classes, it is possible to inflect the model toward a desired accuracy on a given class.
Keywords: Medical information retrieval, Image segmentation and classification, Deep learning, Class-biased training.
1. Introduction
The huge success of deep learning models in visual recognition [1] [2] and specifically CNN, drove researchers to explore their use in computer-aided diagnosis system for cancer1 detection from histopathological or whole slide images (WSIs) [3] [4] [5]. This paper contributes to this research topic with the objective to help physicians to detect metastasis by providing them the image regions in which there is a high probability of cancer and the regions where there is no cancer. In that purpose, we employ segmentation (i.e. pixel classification) of the WSIs. Segmentation facilitates readable separation of each class and eases image analysis [6].
One of the specificities of CNN is that they need a lot of training examples [7]. However, when dealing with biomedical images, precise annotation process needs both expertise and time. As a result, the image data sets that can be built are small. The problem of how to distribute the examples from the different classes to learn is not well studied.
In this paper, we tackle the challenge of deciding which types of examples would be needed to obtain the expected prediction from the trained model. Indeed, when considering segmentation problems, the trained model can be very effective on one class and poorly performing on another. Would the results be different if one class is “over-represented”? Is it better to have about the same number of examples in each class? This paper aims at answering these questions, all related to the balanced/imbalanced nature of the training set [8]. There are some studies in the 1Throughout the paper, “cancer” and “metastasis” are interchangeably used.
literature that tackle this problem [8] [9] [10] [11] [12] as it has an adverse effect on classification accuracy.
Among the proposed methods to balance classes, the most straightforward and commonly practiced method is the oversampling of the minority class [8] [9]. However, it can lead to overfitting [11] and concrete studies on the effects are lacking. To address the class-imbalance in metastasis detection the existing methods usually adopt random sampling to select an equal number of positive and negative examples [4] [5] and thus generate a balanced training set. However, there is no analysis to answer whether this balanced distribution is the optimal one for this task. Kubat et al. [12] suggested downsampling.
In this paper, we consider both balanced and class-biased distributions of the training set and analyze the selection impact on the model accuracy. The result could serve for deciding which examples should be first added in the training set when there are costly to add. We study the impact on the model of a training biased by an over-represented class (what we call a class-biased training). We run a series of experiments in which we train the model in one hand with an over-representation of the cancer class and on the other hand with an over-representation of the non-cancer class. We also consider balanced sets. We found that balanced data not always lead to the best result and suggest solutions to optimize the model toward a specific accuracy on a target class.
The rest of the paper is structured as follows: we first present related work. We then describe the experimental details with results. Finally, we conclude the paper with some future directions.
2. Related Work
During the last decades, several studies have been done to facilitate computer-aided diagnosis for metastasis detection from WSIs. Most of the methods used classical machine learning techniques [13]. Studies on utilizing deep learning on this topic are comparatively few and new. From 2015, Bejnordi et al. [3] are organizing a worldwide challenge named CAMELYON on this topic in which most of the participants use CNN-based methods. The winning team [4] utilized the 22 layers GoogleNet, employed rotation and random cropping for data augmentation and color normalization. Liu et al. [5] utilized the updated version of GoogleNet named Inception (V3) [14]. To avoid class-bias they selected normal and tumor classes with equal probability then extracted patch of that class from a WSI which was selected by uniformly at random; then it was followed by applying several data augmentation techniques including rotation, mirroring, and extensive color perturbation. Sonia M. et. al. [15] proposed a new data set for different types of breast cancer, and an end-to-end deep learning framework for multilabel tissue segmentation utilizing their data set, while network parameters were determined with a deep analysis.
One of the common problems in machine learning is imbalanced data. In the real world, the availability of some classes makes them the over-presented majority, while the scarcity of some classes makes them the under-presented minority. This imbalance of classes representation makes the classification task challenging for a classifier. A limited amount of studies on this topic is available in the literature, especially on deep learning perspective. Some studies suggest data level modification [16] [17], while other studies suggest network architecture level modification [10]. Buda et al. [8] present a comparative study of different methods. Oversampling of the minority class is the most prescribed solution [9] [8]. Kubat et al. [12] suggested downsampling.
To address the class-imbalance in metastasis detection task the existing methods usually adopt random sampling to select the equal number of positive and negative examples [4] [5]. However, comparative studies among the different distribution of classes in the training set are absence in this domain. In this paper, we consider this issue. The result could serve for deciding which examples should be first added in the training set when there are costly to add.
3. Experiments
3.1. Data Set and Setting
We use the “metastatic LN” data set from Toulouse Oncopole. The data set contains 61 WSIs (34 for training, 27 for test) of lymph nodes stained
with hematoxylin and eosin (H&E), for which an expert pathologist has provided the ground truth segmented masks. The masks are annotated with 3 classes: metastasis/cancer(C), lymph-node(¬C), and other(O). Class O can be either background or histological structures not included in the first two classes C and ¬C, such as adipose or fibrous tissue. Metastasis of 16 primary cancer types and organs have been included in the data set.
Although many other parameters may influence the results, in this research we focus on analyzing the impact of the training examples and the classes they belong to. Although, the WSIs are very large in size, here we utilize them by 8 times downsampling in size to save time and memory resource during analysis. However, the full resolution images will give better result [5]. As a network architecture of CNN, we select U-net [18]. We implement the U-net architecture using Keras [19] on the TensorFlow backend. In all the experiments, 20% of the training data is kept for validation. All data are normalized by scaling the pixel value from [0, 255] to [0.0, 1.0] by dividing 255. It makes the convergence of training faster [20]. We utilize Adam [21] as an optimizer. After empirical preliminary evaluation, we set the learning rate of Adam as 1e-05. We use the "categorical cross-entropy" (original U-net) as loss function.
We extract squared overlapping patches of dimension d2with stride d/2 pixels from each training WSI that correspond to our training examples; we use d=384 pixels and extract 127,898 patches. We use usual recall, precision, and F-measure to evaluate the model; however, rather than considering the pixel-level evaluation, we consider non-overlapping patches of dimension 5002 on the predicted test images’ masks and make a patch-based evaluation. We compute patch-based recall, precision, and F-measure for each test image separately, and finally, take the average result of 27 test images to evaluate the performance of models.
3.2. Experiment Design
The statistics in Table 1 depicts that most of the pixels (78%) in the training WSIs belong to the class O.
Table 1. Report on the average number (in million and percentage) of pixels of each class in the training and test
set.
Pixel class Mean in million Mean in % Training C 15.2 11 ¬C 14.6 11 O 107.4 78 Test C 20 14 ¬C 9.8 7 O 114.8 79
Since the class O is (i) over-represented, (ii) not the class the pathologists focus on, it imposes us to check the impacts of some other artificial distributions of classes in our training set. To create some other artificial distributions of classes, we need to separate the class examples. In that purpose, we define several patch categories based on the pixel classes they belong to. Throughout the paper, we use the term “class” to indicate pixel type, while, “category” to indicate patch type. The patches which pixels belong to 100% class O, we define them as patch category O. The remaining patches belong to class C, ¬C, and both C and ¬C with an optional presence (0.0 to 99.1%) of class O pixels. The details of each patch category in the training set are as follows:
- O (only other): 90,374 patches contain almost 100% class O pixels.
- C (metastasis/cancer): 15,328 patches contain pixels labeled with class C and optionally class O. - ¬C (lymph node): 17,274 patches contain pixels labeled with class ¬C and optionally class O.
- C&¬C (mixed): 4,922 patches contain pixels labeled with both class C and ¬C, and optionally class O.
These categories are used to design several experiments with different class distribution in the training set as follows:
· (All): done with all possible patches.
· (C&¬C): done with patches from the C&¬C category. Here, the three classes are balanced in terms of pixels, however, the number of training examples is fewer (4,922).
· (C, C&¬C): patches are from the C and C&¬C categories. By excluding the ¬C category, here we limit the presence of class ¬C. Thus the training set is class C biased.
· (¬C, C&¬C): patches are from the ¬C and C&¬C categories. This is the twin case of (C, C&¬C). The training set is class ¬C biased.
· (C, ¬C, C&¬C): patches categories C, ¬C, and C&¬C are used. Here, class C and ¬C pixels are almost balanced, however, class O pixels are downsampled compared to experiment (All) to make the all three classes pixels almost balanced.
3.3. Results
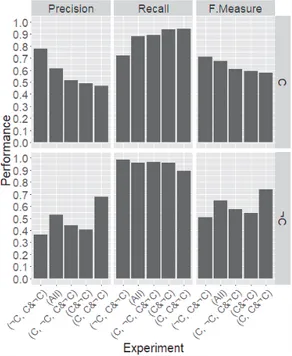
In Fig. 1 we report the results for both class C and class ¬C. The results are the average results computed from the results of 27 test WSIs. Since recall and precision varies in reverse order, it is important to report both. To evaluate the model performance by considering both recall-precision at the same time, we also report F-measure. Experiments are ordered according to the descending order of precision on class C.
From Fig. 1 we can see that recall is higher than precision for both classes; which implies that in this
domain most of the error comes from false positive2 rather than false negative3. Another noticeable thing is, unlike it has been reported in [22] for 20 different data sets from UCI machine learning repository [23], Statlog [24], and some private data sets, here balanced distribution i.e. experiments (C, ¬C, C&¬C) and (C&¬C) does not produce the best result.
Fig. 1. Model performance for class C (top row) and ¬C (bottom row) when using different combinations of the patch categories as a training set, i.e. different distribution of the classes in the training set. Here, experiments are
arranged according to the descending order of the precision on class C.
On the other hand, the natural distribution i.e. the one that has been used in the experiment (All) is the best trade-off maintaining distribution; it produces reasonable recall and precision for both classes C and ¬C at the same time, however not the best result producing distribution. Since in this research our main objective is helping pathologist in all cancer location detection with less false positive generation, the best trade-off maintaining distribution for both classes is not the desirable one, rather best result producing distribution for cancer (class C) class is the most desirable. For class C, the best precision is found for ¬C-biased training set i.e. for the experiment (¬C, C&¬C), while the best recall is found for C-biased training set i.e. for the experiment (C, C&¬C). However, while considering both recall and precision at the same time i.e. F-measure, ¬C-biased distribution (¬C, C&¬C) is the best distribution, and C-biased distribution (C, C&¬C) is
2Actually belongs to negative, however, predicted as positive.
3Actually belongs to positive, however, predicted as negative.
the worst distribution for class C. According to this result it is obvious that, in the ¬C parts of WSIs, there are some regions which look like class C parts i.e. there are some inter-class similar regions, that is why the absence of enough ¬C examples compared to class C examples in the training set (e.g. experiment (C, C&¬C)) causes false positive for cancer (C) class during test.
When considering the class ¬C, this is the other way around: the best precision is found for C-biased training set i.e. for the experiment (C, C&¬C), while the best recall is found for ¬C biased training set i.e. for the experiment (¬C, C&¬C). However, while considering both recall and precision at the same time i.e. F-measure, C-biased distribution is the best distribution for class ¬C.
In summary, for the cancer class C: (1) class C-biased training makes recall higher, (2) class ¬C-biased training makes precision higher, (3) balanced training causes an average result, and (4) the natural distribution i.e. training with the original distribution of the training set (experiment, (All)) makes the best trade-off in recall and precision (both are reasonable at the same time).
For class ¬C class:
(1) most of the experiments give more than 0.95 recall,
(2) class C-biased training gives the higher precision, (3) balanced training gives an average result, and (4) the natural distribution i.e. training with the original distribution of the training set (experiment, (All)) makes the best trade-off in recall and precision (both are reasonable at the same time).
In a nutshell for C (resp. ¬C), to increase precision we need ¬C (resp. C) biased training, while to increase recall, we need C (resp. ¬C) biased training. The class O is predicted well whatever the experiment is. Detailed results are presented in Table 2.
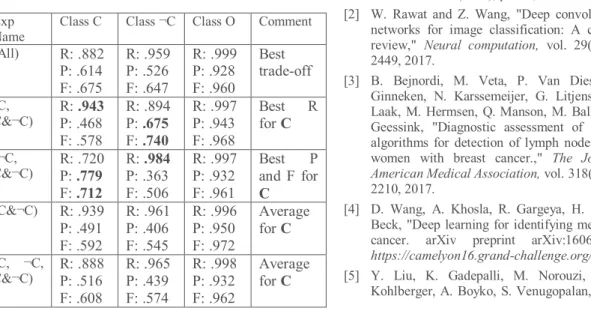
Table 2. Average results computed from the results of 27 test WSIs for the different experiments. Here, R, P, F means the recall, precision, and F-measure respectively.
Exp Name
Class C Class ¬C Class O Comment (All) R: .882 P: .614 F: .675 R: .959 P: .526 F: .647 R: .999 P: .928 F: .960 Best trade-off (C, C&¬C) R: .943 P: .468 F: .578 R: .894 P: .675 F: .740 R: .997 P: .943 F: .968 Best R for C (¬C, C&¬C) R: .720 P: .779 F: .712 R: .984 P: .363 F: .506 R: .997 P: .932 F: .961 Best P and F for C (C&¬C) R: .939 P: .491 F: .592 R: .961 P: .406 F: .545 R: .996 P: .950 F: .972 Average for C (C, ¬C, C&¬C) R: .888 P: .516 F: .608 R: .965 P: .439 F: .574 R: .998 P: .932 F: .962 Average for C
4. Conclusions and Future Work
In this research, we analyzed the impact of class distribution in the training set for metastasis detection task from WSIs while using U-net deep learning architecture. We utilize our own data set, in which one class, the class O is over-represented compared to the two other classes C and ¬C. This class O-biased data leads us to do a series of experiments with two other artificially class-biased training data: C-biased and ¬C-biased data, and artificially balanced data as well. All these artificially created training data were created by downsampling the over presented class O and in some experiments either downsampling C or ¬C class.
We found that balanced data does not lead to the best result in this domain, rather imbalance data leads to the desired accuracy for a given class. On the other hand, while keeping all possible training examples i.e. keeping the natural distribution in the training set causes the best trade-off in recall-precision, however, does not give the best result either in diagnosis perspective. In fact, the imbalanced distribution gives the most desirable result in this domain. More specifically, for cancer class prediction, non-cancer biased training reduces the confusion due to the inter-class similar region between cancer and non-cancer class, thus produces less false prediction for cancer class. Although our analysis gives a preliminary flavor of the behavior of the model towards the different distribution of classes in the training set, it demands deeper analysis. Specifically, here the number of training examples was not the same for all experiments, we will solve this issue in our future work. Moreover, here we tested the class distribution for a fixed set of network parameters, in the future, we will test the same setting for different parameter settings.
References
[1] Y. LeCun, Y. Bengio and G. Hinton, "Deep learning,"
nature, vol. 521(7553), p. 436, 2015.
[2] W. Rawat and Z. Wang, "Deep convolutional neural networks for image classification: A comprehensive review," Neural computation, vol. 29(9), pp. 2352-2449, 2017.
[3] B. Bejnordi, M. Veta, P. Van Diest, . B. Van Ginneken, N. Karssemeijer, G. Litjens, J. Van Der Laak, M. Hermsen, Q. Manson, M. Balkenhol and O. Geessink, "Diagnostic assessment of deep learning algorithms for detection of lymph node metastases in women with breast cancer.," The Journal of the
American Medical Association, vol. 318(22), pp.
2199-2210, 2017.
[4] D. Wang, A. Khosla, R. Gargeya, H. Irshad and A. Beck, "Deep learning for identifying metastatic breast cancer. arXiv preprint arXiv:1606.05718.," in
https://camelyon16.grand-challenge.org/, 2016.
[5] Y. Liu, K. Gadepalli, M. Norouzi, G. Dahl, T. Kohlberger, A. Boyko, S. Venugopalan, A. Timofeev,
P. Nelson, G. Corrado and J. Hipp, "Detecting cancer metastases on gigapixel pathology images. arXiv preprint arXiv:1703.02442.," in arXiv preprint
arXiv:1703.02442, 2017.
[6] G. Srinivasan and G. Shobha, "Segmentation techniques for target recognition," International
Journal of Computers and Communications, vol. 1(3),
pp. 313-333, 2007.
[7] F. Dernoncourt, J. Lee, O. Uzuner and P. Szolovits, "De-identification of patient notes with recurrent neural networks.," Journal of the American Medical
Informatics Association, vol. 24(3), pp. 596-606, 2017.
[8] M. Buda, A. Maki and M. Mazurowski, "A systematic study of the class imbalance problem in convolutional neural networks," Neural Networks, vol. 106, pp. 249-259, 2018.
[9] D. Masko and P. Hensman, "The impact of imbalanced training data for convolutional neural networks," 2015. [10] S. Wang, W. Liu, J. Wu, L. Cao, Q. Meng and P. Kennedy, "Training deep neural networks on imbalanced data sets," in IEEE International Joint
Conference In Neural Networks (IJCNN), Vancouver,
Canada, 24-29 July 2016.
[11] N. Chawla, K. Bowyer, L. Hall and W. Kegelmeyer, "SMOTE: synthetic minority over-sampling technique," Journal of artificial intelligence research, vol. 16, pp. 321-357, 2002.
[12] M. Kubat and S. Matwin, "Addressing the curse of imbalanced training sets: one-sided selection," in
International Conference on Machine Learning,
Tennessee, USA, 8-12 July 1997.
[13] M. N. Gurcan, L. Boucheron , A. Can, A. Madabhushi, N. Rajpoot and B. Yener, "Histopathological image analysis: A review," IEEE reviews in biomedical
engineering, vol. 2, p. 147, 2009.
[14] C. Szegedy, W. Liu, Y. Jia, P. Sermanet, S. Reed, D. Anguelov, D. Erhan, V. Vanhoucke and A. Rabinovich, "Going deeper with convolutions," in
IEEE conference on computer vision and pattern recognition, Boston, MA, 2015.
[15] S. Mejbri, C. Franchet, I.-A. Reshma, J. Mothe, P. Brousset and E. Faure, "Deep Analysis of CNN Settings for New Cancer Whole-slide Histological Images Segmentation: the Case of Small Training
Sets," in 6th International Conference on Bioimaging, Prague, Czech Republic, 2019.
[16] N. Jaccard, T. W. Rogers, E. J. Morton and L. D. Griffin, "Detection of concealed cars in complex cargo X-ray imagery using deep learning," Journal of X-ray
Science and Technology, vol. 25, no. 3, pp. 323-339,
2017.
[17] G. Levi and T. Hassner, "Age and gender classification using convolutional neural networks," in IEEE
Conference on Computer Vision and Pattern Recognition Workshops, Boston, MA, 2015.
[18] O. Ronneberger, P. Fischer and T. Brox, "U-net: Convolutional networks for biomedical image segmentation," in International Conference on
Medical image computing and computer-assisted intervention, Springer, Munich, Germany, 5-9 October
2015.
[19] F. Chollet and others, "Keras," 2015. [Online]. Available: https://keras.io.
[20] Y. LeCun, L. Bottou, G. B. Orr and K.-R. Müller, "Efficient backprop," Neural networks: Tricks of the
trade, pp. 9-48, 2012.
[21] D. P. Kingma and J. Ba, "Adam: A method for stochastic optimization.," arXiv preprint arXiv:1412.6980, 2014.
[22] R. C. Prati, E. A. Gustavo, P. A. Batista and D. F. Silva, "Class imbalance revisited: a new experimental setup to assess the performance of treatment methods,"
Knowledge and Information Systems, vol. 45, no. 1,
pp. 247-270, 2015.
[23] A. Frank and A. Asuncion, "UCI machine learning repository," 2010. [Online]. Available: http://archive.ics.uci.edu/ml.
[24] D. Michie, D. Spiegelhalter and C. C. Taylor, Machine Learning, Neural and Statistical Classification, 1994.