Cell Reports, Volume33
Supplemental Information
Optogenetic Stimulation of Basal Forebrain
Parvalbumin Neurons Activates the
Default Mode Network and Associated Behaviors
Laura Lozano-Montes, Marta Dimanico, Reza Mazloum, Wenxue Li, Jayakrishnan Nair, Michael Kintscher, Ralf Schneggenburger, Michael Harvey, and Gregor Rainer
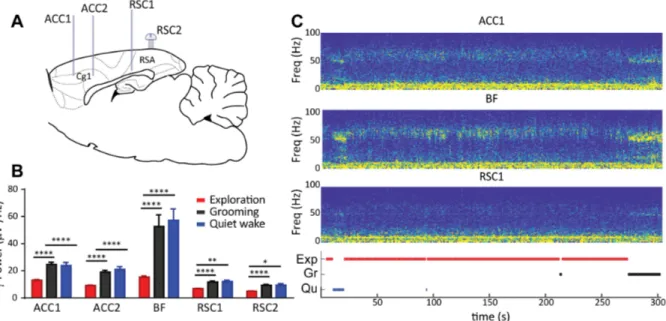
Figure S1. Gamma Power in ACC, BF and RSC during exploration and DMN like behaviors. A. Schematic showing recording sites in the Anterior Cingulate Cortex (ACC1 & ACC2) and Retrosplineal Cortex (RSC1 & RSC2). B. Gamma power per region during the different behaviors in a 5 min arena session of an example animal. During this period behavior was scored for exploration (red), grooming (black) and quiet wakefulness (cyan). C. Single-session LFP spectrogram of ACC, BF and RSC1 activity in a 5 min session in the arena for the same animal as in B. Periods of exploration (red), grooming (black), and quiet wakefulness (cyan) are shown below the spectrogram, related to Figure 4.
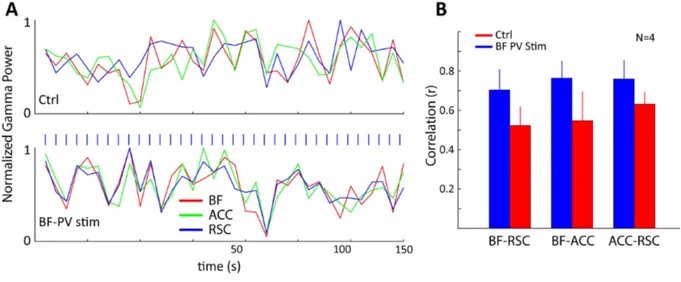
Figure S2. Correlation of gamma power over time. Gamma power in BF, RSC and ACC was calculated as the integral of the FFT between 30-80 Hz in sequential 5 second bins while the animals were in their home cage, an example for an individual animal is shown in the top panel of A. We then compared these results to those obtained during 30 Hz optogenetic stimulation of BF PV neurons, bottom panel in A. Panel B summarizes the results for N=4 animals. While gamma activity over time is clearly correlated between the three areas during the control period, activation of BF PV neurons significantly increased the correlation without preference to area, related to Figure 2.