HAL Id: inserm-00152668
https://www.hal.inserm.fr/inserm-00152668
Submitted on 8 Jun 2007
HAL is a multi-disciplinary open access
archive for the deposit and dissemination of
sci-entific research documents, whether they are
pub-lished or not. The documents may come from
teaching and research institutions in France or
abroad, or from public or private research centers.
L’archive ouverte pluridisciplinaire HAL, est
destinée au dépôt et à la diffusion de documents
scientifiques de niveau recherche, publiés ou non,
émanant des établissements d’enseignement et de
recherche français ou étrangers, des laboratoires
publics ou privés.
SIMULATION OF HEPATOCELLULAR
CARCINOMA IN MRI BY COMBINED
MACROVASCULAR AND PHARMACOKINETIC
MODELS
Johanne Bezy-Wendling, Marek Kretowski, Muriel Mescam, Krzysztof
Jurczuk, Pierre-Antoine Eliat
To cite this version:
Johanne Bezy-Wendling, Marek Kretowski, Muriel Mescam, Krzysztof Jurczuk, Pierre-Antoine Eliat.
SIMULATION OF HEPATOCELLULAR CARCINOMA IN MRI BY COMBINED
MACROVASCU-LAR AND PHARMACOKINETIC MODELS. Apr 2007, pp.1272-1275, �10.1109/ISBI.2007.357091�.
�inserm-00152668�
SIMULATION OF HEPATOCELLULAR CARCINOMA IN MRI BY COMBINED MACROVASCULAR AND PHARMACOKINETIC MODELS
Johanne Bézy-Wendling1, Marek Kretowski2, Muriel Mescam1, Krzysztof Jurczuk2, Pierre-Antoine Eliat3
1INSERM U642, Laboratoire Traitement du Signal et de l'Image, Rennes, France.
Université de Rennes 1, LTSI, Campus de Beaulieu, Rennes 35042 Cedex, France.
2 Faculty of Computer Science, Bialystok Technical University, Wiejska 45a, 15-351 Bialystok, POLAND. 3 ImagiVeC UPRES-EA 3890 IFR 140 Université de Rennes 1, FRANCE.
ABSTRACT
Physiological modeling is a way to better understand medical images, and to find some image markers of pathology. As far as the main hepatic tumor is concerned (Hepatocellular Carcinoma), the changes we try to reveal in images are mainly vascular ones. These modifications can be seen in Magnetic Resonance Images, whose visual analysis is usually performed by radiologists in order to detect and characterize liver lesions. We propose to model i) the liver and its pathological vascular changes related to tumoral development and ii) the MRI acquisition after injection of contrast product. The hepatic vascularization is modeled from the main branches until capillaries, including several parameters characterizing the tumor. The output of this physiological model constitutes the input of the MRI simulator. This one is based on the Bloch equations and images depend on the acquisition parameters, the tissue properties (relaxation times, proton density) and the contrast product propagation.
Index terms: Modeling, Magnetic Resonance Imaging, Simulation, Liver, Cancer.
1. INTRODUCTION
The hepatocellular carcinoma is the most common malignant tumor of the liver and its incidence is continuously increasing [12]. Several kinds of therapy can be used to treat this tumor, but it is obviously of great importance to detect their appearance and to characterize them the most precociously than possible in order to optimize the treatment. Medical imaging is a tool that participates to the diagnosis, in addition to biological and histological analysis. Medical imaging (US, CT, MRI) has the advantage of being non invasive, compared to biopsy. Moreover it is very safe except in the rare cases of allergy to the contrast dye.
Our objective is to reveal image markers of the tumoral development, in order i) to detect the lesion outbreak and ii) to characterize it by specifying its stage during the carcinogenesis process. To reach this aim, it is necessary to find relations between the modifications of the parameters computed in the image and the patho-physiological changes they reflect. This is all the more difficult since the measures realized in the image are not only reflecting tissular properties, but also acquisition conditions (operator, acquisition parameters – slice thickness, spatial and temporal resolution, kind of contrast agent and
injection profile, etc). In order to better understand the relations between the images characteristics, the tissular and vascular properties of the liver, and the acquisition conditions, we propose a model-based image analysis methodology. In our preceding works [3] [4], this approach has been applied to hepatic CT images modeling. In this paper, we propose to extend it to dynamic MRI simulation. Indeed, it has been shown that dynamic MRI can provide vascular parameters that are representative of the tumoral evolution [14]. The bi-level model proposed in [10] has been improved, mainly concerning the blood and contrast agent propagation, at the microscopic level. A new Physiologically Based Pharmacokinetic Model (PBPK), adapted to the liver, and which takes into account some of the vascular properties related to the tumoral development, is proposed in this paper. We coupled it with the macroscopic model of the liver and its vascularization [9]. We also propose a model of MRI acquisition, based on the Bloch equations, and that allows us to generate dynamic hepatic MRI simulated under various acquisition conditions.
2. CLINICAL PROBLEM
Our objective is to be able to detect, in MR images, the main changes due to vascular modifications during tumoral development of the liver.
For instance the complex flow modifications related to hepatocarcinogenesis (figure 1) can help to characterize the lesion. The main pathway of hepatocarcinogenesis is the progressive malignant transformation of a benign Regenerative Nodule (RN) in a malignant tumor, HepatoCarcinoma (HCC), in a cirrhotic liver. The Regenerative Nodule (RN) is made of normal hepatic cells, associated with an architectural disruption. Its vascular portal and arterial supplies are the similar to those of adjacent normal parenchyma. During the progressive malignant transformation of the nodule, we observe a rarefaction of the portal tracts (structures containing the hepatic arteriole and portal venule), together with an arterial neoangiogenesis (hatched region on the scheme).
These new vessels have morphological and physiological characteristics that differ from normal hepatic arterioles (in gray on figure 1). The portal supply of the nodule decreases progressively until it is canceled out in the poorly-differentiated HCC (HCCp). The phenomena are slightly more complex, regarding the arterial supply (gray zone plus the hatched gray one corresponding to neo vessels): an initial decrease of flow is This material is presented to ensure timely dissemination of scholarly and technical work.
Copyright and all rights therein are retained by authors or by other copyright holders.
All persons copying this information are expected to adhere to the terms and constraints invoked by each author's copyright. In most cases, these works may not be reposted without the explicit permission of the copyright holder.
HAL author manuscript inserm-00152668, version 1
HAL author manuscript
observed in low grade dysplastic nodules (DNl) which then progressively increases due to the arterial neovascularization. For high grade dysplastic nodules (DNh) and well-differentiated HCC (HCCw) the arterial flow increase, due to neo-vessels, can fully compensate for the drop in flow of normal arterioles.
Figure 1: Evolution of blood supply during hepatocarcinogenesis (RN: Regenerative Nodule, DNl,h: low, high grade Dysplastic Nodule, HCCw,m,p: well, moderate, and poorly differentiated HCC) [12].
Other microvascular properties are modified during the tumoral development like transport across the vessels wall. In our microscopic model, we took into account some of these parameters that constitute indicators of the tumoral stage, and that we would like to relate to image parameters.
3. METHOD 3.1. Vascular model
3.1.1. Macroscopic vascular model
In our computational model detailed in [9], the liver is constituted of parenchyma and vessels. The macrovascular network is made of 3 trees (Hepatic Artery HA, Portal Vein PV, Hepatic Vein HV), whose growth is simulated, considering at each growth cycle, the geometric (length, caliber) and haemodynamic properties (blood flow and pressure). This model is used to simulate local pathological changes, like hyper-vascularization due to a tumor development (vascular modifications are mainly arterialization and capillarization). The contrast product propagation, in normal or tumoral tissues is calculated, by using all the vessels characteristics. These 3 vascular trees are connected at the level of macro-functional units (“macro-cell”). A macro-cell is made of parenchyma and very small vessels, whose geometry is not considered, but whose enhancement has to be known, in order to simulate realistic MRI images. It is at this level that compartment modeling intervenes: each macro-cell is replaced by an independent pharmacokinetic model.
3.1.2. Model of transcapillaries exchanges
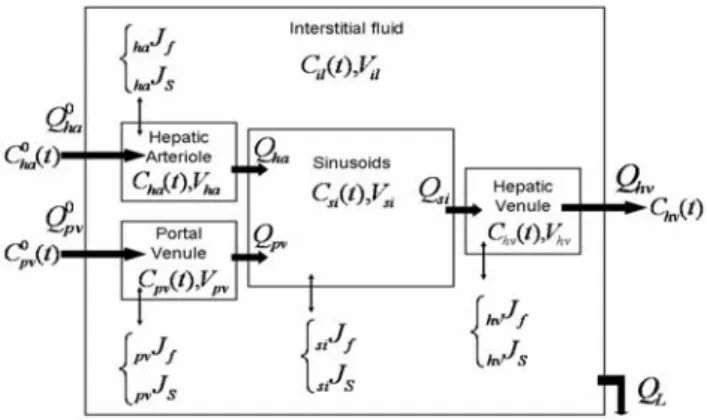
Each macro-cell is replaced by an independent five compartments model (figure 2) whose entries (arterial and portal blood flows and concentrations) depend on the corresponding data in the macro vascular model. Their profiles are deduced from the contrast product propagation in the macrovessels until the terminal arterioles and venules.
This pharmacokinetic model integrates the hepatic arteriole and the portal venule as full compartments and not just as simple inputs of the model. The inputs are the terminal branches of the hepatic artery and the portal vein, that supply the hepatic lobule,
considered here as the functional unit of the liver parenchyma. The output is the terminal hepatic venule, supplied by a capillary network that constitutes the sinusoidal compartment. These compartments do not only communicate with each other while the molecule is propagating. Transmembranar exchanges also exist between them and the interstitial fluid inside the lobule. A model of these exchanges was already applied by Kellen & al [8] in the cardiovascular system.
Figure 2: Compartment model of the hepatic microcirculation Symbols: Q (flows, mL.s-1), C (concentrations, mM), V
(volumes, mL), J (fluxes, f stands for fluid, cm.s-1, and s for
solute, mmol.cm-2.s-1)
In this work, several pathways are considered for the solute and fluid exchanges. For example, sinusoids, that are a particular type of discontinued capillaries, present large fenestrations, in addition to small and large pores. In the opposite, the arterioles and venules are supposed to be impermeable in a normal liver. Some important parameters whose variations characterize the tumoral stage evolution are integrated. They are mainly transport parameters (vascular permeability, hydraulic conductivity, reflection coefficient) related to the molecule and to the vascular walls properties, but also exchange area, concentration and pressure gradients.
The molecule propagation is described by the system of differential equations given below, where the evolution of its concentration in each compartment is computed as a function of time (V/S notations correspond to Volumes/Surfaces).
) ( ). ( ) ( ) ( ). ( ) ( Q0 t C0 t S J t Q t C t dt t dC V ha ha ha ha ha S ha ha ha = − × − ) ( ). ( )) ( ) ( ). ( ) ( 0 0 t C t Q t J S t C t Q dt t dC V pv pv pv pv S pv pv pv pv = − × − ) ( ). ( )) ( ) ( ). ( ) ( ). ( ) ( t C t Q t J S t C t Q t C t Q dt t dC V si si S si si pv pv ha ha si si − × − + = ) ( . ) ( ) ( ) ( ) ( ) ( t C Q t J S t J S t J S t J S dt t dC V il L S si si S hv hv S pv pv S ha ha il il − × + × + × + × =
Concentrations in the five compartments are used to compute the resulting concentration in each macro-cell, and then the T1, T2
values necessary to generate the 3D phantom needed by the MRI ) ( ). ( )) ( ) ( ). ( ) ( t C t Q t J S t C t Q dt t dC V si si hv hv S hv hv hv hv = − × −
simulator. Those new relaxation parameters (after injection of contrast agent) are obtained from the following equation:
) ( . 2 , 1 int 2 , 1 2 , 1 R r C t R rinsic observed = +
Where R1,2 are relaxation rates (s-1), r1,2 are relaxi ities (mv M-1.s-1)
and C(t) (mM) is the agent concentration.
consists in three main steps. The first one is ased on Bloch equations [6]. It is devoted to the simulation of
3.2. Model of MRI
The proposed model b
the excitation and the relaxation processes, characterized by the following equations: 2 2 1 0 ) ( )) ( ) ( ) ( ) ( ( ) ( M t M t B t M t B t M dt t dM z x z ) ( )) ( ) ( ) ( ) ( ( ) ( ) ( )) ( ) ( ) ( ) ( ( ) ( T t M t B t M t B t M dt t dM T t M t B t M t B t M dt t dM T y z x x z y x y z z y x x y y − − = − − = − − − =γ γ γ
Where M(t) is the 3D magnetization vector at time t, M0 is the
equilibrium magnetization vector, B(t) is the 3D magnetic field at
adio frequency field. The magnetic field
induction) related to the time t, T1 and T2 are the relaxation times and γ is the
gyromagnetic ratio.
The object is placed in the main static magnetic field and submitted to the r
gradients are added. The series of matrices with values of the magnetization vectors are thus collected. The model allows us to change the slice thickness, repetition time, echo time, inversion time, sampling interval, sampling time, frequency encoding range, number of frequency encoding steps, phase encoding range, number of phase encoding steps, etc. Moreover it enables to choose one of the three following MRI sequences: spin echo, gradient echo or inversion recovery.
The second step was built upon the physical laws (for instance, Faraday’s law of electromagnetic
received magnetic signal and to the coded and decoded signal in the 3-dimensional environment [11]. The resulted equation to simulate the received voltage is:
∫
− = constdM t dV t E() () dtWhere const describes the magnetic properties of the transceiver. The third step consists in the image reconstruction using the fast d the
n figure 3. It is possible to load and display the 3D
, spin-Fourier transform algorithm applied to the received signal. This model is implemented in the C++ language. Two additional modules are integrated: one for analog-digital conversion an other to set the appropriate parameters in order to avoid problems with the artifacts associated to Nyquist’s law and spatial encoding.
Part of the graphical user interface of our MRI model is displayed o
phantoms that are going to be imaged, to choose the MRI parameters, to perform the simulation of the images and finally to visualize and compare simulation results. Another advantage of this interface is the comfortable and clear dialog windows which allow watching artifacts related to the spatial encoding and the analog-digital conversion. These aspects make our simulator easier to use than already existing simulators such as SIMRI [2]. Furthermore, additional module, responsible for the computation in the grid computing environment, was created. It uses a multiprocessor machine with the Inifiband network and the MPI 1.2 standard with its implementation in MVAPICH 0.9.5. The input of the simulator is a 3D phantom, whose voxels are characterized by the following parameters: proton density
lattice relaxation time (T1), spin-spin relaxation time (T2) and,
eventually, spin-spin relaxation time with the influence of the magnetic field inhomogeneity (T2*). These features depend on
the voxel composition (proportion of hepatic parenchyma, and blood), and are also related to the contrast product concentration, computed with the microscopic model presented in §3.1.2.
Figure 3: Overview of the main window of the MRI simulator with some results of a given region of interest in the liver.
Figure 4.a s ulated liver.
oherence of the pharmacokinetic model was evaluated
4. RESULTS AND DISCUSSION
hows the arterial tree of the sim C
independently from the macroscopic one, in particular conditions of simulation (steady-state) for three kinds of contrast agent molecules (Gd-DOTA (DOTAREM®, Guerbet, France), P760 [7], Ultrasmall Particles of Iron Oxide [5] [13]). It was also applied to the modeling of different stages of liver carcinogenesis, from the healthy case to the HCC. The simulated concentration curves vs. time appeared to be in agreement with known modifications in the liver related to the hepatocarcinogenesis, as for example arterialization phenomenon (figure 4.b).
a) Macrovascular model b) Microvascular model
Fi rial vas d
liver. b) Evolut n of the contrast product concentration in the 5
The r or a
mulated moderate-differentiated HCC, for which portal supply gure 4: a) Part of the arte cular tree of the simulate
io
compartments of the pharmacokinetic model (HCCm). esults on the right-handed graph of figure 4 are given f si
is decreased as well as sinusoids permeability. The concentration in the hepatic lobule (hepatic parenchyma macro-cell when coupling the two models) is a weighted sum of concentrations in all compartments. Consequently, the global concentration in the tumoral hepatic tissue is also higher at the arterial phase than in the portal one. This is even more observable on poorly-differentiated HCC where the portal supply is completely inhibited. At this state of the study, we can expect to observe
some contrast between tumoral and normal tissues at arterial phase. Indeed, T1 and T2 relaxation times are decreased with contrast agent concentrations and relaxivities. A new class of macro-cells with characteristics such as birth, death, supply, etc, that differ from normal macro-cells was generated in a region of the vascular system, to simulate a hypervascularized zone. In addition, transport parameters have been controlled to simulate more particularly a poorly-differentiated HCC: fenestrations were suppressed in the sinusoids to decrease their permeability; on the contrary, interstitial osmotic and hydrostatic pressures were increased in the tumoral macro-cells.
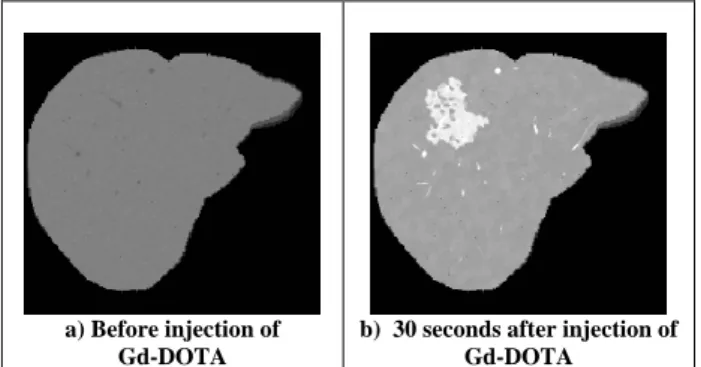
a) Before injection of Gd-DOTA
b) 30 seconds after injection of Gd-DOTA
Figure e liv c
physiological model (§3.1), and the MRI simulator (§3.2.) on a
ulated MR images of the generated 3D hantom, with various acquisition parameters. Figure 5.a shows
PERSPECTIVES
In this pap els of the
epatic vascularization are presented. They were initially
[1] M. Barth and E. M R relaxation times of uman blood samples at 1,5T and implications for functional
tive MRI simulator”, J. Mag. Res., vol. 173, pp 97-115, enhancement in computer tomography: combined models
: combined compartment ferent tissue systems –
4, 1946.
gadolinium complex characterized by a low rate
of coupled water and solute exchange in the heart”, Am. J. rks
Findings in Hepatic Cellular Carcinoma by a
two-.
. Radiol., vol. 71, pp. 1116-1129, 1998. able 5: MR images of th er simulated using the hepati
T1-weighted spin echo sequence at 1.5 T (TE=12ms, TR=300ms, slice thickness 3mm).
Figure 5 displays sim p
the result of a T1-weighted spin echo sequence before injection of a contrast agent. Such sequence is characterized by a short echo time TE and a short repetition time TR, thus enhancing the contrast on T1 parameter: tissues with longer T1 (vessels) appear darker. The same sequence is then applied 30 seconds after injection of a Gd-DOTA contrast agent (figure 5.b). As this time corresponds approximately to the arterial phase, the concentration of contrast agent is higher in the tumor than in the healthy tissue, the T1 of this region is then decreased, and the HCC appears brighter, as expected.
5. CONCLUSION AND
er, two models that describe two different lev h
developed separately for evaluation, and then combined to allow the simulation of MR images of the liver, generated by a recently developed MRI simulator. The macroscopic model enables to simulate different pathologies of the vascular system, via modeling for instance hypervascularized tumors in defined regions of the organ, while the microscopic one is more specialized in molecule transport in the parenchyma. The simulation of MR images of tumors in the liver already showed promising results. The new microscopic model not only includes important physiological parameters that are responsible for changes in the vascularization. It also takes into account characteristics of the molecule, thus permitting to evaluate different kinds of molecules. The integration of hepatic cell and biliary compartments, in the future, will be interesting and useful for active transport modeling. This way, the simulation of new contrast agents or even therapeutic molecules will become
possible, for instance in drug delivery studies or molecular design. In the case of the macroscopic model, improvements are under study to design more realistic vessels and macro-cells that would take into account tumoral tissue characteristics. On top of that, integration of new modules in the MRI simulator, such as new sequences, is foreseen. All those improvements combined are necessary to generate more realistic images. In addition to the study of new molecules and optimization of injection profiles or MRI sequences, image analysis is of great interest. Indeed, texture analysis on both simulated and real MR images of the liver, could explain physiological (model of the liver) parameters related to the phenomena we observe, and control the influence of physical parameters (MRI simulation).
REFERENCES
oser, “Proton NM h
MRI”, Cellular and molecular biology, vol. 43(5), pp. 783-791, 1997.
[2] H. Benoit-Cattin et al., “The SIMRI project : a versatile and interac
2005.
[3] J. Bézy-Wendling, M. Kretowski and Y. Rolland, “Hepatic tumor
of liver perfusion and dynamic imaging”, Computers in Biology and Medicine, vol. 33, pp. 77-89, 2003.
[4] J. Bézy-Wendling, M. Kretowski and P. Coupe, “Modeling of tumor conspicuity in hepatic CT images
and vascular models”, IEEE ISBI2004.
[5] A. Bjornerud, “Proton relaxation properties of a particulate iron oxide MR contrast agent in dif
Implications for imaging”, Comp. Sum. Uppsala Diss. Fac. Med., 2002.
[6] F. Bloch, “Nuclear induction”, Physical Review, vol. 70, pp. 460-47
[7] C. Corot et al., “Physical, chemical and biological evaluations of P760: a new
of interstitial diffusion”, J. Mag. Res. Im., vol. 11, pp. 182-191, 2000.
[8] M. R. Kellen and J. B. Bassingthwaighte, “An integrative model
Physiol. Heart Circ. Physiol., vol. 285, pp. 1303-1316, 2003. [9] M. Kretowski et al., “Physiologically Based Modeling for Medical Image Analysis: Application to 3D Vascular Netwo and CT Scan Modality”, IEEE Trans. Med. Im., vol. 22, pp. 248-257, 2003.
[10] M. Kretowski, J. Bezy-Wendling, P. Coupe, “Simulation of Biphasic CT
level Physiological Model”, IEEE Trans. Biomed. Eng. (in print). [11] V. Kuperman, “Magnetic resonance imaging: physical principles and applications”, Academic Press, San Diego, 2000. [12] O. Matsui, “Detection and characterization of small hepatocellular carcinoma”, J. Gastroent. Hepato., vol. 19, pp S266-S269, 2004.
[13] M. Rausch et al., “In-vivo visualization of tracer kinetics for radiologists”, Brit. J
[14] P. S. Tofts et al., “Estimating Kinetic Parameters From Dynamic Contrast-Enhanced T1-Weighted MRI of a Diffus
Tracer: Standardized Quantities and Symbols”, J. Mag. Res. Im., vol. 10, pp. 223-232, 1999.