China’s Outbound Real Estate Investment by
Qing Wang
B.S., Construction Management, 2007 M.S., Management Science and Engineering, 2009
Tsinghua University
Submitted to the Program in Real Estate Development in Conjunction with the Center for Real Estate in Partial Fulfillment of the Requirements for the Degree of Master of Science in Real Estate Development
at the
Massachusetts Institute of Technology February, 2017
©2017 Qing Wang All rights reserved
The author hereby grants to MIT permission to reproduce and to distribute publicly paper and electronic copies of this thesis document in whole or in part in any medium now known or hereafter created.
Signature of Author_____________Qing Wang____________________________________________ Center for Real Estate
January 17, 2017
Certified by_______________________________________________________________ Professor Albert Saiz
Daniel Rose Associate Professor of Urban Economics and Real Estate, Department of Urban Studies and Center for Real Estate
Accepted by______________________________________________________________ Professor Albert Saiz
Daniel Rose Associate Professor of Urban Economics and Real Estate, Department of Urban Studies and Center for Real Estate
China Outbound Real Estate Investment by Qing Wang
Submitted to the Program in Real Estate Development in Conjunction with the Center for Real Estate on January 17, 2017 in Partial Fulfillment of the Requirements for the Degree of Master of Science in Real
Estate Development
ABSTRACT
Since 2013, investors from the People’s Republic of China (PRC) have made significant strides in the global real estate market, especially in developed regions such as North America, Australia, and Western Europe. From 2014 to 2016, this trend became stronger, and by 2016 Q3, China became the top cross-‐border real estate investment country by transaction volume. We ask the following question: After the prosperity of the last three years, will the global investment trends of PRC investors remain steady or not?
This thesis first reviews the progress made by PRC investors in recent years and the key reasons for it. It then discusses PRC investors’ investment preferences and strategies. The discussion then focuses on includes pragmatic considerations of tax matters and domestic regulatory problems in the PRC. The thesis concludes by exploring new trends in the market and speculating about the future of cross-‐border real estate investments by PRC citizens.
Thesis Supervisor: Professor Albert Saiz
Title: Daniel Rose Associate Professor of Urban Economics and Real, Department of Urban Studies and Center for Real Estate
Acknowledgments
First, I would like to express my gratitude to my education advisor, Professor Albert Saiz, for his continuing support and guidance not only of my thesis but also during my studies at Massachusetts Institute of Technology (MIT). His insightful suggestions regarding my research, studies, career, and life not only made my time at MIT meaningful but also gave me the confidence to explore my future. I also thank Tricia Nesti, who helped facilitate my application and study period and gave me thoughtful advice and encouragement.
Second, I would like to thank all the interviewees who agreed to participate in my interviews. They were very helpful in not only answering the interview questions but also sharing insights into my field of study. During my internships and research in China, in December 2015 and the summer of 2016, I met several professionals with extensive experience in field of PRC investment in the global real estate market, some of whom were members of the core teams in key transactions. My discussions with them helped me to form a realistic and practical understanding of the topic, which contributed to my progress in narrowing my thesis topic after 2015.
Third, I would like to thank my parents and my family. Without their encouragement and support, I would not have decided to quit from my career in China and take a gap year education program far away from my family, especially when they needed me very much. I could not wait to move back to home country to continue my career and spend more time with them. After the surgery operation for her kidney cancer in January 2015, my mother constantly worked and traveled between China and Europe trying to make contribution in China-Europe cooperation. Her spirit encouraged me to keep exploring what I really believe in so that I could make a great contribution to my field of study and career. I am very proud of her.
I also express my great appreciation to my fellowship sponsor Mr. Samuel Tak Lee, MIT CRE and the Samuel Tak Lee (STL) Real Estate Entrepreneurship Lab. Without them, I could not have continued my studies. I believe that my studies in the Master of Science in Real Estate
Development (MSRED) Program will help me to fulfill my dream and keep moving forward gradually to contribute to my country and the real estate industry.
Table of Contents
Abstract
Acknowledgements Contents
Introduction
Introduction of Interview Process
Part 1: A Review the Progress of PRC Investors and Key Drivers 1.1 Review of PRC Investors’ Progress in Global Real Estate Market
1.2 Key Reasons for the Boom a) Slowing Domestic Growth
b) Excess Liquidity and Scarcity of Attractive Asset in Domestic Market c) Currency Rate Advantage and Depreciation Expectation
d) The Rise of PRC Institutional Investors
e) The Global Expansion Needs of PRC Real Estate Developers f) Governmental Encouragement
g) Global Allocation Intention Becomes a Normalized Trend
1.3 Global Investment by Geographical Area
1.4 Investment by Property Type
1.5 Major Players:
a) Real Estate Developers b) Conglomerates
d) State-Owned Commercial Banks, Asset Management Companies, and Sovereign Wealth Funds
Part 2: A Practical Discussion: Investment Preference, Strategy, Tax Considerations, and Regulatory Problems
2.1 Equity Investment Strategy
a) City Selection: Gateway Cities, the First Choice for Risk and Image Considerations b) New Growth Points to Explore: Cap Rate and Submarket
c) Asset Type and Investment Strategy Selection
2.2 Debt Investment Strategy: a New Deployment Opportunity a) The Opportunity and Background
b) A Good Match for HNWI Asset Allocation
2.3 Tax Issues in PRC Cross-border Deals
2.3.1 Typical Equity Investment Tax Structure a) Levered US Corporate Blocker
b) Levered US Corporate Blocker with offshore LP c) US REIT Structure
d) US DC REIT
2.3.2 Possible Debt Investment Tax Structure
2.4 Regulation Issue for PRC Cross-border Deals
a) Background of PRC Capital Outflow Regulations b) The Most Recent Regulations
Part 3: New Trends and the Outlook for PRC Global Real Estate Investment 3.1 From the Trial Stage to the Sustainable Investment Stage
a) More Experienced in Decision Making b) Global Team Establishment
c) Deal Sourcing Mode and Partnership
d) From Single Investment to Broad Deployment Portfolio
Introduction
In Q3 of 2016, the People´s Republic of China (PRC) finally became the top cross-border real estate investment country by transaction volume. This result was not surprising; however, what was surprising is the speed of this progress: 2007 was the first year in which significant global deals were made by PRC investors.
The key causes for this extraordinary step forward, which was achieved in less than a single decade, the experience and the bottleneck in the current situation, and future challenges and opportunities are worth reviewing, analyzing, and predicting. Detailed topics such as investment preference by geography, asset type, strategy, taxes, domestic regulatory problems in the PRC, and cross-cultural issues are also worth discussing. This thesis focuses on these topics with the objective of sharing useful analyses and findings with PRC investors, their overseas partners, counterparties, and other stakeholders involved in relevant cross-border deals. In benefiting from the findings of this thesis, each stakeholder will be prepared to take advantage of opportunities, make proper decisions, and communicate smoothly in key conversations.
The thesis is organized in three parts. The first part reviews the progress made by PRC investors made in recent years and the main reasons for this progress. The second part discusses
investment preferences, strategies, tax considerations, and domestic regulatory problems in the PRC. The third part summarizes some new trends in the market and makes predictions for the future of PRC investment in outbound real estate.
Introduction of the Interview Process
Professionals who worked for key stakeholders were interviewed formally or informally to collect firsthand information and derive a realistic understanding of the market and the practice of cross-border investment by PRC citizens.
To conduct the formal interviews (please refer to the formal questions in the Appendix), in the winter of 2016, I visited three real estate investment professionals who worked or who used to work at the headquarters of the investment team of four pension funds among the top five in the PRC. I interviewed two development professionals in the PRC developers’ US office, two private equity (PE) professionals in PRC-based PE funds that had closed deals in the US or the UK, and two real estate investment professionals in conglomerates. All interviewees were at the senior professional level and had conducted first-line, buy-side deals in key transactions since 2013. I also conducted informal interviews with two relevant government officials, three agents/brokers, one tax advisor, and three lawyers. During the winter of 2015 and the fall of 2016, I also interviewed several junior-level team players in other PRC buy-sides to help me build a solid, fundamental understanding of the field before I interviewed the senior
Figure 1: Stakeholders in PRC Real Estate Cross-‐Border Transactions
Part 1: A Review the Progress of PRC Investors and Key Drivers
1.1 Review of PRC Investors’ Progress in the Global Real Estate Market
According to the Jones Lang LaSalle (JLL) data base, from Q1 to Q3 in 2016, PRC sovereign funds, state- owned enterprises, insurance companies, real estate developers, and private individuals closed deals that exceeding USD 17 billion, which was an increase of more than 50% over the same period in 2015. For the first time, this volume of transactions in Q1 to Q3 in 2016 made China the biggest cross-border real estate investor in one year. Other major players were the United States, which always leads the list of active global investors, Germany, the Middle East, etc. While US and Canadian investors continued to scale back their international investments following the lead of global funds, German, French, Singaporean, and South Korean investors deployed more investment in 2016 than they did in 2015.
Figure 2: Volume of outbound deployment 2015 and 2016 Q1–Q3 Data Source: Jones Lang LaSalle
0 5 10 15 20 25 2016 YTD 2015 YTD
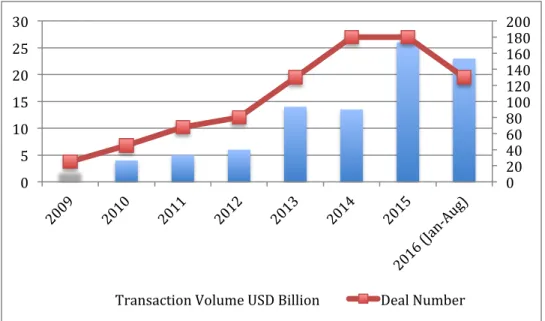
According to DTZ Cushman & Wakefield (DTZ) and the Real Capital Analytics (RCA) database, from 2009 to 2015, China’s total investment in the overseas real estate market amounted to around USD 2 billion. By 2016, the volume had increased by more than ten times since 2009. Since 2015, the increase in the number of deals has been very modest, showing that there were significant mega deals in recent years, especially in sovereign funds, pension funds, and state-owned enterprises (SOEs), which became the major players in the market.
We understand that different databases have different absolute volumes, but we can still refer to the relative trend.
Figure 3: 2009 to 2016 January to August transaction volume outbound from China Data Source: DTZ Cushman & Wakefield and Real Capital Analytics
0 20 40 60 80 100 120 140 160 180 200 0 5 10 15 20 25 30
1.2 Key Reasons for the Boom
a) Slowing Domestic Growth
Since the Reform and Opening-up Policy in the 1990s, China has experienced economic growth of more than 8%. The over-reliance on investment-driven growth has
characterized the mind-set in China. When the domestic engine slowed gradually and regained a balanced status, companies and rich families had to seek new investment opportunities to increase their fortunes. The domestic asset bubble gave them ammunition to conduct global allocations and buyouts.
Figure 4: Annual Growth Rates of China’s GDP Data Source: National Bureau of Statistics of China
b) Excess Liquidity and Scarcity of Attractive Assets in the Domestic Market
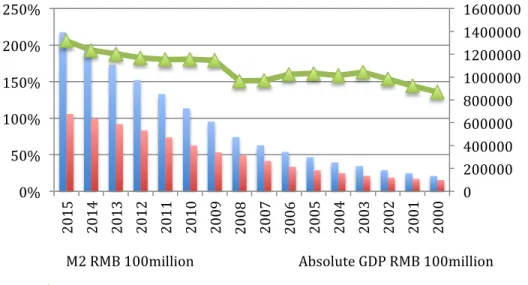
Excess liquidity and the rapidly expanding asset bubble are significant side effects of the national “4,000 billion” Revitalization Plan, which was implemented after the financial crisis. This bubble forced asset prices to overheat, especially in the real estate market. Compared to domestic assets, good yields and moderate investment risks in key cities with mature market increased the attractiveness of real assets, especially since 2013.
Figure 5: GDP and Broad Money-M2 2000-2015
Data Source: National Bureau of Statistics of China; Capital IQ Database
c) Currency Rate Advantage and Depreciation Expectation
In 2013, the appreciation of the RMB increasing the purchasing power of investors in the PRC, which became the main driver of outbound real estate investments. The outbound investment tide was thus influenced until 2015, after which the regulatory landscape reversed dramatically, in the wake of the significant depreciation in the RMB in 2015. Subsequently, there were increasingly fearful expectations that the currency would depreciate further. These expectations became the key driver of outbound capital flows because prime real estate assets in the developed market seemed to be a safe harbor in the event of a further loss in value of the Chinese currency.
0 200000 400000 600000 800000 1000000 1200000 1400000 1600000 0% 50% 100% 150% 200% 250% 2015 2014 2013 2012 2011 2010 2009 2008 2007 2006 2005 2004 2003 2002 2001 2000
M2 RMB 100million Absolute GDP RMB 100million
Figure 6: USD/CNY Exchange Rate Trend 2011–2016 Data Source: XE Currency Charts
d) The Rise of Institutional Investors in the PRC
In 2010, the PRC’s Insurance Regulatory Committee issued a new policy to allow insurance companies to allocate assets in the real estate sector. In the PRC, this policy opened the door to the prime domestic commercial real estate market in gateway cities, which led to the rise of institutional investors in the real estate sector. In 2013, with the relaxation of regulations, insurance companies, such as Ping An, China Life, An Bang, Tai Kang, and Sunshine, started to move from the domestic real estate market to global markets as the inbound asset bubble was increasing. Furthermore, these institutions had become mature enough to begin their global asset allocation to balance risk. The rise of insurance companies in the PRC represented only the tip of the iceberg. It was also expected that real estate investment by institutional investors in the Asian Pacific region would increase by USD 240 billion between 2015 and 2020, mainly led by PRC
institutional investors that would motivated by the gradual increase in allocations to the real estate sector and the sustained growth of the total asset base.
e) The Global Expansion Needs of Real Estate Developers in the PRC
The overdevelopment in the real estate sector is a severe problem for the economy of China. reducing the inventory will become a new theme of the country because real estate is no longer the pillar of industry in China. Developers, especially listed ones, have to change their strategy or seek new business opportunities and or growth possibilities in overseas markets in order to hedge their business risk. Hence, an increasing number of developers, such as Vanke and LandSea, are currently building fully functional overseas teams by moving from the position of investor partners to the positions of local
developers and project sponsors. These firms have understood that their long-term market ambitions will materialize only if they establish a good platform. This multinational business expansion needs to undertake much development in order to establish global real estate investment.
f) Governmental Encouragement
Encouragement by the central government is also an essential driving factor. Since 2010, the People's Bank of China (PBOC), which is the Federal Reserve of China, has issued several new policies to facilitate foreign exchange settlement not only for export and import trading but also for capital expenditures. From 2011 to 2014, the State
Administration of Foreign Exchange (SAFE) and the PBOC were allowed to make overseas loans under the domestic guarantee arrangement, which represents a key improvement in policy. In the early stages of state-owned enterprises and institutional investors’ move toward outbound investment, overseas loans under domestic guarantees have played a major role in their funding structure (e.g., the China Life Canary Wharf Deal). Starting in 2014, National Development and Reform Committee (NDRC) and The Ministry of Commerce of the People's Republic of China (MOFCOM), the two biggest financial authorities in China, issued a relevant policy to loosen control on approvals at
the provincial and municipal level Development and Reform Committee (DRC) for “non-significant” outbound investments (below USD 1 billion). Projects below USD 300 million can be filed with the municipal DRC without the need to obtain approval. From 2014 to 2015, the central government also approved several free trade zones (FTZ), such as Shanghai FTZ, Shenzhen Qianhai, Zhuhai Hengqin, and Tianjin FTZ, to smooth the outbound and inbound flows of capital.
g) Global Allocation Intention Becomes a Normalized Trend
In recent years, institutional investors in the PRC have matured and become increasingly sophisticated in real estate investments with the result that real estate assets under
management (AUM) have expanded rapidly. In 2016, more than 50% of AUM was more than USD 15 billion, and only 17% of AUM was less than USD 1 billion. An increasing number of institutions consider outbound investments not only as short-term arbitrage or speculative deals but also as part of their long-term global asset allocation, which they see as necessary to balance risk and returns. With regard to investment preferences, this is the reason that only 58% of investors target Greater China and more than 30% of
investors target the North American, European, and global markets.
Figure 7: PRC Institutional Investors’ Real Estate AUM* Data Source: Preqin Real Estate
17% 15% 17% 13% 17% 21% Less than $1bn $1-‐4.9bn $5-‐14.9bn $15-‐49.9bn $50-‐99.9bn $100bn or more
*This chart shows the percentage of PRC institutional investors at each level of AUM. According to the
Preqin database, 17% of PRC institutional investors have an AUM under USD 1 billion, 15% have an AUM between USD 1 billion to 4.9 billion, and 22% have an AUM at or above USD 100 billion.
Figure 8: PRC Institutional Investors’ Real Estate Investment Destination Preferences* Data Source: Preqin Real Estate
*This chart shows the percentage of PRC institutional investors’ investment destinations. According to the
Preqin database, 29% of PRC institutional investors prefer to invest in Greater China, 17% prefer to invest in North America, and 19% prefer to invest in Europe.
29% 17% 19% 10% 5% 1% 19%
Greater China North America Europe
Asia Rest of the World Emerging Markets
1.3 Global Investment by Geographical Area
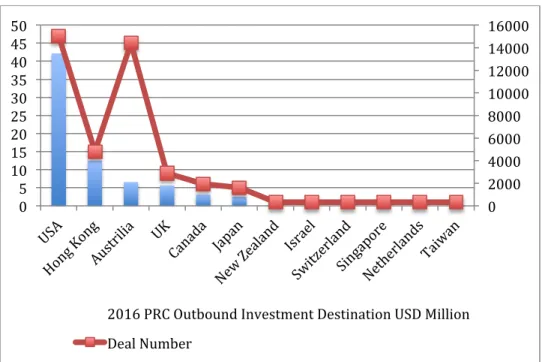
Geographically, the US has been the top real estate investment destination for PRC investors from 2008 to the present in both the volume of transactions and the number of deals according to research by Cushman & Wakefield, DTZ, and RCA. From 2015 to August 2016, the US, Hong Kong (HK), and Australia are the top three investment destinations for PRC capital.
It is not surprising that the US has been the preferred destination in recent years because a key reason for PRC outbound capital flows is to find a safe harbor. Global instability, Brexit, and the possible bubble bursting in China have made commercial real estate in the US one of the most desirable investments in the world. Other factors that have motivated such investment are expected currency appreciation of the USD against the RMB,
immigration, and higher education opportunities for investors’ children. According to Hurun's 2016 report on the immigration preferences of the PRC’s “High Net Wealth Individuals,” the US, Australia, and Canada are the top three destinations. Australia has a mature market, good immigration policies, and it is a popular destination for education. In addition, PRC investors are familiar with Australia because some real estate buyers used to invest in resources in Australia, which ebbed in 2013. The undervaluation of the Australian currency in recent years has also increased the attractiveness of the current window of real estate investment for PRC investors. The Hong Kong market has attracted increasing interest because it has long been positioned as the international hub of
Mainland China. As gateway cities in Mainland China faced land price bubbles and historical overheating, the Hong Kong market became more reasonable for some Mainland developers and institutional investors.
Figure 9: PRC Outbound Investment Destinations January to August 2016 Data Source: DTZ Cushman & Wakefield and Real Capital Analytics
Figure 10: PRC Outbound Investment Destinations 2015
Data Source: DTZ Cushman & Wakefield and Real Capital Analytics
0 2000 4000 6000 8000 10000 12000 14000 16000 0 5 10 15 20 25 30 35 40 45 50
2016 PRC Outbound Investment Destination USD Million Deal Number 0 500 1000 1500 2000 2500 3000 3500 4000 4500 5000 0 10 20 30 40 50 60 70 80 90
2015 PRC Outbound Investment Destination USD Million Deal Number
1.4 Investment by Property Type:
According to the RCA Database, office buildings and hotels are still the foremost targets of outbound investment. From January to August in 2016, the transaction volumes of office buildings accounted to 51% of the total transactions of overseas real estate, while hotel deals accounted for 33%. Because commercial leases tend to be eight to ten years or even longer in the UK and US markets, prime location office buildings can be very good assets for generating stable and decent cash flows. Hospitality portfolios in the gateway cities of developed countries can also generate good returns. Some landmark hotels are also attractive trophy assets that can bring good exposure to PRC buyers. Therefore, it is not surprising that office buildings and hotels have been the two most favored assets in recent years.
Figure 11: PRC Outbound Investment Property Type January to August 2016 Data Source: Real Capital Analytics
51.00% 33.00%
10.00%
1.5 Major Players
Major players in the PRC’s outbound investment in real estate are typically real estate developers, investment companies and conglomerates, insurance companies, real estate funds and Private Equity (PE), wealthy individuals, and asset management companies that serve High Net Wealth Individuals (HNWIs), and other companies. Real estate developers, investment companies and conglomerates, insurance companies, and SWFs are the most active in large deals.
a) Real Estate Developers
Greenland, Vanke, and LandSea are typical real estate developers that are active in overseas markets. Their moves overseas were motivated by the desire mainly for global expansion and diversification, not financial returns. Therefore, they paid more attention to acquiring established local teams and their capabilities in deal sourcing, development, project management, and so on. They started as financial investors in order to learn from their local partners while supplementing their team by local recruits in order to enhance their overseas platform. Strategically, outbound deals are only the beginning for this kind of market player. They intend to build a fully functional, sustainable overseas platform to invest, develop, manage, sale, exit, and operate in overseas markets in order to fulfill their dream of having multinational companies (MNC) on the global horizon. This type of developer has financial strength and extraordinary track records in nationwide real estate or AUM scales in Mainland China before they undertake global expansion. For example, Greenland, Vanke, and LandSea are all listed enterprises with real estate as their primary business. Generally, they made their first move in the US market or the European market in 2013, which was somewhat later than the outbound movement of some smaller private domestic developers. However, the big players made steady and systematic professional progress until 2016.
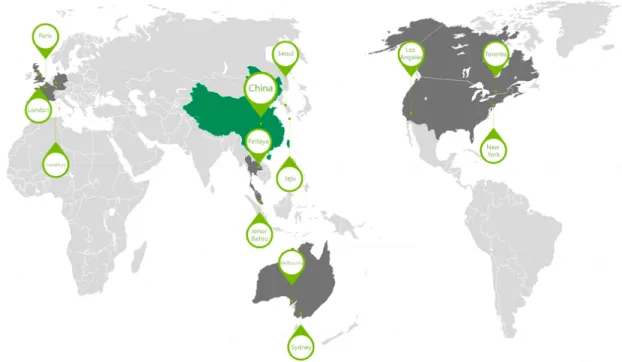
Greenland is an example. By 2016, it had successfully entered 13 cities in nine countries across the globe, including the US, Australia, Canada, and the UK. It has experienced
steady growth in market expansion and the increasing maturation of its business model. Currently, Greenland has 15 overseas development projects, 5.76 million square meters in development area, and RMB 124 billion in total overseas investments. In addition to its business scale, Greenland also has made solid progress in overseas revenue, with RMB 3 billion operating income in 2013 and RMB 15.3 billion in 2015. The company expects an income of RMB 30 billion income for 2016.
Figure 12: Greenland’s Global Real Estate Development map Data Source: Greenland Group
Table 1: Greenland Global Real Estate Development Projects
Project Location GFA
Square Meters Development Mix LA Greenland Center Downtown LA, USA 25,000 Three high-rise apartments, one hotel, retail amenity
NY Atlantic Plaza Brooklyn, NY, USA 64,500 Residential, retail
amenity
King Blue Condos Canada condos, apartments, and hotels Sydney Greenland Center Downtown Sydney, Australia
Site Area 3,969 Boutique apartments and a five-star hotel Sydney Greenland Lucent North Sydney Downtown, Australia - 200 residential apartments Melbourne Flemington Life Flemington horse racing area of Melbourne, Australia Site area 40,000 1,000–1,200 residences The RAM Residence Southwest London, UK
Site area 30,000 High-rise apartments,
affordable housing, and retail amenity London Greenland
Center
Thames riverbank, London, UK
Site Area 3,700 High-rise apartments Green Jeju
Healthcare Town
Jeju, Korea 390,000 Medical service,
shopping mall, resort, residential Sea Stars in
Pattaya
Pattaya, Thailand - Resort and
apartments Greenland Jade
Palace in Johor Bahru
Johor, Malaysia - Residential, service
apartment, hotel, and retail amenity
Data Source: Greenland Group
LandSea, which is a boutique developer, is also a good example. It focuses on green technology in residential developments in the PRC, and it continued its concentration in
the US market where it focused on young, affluent buyers in gateway cities. Since 2013, it has established a local team that is responsible for four cities on the west and east coasts of the US, with an existing investment portfolio in San Francisco (SF), Los Angeles (LA), New York City (NY), and Boston.
b) Conglomerates
Conglomerates such as Fosun Group, Hainan Airline Group (HNA), and Wanda are the most active. Compared with developers, conglomerates have more capacity to handle large deals and strategic operations in cross-sector synergy and in capital markets. An example is HNA’s Hilton deal. HNA announced the acquisition of an approximate 25% equity interest in Hilton from Blackstone, with the aim of establishing a long-term strategic investment in Hilton and Hilton's planned spin-offs of Park Hotels and Resorts and Hilton Grand Vacations. The transaction was valued at approximately $6.5 billion, or $26.25 per share in cash, and the transaction is expected to close in 2017 Q1. The HNA Group’s profile reveals the strategic synergy purposes of this real estate transaction. Founded in 1993, the HNA Group is a global Fortune 500 company that focuses on tourism, logistics, and financial services. In recent years, the HNA Group has evolved from a PRC regional airline based on Hainan Island to a global company with over USD 90 billion in assets, USD 30 billion in annual revenues, and 200,000 global employees, primarily in North America, Europe, and Asia. HNA has invested in and operates nearly 2,000 hotels with over 300,000 rooms in key cities. It also operates 1,250 aircraft that carry over 90 million passengers to 260 cities worldwide.
Fosun’s 100% investment in Japan’s real estate investment platform IDERA Capital Management in 2014 is a good example of capital market synergies. Recently IDERA Capital worked with Mitsui & Co., Ltd. to establish the cooperative entity, the MIRAI Corporation, and it obtained approval for listing its investment units on the real estate trust market of the Tokyo Stock Exchange. With this series of movements, Fosun opened the door to Japan’s real estate capital market. Hence, it could list its Asian real estate
portfolio and even commercial properties in the PRC in Japan’s Real Estate Investment Trust (REIT) market. Because of differing regulations and tax law, there is not a real REIT currently existed although exchange houses have already issued several
experimental securitization products. However, PRC developers can form or purchase REITS by offering possibilities in overseas markets such as Singapore, HK, and Japan.
c) Insurance Companies
Insurance companies in the PRC played a significant role in core and trophy asset acquisitions in cosmopolitan cities. NY and London are key targets, and office buildings and hotels are two highly favored assets.
Ping An is a first mover. Its acquisition of Lloyd’s Building for GBP 260 million from Commerzbank was a milestone because it was the first deal of a PRC insurance company in a global allocation. The deal had a higher-than-market-average net yield of 6.1% because of the shorter-than-market-average term remaining on the lease. The deal was marketed by Savills in the UK, and Ping An was represented by Gaw Capital, an HK-based boutique real estate PE, which served as deal advisor and separate account asset manager for Ping An. Ping An made a second move in 2015 with Gaw Capital in London through the acquisition of Tower Place, an office building in the financial area EC3, at Euro 419 million. The transaction counterparty was an open-ended European real estate fund. After that deal, Ping An also partnered with China Life—another PRC insurance giant—and Tishman Speyer in investing in the Lux Residential project in Boston.
China Life is a low-key but strong player, which is mainly because it is state-owned. It commands the biggest insurance capital fund in the PRC with total assets of more than 2 trillion by end of 2015. It is one of the most active players in the global market. China Life Investment Holding is the professional investment and asset management arm of the group. The team has closed several material core deals in the US and the UK, including three grade A office buildings in the City of London and Canary Wharf, one prime office building in the core area of mid-town Manhattan, a logistic portfolio in the US partnering
with GLP, a Singapore-based logistics fund, and a hotel portfolio in the US partnering with Starwood Capital.
The current global investment of insurance companies in the PRC is only beginning according to Cushman and Wakefield. The top five insurance companies have just
allocated under 2% of their total asset under management (AUM), and the full allocation of an additional USD 240b billion can be expected. In practical terms, a rise in average allocations nearly 5% by 2019 is foreseeable, which is equivalent to an additional USD 73 billion in investments, which could increase by a further USD 75 billion by 2024.
d) State-Owned Commercial Banks, Asset Management Companies, and Sovereign Wealth Funds
State-owned commercial banks, such as Industrial and Commercial Bank of China (ICBC) and Bank of China (BOC), are the most active commercial banks overseas. BOC
established its overseas commercial banking business in 1929, and ICBC has more than 20 years of experience in overseas business. These commercial banks are mostly lenders, especially to the PRC State Strategy One Belt One Road Area. For instance, from 2009 to 2015, the BOC drew down USD 148 billion in debts to support PRC enterprises’ offshore investments. Buyout loans or development loans are typical. Overseas lending requires domestic collateral because guarantees are a competitive and valuable service. PRC enterprises always find it hard to apply for bank loans from offshore banks if they do not have a strong financial position in the target country. Domestic collateral and guarantees were also used as a method of contributing offshore equity in some cases of overseas core asset buyouts by state-owned insurance companies.
The biggest four state-owned asset management companies (AMC) in the PRC are Hua Rong, Chang Cheng, China Orient, and Cinda. The big four were established in the late 1990s to digest the non performing loans (NPLs) of the big four PRC commercial banks in the last Asian financial crisis. During the last 20 years of rapid economic growth, such companies were turned around, and they became fully financial licensed asset
management platforms. The total AUM of both Hua Rong and Cinda exceeded RMB 1 trillion in 2016. Among the big four, AMC, Cinda, and China Orient are the most active in global real estate markets. Cinda invested in Cindat, a PRC-based real estate private equity specialized in leading PRC capital in global real estate markets. The platform has invested over USD 1.3 billion of equity capital in more than USD 6 billion in projects in the US, the UK, Australia, and other countries. China Orient also poured funding into several deals in Manhattan. It holds a majority stake in four Flatiron office buildings controlled by the Kaufman Organization, and it has a 49% interest in the building at 61 Broadway in the financial district.
Sovereign Wealth Funds include the China Investment Incorporation (CIC) and the State Administration of Foreign Exchange (SAFE), which is publicly owned, but it manages part of the foreign exchange in PRC.
Part 2: A Practical Discussion: Investment Preference, Strategy, Tax Considerations, and Regulatory Problems
2.1 Equity Investment Strategy
a) City Selection: Gateway Cities, the First Choice for Risk and Image Considerations
Gateway cities are always the first choice and the most preferred destinations for PRC investments, especially large deal seekers, such as insurance companies, state-owned AMC, SWF, developers, and conglomerates. Global metropolises or Tier-1 cities, such as New York, London, and Sydney, are the top three preferred cities in developed countries. From the perspective of PRC investors, controllable risk is a major consideration,
especially in state-owned enterprises and insurance companies. Another reason that PRC investors prefer Tier-1 cities is the landmark effect: sometimes landmark deals or trophy deals can be a decision-making factor for the top decision makers.
In 2015, New York was the top investment destination. PRC buyers deployed USD 5.78 billion in the city, which was approximately five times the amount deployed in 2014. This trend continued in 2016 when the deployment volume reached USD 4.17 billion in the first half of 2016. In 2015, Sydney (including transactions in Melbourne) was the second most frequent investment destination, attracting USD 3.8 billion. Interest in London has been strong since 2012, but it fell behind New York and Sydney (including Melbourne) in 2015. This decrease was not due to reduced interest but because fewer large targets were available in 2015. In addition, the yield decreased after the transaction surge as we are in the third consecutive year of transaction growth since 2013. In 2016, the trend was increasing because the volume of deployment volume in the first half of the year already approached the annual amount for 2015. However, the market panic in response to British Exit (BRIEX) and the British Pond (GBP) crash created a new window for PRC buyers in the second half of 2016.
Figure 13: PRC investment in London, New York, Sydney, and Melbourne 2010–2015 Source: Real Capital Analytics
Manhattan is an example of a gateway city preferred by PRC investors. Among all the foreign capital invested in the US real estate market in 2015, only 34% was in Manhattan. However, in 2015, of the PRC capital invested in the US, approximately 53% was in Manhattan. This difference shows that PRC investors favored Manhattan compared with other cities in the US. In 2016, transactions in New York City, the majority of which were Manhattan deals, constituted 80% of the total volume of transactions in the US.
25 33 868 2949 2535 1829 1700 150 895 200 2376 1088 5137 4166 120 347 179 1472 3323 4337 1487 0 1000 2000 3000 4000 5000 6000 2010 2011 2012 2013 2014 2015 2016 H1 London New York Sydney & Melbourne
Figure 14: Top 10 Markets for All Cross-border Real Estate Investment in US Data Source: Real Capital Analytics
Figure 15: PRC Investor US transaction values 2015 Data Source: Real Capital Analytics
52.30% 37.50%
2.80%
Manhattan Other Cities Los Angeles Chicago
Figure 16: H1 PRC Investor US Transaction Values 2016 Data Source: Real Capital Analytics
b) New Growth Point Exploration: Cap Rate and Submarkets
Although gateway cities are targets of investment, since 2015, an increasing number of PRC investors complained that it was hard to deploy capital in these cities because cap rates had compressed to drag deals down below investment hurdles, especially those PRC PE and real estate investors who typically sought greater than 15% net internal rate of return (IRR) distributed back to PRC after cross-border tax losses and cost. Unlike big insurance and conglomerate players, PE and real estate funds tend to explore new growth locales where cap rates are not compressed by the over-deployment of capital and job growth trends are reliable in the foreseeable future, especially when with regard to office and multifamily opportunities. For example, in the US market Tier-2 and Tier-3 cities, such as Dallas, Charlotte, and Washington DC became target markets in 2016.
80.00% 11.00%
3.00%
Figure 17: New Growth Cities in the US Data Source: KPMG and RCA
From the perspective of property type, there is overall decline in average cap rates and yields in the developed market. For example, in the US, since 2011, with the exception of hotel assets, the cap rates of all product types have drifted downward with a total decline around 150bp as the market became increasingly overheated.
Figure 18: US Overall Cap Rate Trend for All Property Types 2009–2016 Data Source: Real Capital Analytics
Therefore, for PRC investors, a key issue concerns finding fractional opportunities in the submarkets of each property type. Although the overall average cap rates are lower than expected for all property types, in some market segments or niche markets, the cap rates and returns are still above investment hurdle. Examples are non-core office buildings, low-rise garden apartments, limited service economy hotels, and so on.
Figure 19a: US Office Market Fractional Cap Rate* Figure 19b: US Apartment Market Fractional Cap Rate** Data Source: Real Capital Analytics
*The chart shows that the cap rates for office buildings in non-CBD submarkets dropped from 7.9% to 6.7% since 2011, while the cap rates for office buildings in CBD dropped from 6.6% to less than 5.5%.
** The chart shows that the cap rates for garden apartments dropped from 6.5% to 5.6% since 2011, while the cap rates for mid- and high-rise apartments dropped from 6.2% to 4.6%.
Figure 20a: US Hotel Market Fractional Cap Rate* Figure 20b: US Hotel Market Fractional Cap Rate**
Data Source: Real Capital Analytics
*The chart shows cap rates for limited service hotel recently are in the same level with 2011, while cap rates for full service had a volatility increase from 7.4% to 8% since 2011.
** The chart shows cap rates for economic, selective service full service and luxury hotels were around 9%, 8%, 7.8%, and 7.0% since 2011, while cap rates for mid- and high-rise apartments dropped from 6.2% to 4.6%.
c) Asset Type and Investment Strategy Selection
Asset type preferences generally vary from buyer to buyer, the main reasons for which are business synergies and the strategy matching of risk and return. Insurance companies are an example. Core assets, such as office buildings and hotels with stable income in key locations of gateway cities, are the favorite targets of PRC insurance companies. Ping An and China Life, the two biggest buyers, started their global move into core office
buildings in London, and China Life expanded its office portfolio in London to three towers. An Bang and Sunshine Insurance became famous for luxury hotel acquisitions in Manhattan, and China Life closed a four-star portfolio deal in 2016. Mature office
buildings and branded hotels in key global cities such as London and New York are fixed income portfolios with low risk. Such targets are the assets preferred by China’s
Insurance Regulatory Committee (CIRC), which regulates all insurance companies in the PRC.
For PRC developers, PE, and real estate funds, sites with development potentials or projects under development are typical targets. PE, real estate funds, sites, and projects under development are typical targets of PRC developers. Developers prefer such targets as it’s a natural global expansion for their domestic business; private equity and funds prefer such targets as opportunistic strategy has a much better average IRR than stabilized core assets have.
Figure 21: Major Real Estate Equity Investment Strategy Data Source: Private Equity Real Estate (PERE)
According to the findings of Preqin’s research on the strategic preferences of PRC-based institutional investors, the two most favorable real estate investment strategies worldwide are opportunistic and value-added.
Figure 22: PRC-Based Institutional Investor Strategy Preferences* Data Source: Preqin Database
* The chart shows PRC-based institutional investors’ real estate investment strategy preference; 80% of them prefer the opportunistic strategy and 62% prefer the value-added strategy in real estate investment.
2.2 Debt Investment Strategy: A New Deployment Opportunity
a) The Opportunity
In continuing the discussion about cap rate shrinkage, the equity investment strategies described in section 2.1 are expanded to explore the possibility of debt investments.
According to the data from Real Capital Analytics (RCA), commercial property prices are approaching cyclic highs as cap rates and yields are compressed to the same level as in 2007, which was the eve of the global financial crisis. This compression leaves equity investors with narrower returns. However, compared with the overheating equity market, a safer debt market can be envisioned in the real estate sector. Currently, the average Debt Service Coverage Ratio (DSCR) is close to 1.7, showing more risk cushion in the average loan originated now than in the pre-crisis peak when the DSCR was 1.3.
42% 31% 53% 16% 80% 62%
In these periods, the different average DSCR levels are mainly due to changes in lenders’ optimism levels and risk tolerance for property income realizing. In 2007, loans against pro forma income were commonly accepted; currently, the origin of the average loan \ focuses on demonstrating sufficient current income. Therefore, current commercial real estate (CRE) lenders are safer than lenders prior to the crisis although equity holders face similar market overheating.
Figure 23: Current Debt Service Coverage Ratio Data Source: Real Capital Analytics
The regulatory landscape changed and tightened in the post-crisis era. In early 2015, the Basel III regulation targeting high volatility commercial real estate (HVCRE) came into effect in most banks. The regulation requires banks with over $500 million in assets, as well as all savings and loans institutions, to set aside increased capital against certain construction and development loans. This new regulation forced banks to be more discerning than ever because they can offer loans only to familiar property owners or developers with strong ties, track records, and financial strength. Even with a good project, a newly founded sponsor team will have difficulty obtaining good loan, especially a construction loan, from traditional lenders. They may have to turn to alternative lenders, such as pension funds, private equity funds, and life insurance
companies to fill funding gaps with higher blended loan rates or preferred equity returns. In addition to HVCRE, the risk retention rule, which took effect in December 2016, will
also affect the traditional CRE lending model. The rule will implement the risk retention requirements in the Dodd-Frank Act and apply them to the CMBS and permanent loan market. The risk retention rule requires that the originator retains 5% of every new deal or that it designate a B-piece buyer to assume that risk. It is believed that relevant loan rates will be driven up significantly, decreasing the amount of traditional originations. Four years ago, large banks originated 90% of the CMBS volume. However, a decrease in volume to 65% of the previous level was observed during 2016. Alternative capital market participants, such as the boutique PE fund Grass River, are currently trying to be involved in the CMBS funding business by taking the risk retention requirement of 5% and filling the funding gap, and some are seeking capital support from the PRC.
For the above reasons, new debt investment opportunities have been generated in the market as increasing numbers of developers and commercial property owners seek alternative lenders. They are willing to pay higher effective loan rates or accept preferred equity returns, while an increasing number of equity investors are also seeking safer investment strategies in the overheating market. For PRC investors, the situation also means the increased potential to participate in US real estate market.
b) A Good Match for HNWI Asset Allocation
Debt strategy investments can also be a good match for PRC HNWI overseas asset allocation.
According to joint research by the Boston Consulting Group and the Xing Ye Bank on the PRC’s Private Banking Global Asset Allocation overseas allocation by private high-wealth investors in the PRC will increase from RMB 5.4 trillion in 2015 to RMB 18.8 trillion by 2020, that is, by more than three times in five years.
Figure 24: PRC HNWI Overseas Allocation
Data Source: Boston Consulting Group and Xing Ye Bank
Highly wealthy private Chinese investors can be divided into four groups.
1. Ultra HNWI with investable private wealth over RMB 100 million 2. Super HNWI with investable private wealth from RMB 30 million to 100
million
3. HNWI with investable private wealth from RMB 6 million to 30 million 4. Affluent individuals with investable private wealth from RMB 1.5 million to 6
million
Group 1 and Group 2 of private wealth in the PRC are served by traditional, tailored fortune management services, while Group 3 and Group 4 clients are usually served by Internet asset management platforms. With regard to overseas asset allocation, 32% of all four groups of private wealth in the PRC have not made a decision, 41% decided to allocate part of their assets in overseas markets, while 27% already have allocated their assets overseas. 75 91 113 128 144 162 180 200 5.4 8.1 10.9 13.6 16.3 18.8 0 50 100 150 200 250 2013 2014 2015 2016 2017 2018 2019 2020
Figure 25: PRC HNWI Classification
Data Source: Boston Consulting Group and Xing Ye Bank
With regard to risk and return preferences, around 78% of the four groups of highly wealthy private investors expected low- and mid-risk products yielding annual returns between 5% and 12%. Among them, 57% preferred a return of 5% to 8% return with no risk of principal loss, 21% preferred a return of 8% to 12% return with a maximum risk of 5% of the loss of principal.
Figure 26: PRC HNWI Investment Return Expectations Data Source: Boston Consulting Group and Xing Ye Bank
According to several surveys by Boston Consulting Group and Xing Ye Bank in 2016, individual investors in the PRC showed the greatest affinity for real assets and fixed income products because of perceived moderate risks and the facility of wealthy people in the PRC to understand investment logic: the real estate boom has been the key driver of fortunes being made in their home country. As cap rates and yields are dragged increasingly lower in gateway cities in the US, the UK, and the Asia Pacific, some experienced investors in the PRC are becoming increasingly cautious about taking equity positions, considering the rapid changes in return and risk since 2015. Some are
considering border debt opportunities in the real estate sector, especially in the US market, because of the above regulatory opportunities, returns, and risk matching, as well as tax efficiencies. For example, some are considering mezzanine loan and preferred equity investment positions in projects in key locations in gateway cities. In these kinds of debt investment opportunities, the risk cushion provided by sponsor equity will be 20% to 30%. Typical returns could be around 6% to 8% for mezzanine loans with a higher upside for preferred equity. According to some real cases in the market at the end of 2016, investors found some opportunities with returns greater than 12% in mezzanine positions in projects during the construction stage but with very promising sales expectations because of extraordinary locational premiums in cities such as New York, San Francisco, and Los Angeles.
Figure 27: Mezzanine Loan and Preferred Equity vs. the Traditional Equity Investment Position
2.3 Tax Issues in Cross-border Deals
2.3.1 Equity Investment Tax Structure
Tax considerations are always among the most pressing issues for PRC investors. Compared with the UK, the tax structure in the US is more complicated for overseas investors. Typically, a US deal will incur an IRR drop of 3% to 5% because of the loss in cross-border taxes by a PRC investor without any overhead tax deduction in the US. Four types of tax structures are commonly used by PRC buyers to balance their tax losses in equity investments.
a) Levered US Corporate Blocker
The simplest and most common tax structure for PRC companies is the levered US corporate blocker. Typically, the PRC-owned company will set up a US blocker corporation directly, and use it to hold property or real assets in the US. There are sometimes additional layers between the US blocker and the asset, such as senior loan and mezzanine loan borrowing entities and equity pledge vehicles.
With a US blocker, no US tax will be borne by the PRC buyer during the acquisition stage. During the operating stage, the US blocker will be subject to federal income tax of 35% on its worldwide taxable income, including income it receives from the US property. State and local corporate income taxes are typically 5% to 9%, but a detailed figure is applied based on the location of the property. For income tax deduction purposes, the structure can include a
shareholder loan arrangement from the PRC company to the US blocker so that the shareholder loan interest can be deducted before the income tax. However, US blockers can deduct only the interest on a PRC company’s shareholder loan when the interest is distributed back to the PRC. In practice, the amount of the
shareholder loan and interest deducted is limited under US law. According to data collected in my interviews, a shareholder loan of 50% on total investment is a
common arrangement for tax deduction purposes. In addition to the income tax, distributions up to the amount of the US blocker’s current and accumulated earnings and profits are treated as dividends that are subject to federal
withholding tax. Distributions exceeding current and accumulated earnings and profits are treated as a return of capital and are not subject to federal withholding tax. Originally, interest and dividend payments to a foreign corporation were generally subject to a federal withholding tax of 30%, but because of the US–PRC Tax Treaty, PRC investors can now enjoy a reduced withholding tax rate of 10%. When the investment arrives at the exit stage, the US blocker is subject to a federal income tax of 35% on capital gains from the sale of the property.
Typically, there is an arrangement to liquidate the US blocker following the sale of the property so that proceeds to the PRC company will not be subject to federal withholding tax. However, if the company sells shares of the US blocker without disposing of the property, it is subject to a federal income tax on capital gains. However, strata-titled sales projects such as condo buildings will not accrue capital gain income tax at the end because the property title will be sold to each condo buyer gradually without a one-time disposal.
Figure 28: Leveraged US Corporate Blocker Tax
b) Leveraged US Corporate Blocker with Offshore Limited Partnerships (LP)
The PRC buyer sometimes requires flexibility in redeploying globally in building up a global allocation platform. In this case, an offshore LP will be arranged between the PRC and US blocker. If the offshore LP can be deemed a tax
transparent entity under US law, such as a BVI LP or other LP structure registered offshore (e.g., Bermuda), the US tax that the PRC buyers will be subject to is the same as in the simple leveraged blocker structure. In the offshore LP structure, the liquidation proceeds from the US blocker can be redeployed to other jurisdictions without the need to repatriate them to the PRC.
Figure 29: Leveraged US Corporate Blocker with Offshore LP Data Source: Discussions with Experienced Interviewees
c) US Real Estate Investment Trust (REIT) Structure
For commercial property acquisition, PRC investors may prefer the US REIT tax structure. Compared to the US blocker structure, the US REIT structure uses its dividends paid to deduct its taxable income and to reduce income tax to zero. To
the extent that the US REIT has income from capital gains, distributions this tax structure may be treated as capital gain dividends. The US REIT structure is more tax efficient than the US blocker structure is because there are no federal and state income taxes. However, in the US REIT tax structure, when the PRC company sells its shares, federal income tax of 35% on the capital gain from the sale will be applied. Furthermore, a 100% tax on the capital gain from the sale of property may apply if the sale is treated as a prohibited transaction.
Figure 30: US Real Estate Investment Trust (REIT) Structure Data Source: Discussions with experienced interviewees
d) US Domestic Controlled (DC) REIT Tax Structure
This hybrid structure balances the pros and cons of the US blocker and the US REIT. Under this structure, the PRC investor may take a dividend payment deduction and reduce the taxable income to zero. Taxable income can also be reduced by using shareholder loan arrangements. The US-PRC treaty can also be applied to reduce the withholding tax to 10%. In addition, the ordinary dividend received by the PRC company will not incur US tax. The PRC company is also not subject to any tax if it sells its shares under the US REIT tax structure.
the US REIT takes taking a controlling position domestically, the US blocker can also liquidate before repatriating to the PRC without being subject to any
withholding tax. However, this hybrid structure has the same disadvantages as the US blocker and the US REIT tax structures.
Figure 31: US Domestic Controlled REIT Tax Structure Data Source: Discussions with Experienced Interviewees
2.3.2 Debt Investment Tax Structure:
With regard to debt investments in the US, tax arrangements can be more efficient by seeking a portfolio-interest exemption and by balancing the costs and taxable net income of the US blocker, which is the US taxpayer entity in the whole cross-border structure. The cross-border debt investments of PRC companies in US real estate are relatively new. For discussion purposes, the following is a summary of a potential tax-efficient structure that is designed to be suitable for HNWIs.
Under this structure, PRC HNWIs can commit their money in a US offshore LP structure such as a British Virgin Islands (BVI) partnership structure. A US asset management company serves as the general partner. The partnership structure is arranged to yield a greater number of voting rights to the management team, or it can stipulate that the LP will have a majority economic interest, such as 95% without significant voting rights, while the GP will have 5% economic interest with 100% of the voting rights. In the US blocker, a shareholder loan and equity is arranged according to the investor’s preference. However, if the debt-to-equity ratio is held under 1.5:1, and if the US blocker holds an equity position of no more than 10% of the project, the loan (e.g., mezzanine loan or preferred equity) from the US blocker can be deemed to qualify for the portfolio-interests exemption, so that the withholding tax owed by the lending activity can be reduced from 30% to 0%. When the US blocker makes distributions back to the BVI’s partnership, an asset management fee will be charged by the US asset management entity in order to recover part of the income tax payable by the US blocker. If the investment strategy is based on pure debt without holding any equity or preferred equity in the Property Co, the US blocker can be used to lend to different projects. However, if there is an equity position in the deal, the US blocker has to be liquidated before the last distribution for every single project, or an additional capital gain tax will be triggered by the cross-border distributions.
Figure 32: A Possible Debt Investment Tax Structure According to the Discussions Data Source: Discussions with Experienced Interviewees
2.4 Regulation Issues in Cross-border Deals
a) Background of PRC Capital Outflow Regulations
Beginning in the second half of 2015, several signals were sent to show that the PRC government would take strict measures to tighten its control and supervision of outbound investments, especially in certain industries. However, it is not certain when and how much such control will be fully implemented. According to the interviewees, because of governmental control, some major outbound
insurance players had to use offshore funding pools instead of their original plans to use the PRC’s funding pool to close large real estate deals in early 2016. Such tightening is mainly due to the surge in the PRC’s capital net outflow and the subsequent downward pressure on the RMB.
According to State Administration of Foreign Exchange of China (SAFE), the country recorded capital and financial account deficits of USD 712 HML in 2016 Q3. Capital flows in China averaged -337.36 USD HML from 1998 until 2016, reaching an all-time high of 95.16 USD HML in the fourth quarter of 2013 and a record low of -1305.58 USD HML in the fourth quarter of 2008. In 2016 Q3, one of the biggest single drops occurred since the financial crisis. According to Goldman Sachs, the PRC’s capital outflow problem is bigger than that monitored by SAFE, which is based only on onshore foreign exchange settlements. Because there is guidance from the central bank to limit dollar conversions onshore, some investors are moving the money overseas directly in RMB. For example, official data of SAFE showed that $27.7 billion in RMB payments left China in August 2016 compared to the monthly average of $4.4 billion in the five years through 2014. Such large cross-border moves cannot be explained by market-driven factors, and they need to be taken into account in measuring recent unusual PRC capital outflows.
Figure 33: PRC Capital Flow Trend 1998–2016
Data Source: State Administration of Foreign Exchange, China
Figure 34: Offshore RMB deposit amounts trend 1998–2016
Until the end of Q3 2016, the RMB weakened by 3.3% against the USD, the highest loss among Asian currencies. Bloomberg® also predicted a further
decline of 0.5% in Q4 2016. The PRC’s USD 3.2 trillion foreign exchange reserve, which is the world’s largest foreign exchange reserve fund, shrank by USD 323 billion in Q3 because the People’s Bank of China (PBOC) had to sell dollars to limit the decline in the RMB.
Therefore, the PRC government faces a challenge in the currency war, which also means that it is likely to be strict in controlling outbound investment.
b) Updated Regulations
In late November 2016, the PRC government released the Notification on Further Clarifications of Overseas RMB Loans by Domestic Enterprises, which is also called Circular 306. In this circular, the PRC government stated its aim to restrict the arbitrage activities of companies that convert offshore RMB into foreign currencies and engage in the shorting of offshore RMB while the government tries to stabilize the RMB exchange rate. Circular 306 also introduced some new regulations, including the requirements of obtaining pre-approval for overseas RMB loans, restricting equity ownership between debtors and creditors, restricting the net outflow amount of RMB, and tightening the control over intentional breaches of loan agreements.
With the publication of Circular 306, the State Administration of Foreign Exchange (SAFE) simultaneously adopted certain internal rules to reduce the maximum amount of overseas repatriation by companies established in China (including both domestic companies and foreign investment enterprises) from USD 50 million to USD 5 million. In addition, face-to-face interview approvals by SAFE officers are required for all overseas transfers by companies established in China with USD 5 million or more in capital accounts. These internal rules not only impose new restrictions on offshore investments by PRC companies but also
apply to funds transferred between PRC subsidiaries and their offshore parent companies and affiliated companies.
Subsequently, on 16 December 2016, a public statement was issued by the Multi-State Authorities, the National Development and Reform Commission (NDRC), the Ministry of Commerce (MOFCOM), the PBOC, and SAFE. These officials jointly held a press conference and stated that the government would encourage and support domestic companies with the ability and the opportunity to make real and legal outbound investments and to participate in projects relating to the One Belt and One Road strategy. However, with regard to “irrational” investment activities in real estate, hotels, film studios, entertainment and sports clubs, the attitude of the government would be “alert.” In the statement, the officials clearly indicated significant concern about overseas investment projects involving the following:
(i) Large investments in businesses that are not related to the core business of the domestic investor
(ii) Outbound investments made by limited partnerships
(iii) Investment in offshore targets with asset values larger than those of the PRC buyer
(iv) Projects with very short investment periods
According to the PRC government’s administration, a series of concrete and detailed regulations and policies will be published soon to follow the above announcement of the new regulations. It is believed that the authorities whose mission is to approve outbound investment projects will increase their scrutiny in the approval process with regard to the source of the investment funds, the qualification of the domestic investment entities, and the quality of the overseas investment target. They are expected conduct thorough reviews of additional documents, the supporting investment objectives, the estimated investment returns, and the rationale for the investment.
Part 3: New Trends and the Outlook for PRC Cross-border Real Estate Investment
3.1 From the Trial Stage to the Sustainable Investment Stage
a) Experience in Decision Making
With regard to PRC outbound investment activities in real estate, 2013 can be deemed a milestone because the majority of significant institutional investors took substantial first steps in the global market. After three years, they had learned much about the typical practices in global markets, especially in gateway cities. Most importantly, most collected realistic post-investment information regarding the progress of their projects.. Some of these initial investments went smoothly, while others encountered several issues, such as permission and entitlement, development cost overruns, project financing issues, sales/leasing progress lower than expectations, and so on. Some of these problems were solved with additional time and effort while others necessitated early exits. From 2013 to 2016, these experiences provided PRC investors with important lessons learned.
Post-investment issues in operations also helped investment teams and investment committees (IC) in headquarters in China to understand the markets, structure deals, and control risks in transaction negotiations. According to the discussions with the interviewees, PRC investors consequently pay attention to making rational investment decisions. Previously, they relied on investment opportunities because overseas deals were perceived as trophy deals by ICs. However, before the IC approvals are granted, they now pay much more attention to the business and investment rationale, macro and micro perspectives, market analysis, design of the agreement mechanism, feasibility of sales expectations, and leasing programs.
We believe that in the next three to five years, PRC investors will move to a sustainable investment stage in global real estate markets, and their deals will be more sophisticated than those made in this initial experimental stage will.
b) Global Team Establishment
Evidence of the sustainability of future outbound investment is indicated in the attention that PRC investors now are paying to establishing overseas teams in addition to the core investment team at their headquarters. In previous years, because most PRC investors did not have a stable global business presence, they had to rely on their business partner, GP, or co-investor to execute the investment. After making several deals, they found that passive remote participation afforded weak protection for their investment, especially in opportunistic and value-add projects. Therefore, in 2015 there were new initiatives in overseas team
recruitment and establishment. China Life established offices in London and Manhattan. After several acquisitions, more than one arm of the HNA Group opened offices to handle their real estate business in Manhattan. Developers such as Greenland and LandSea expanded their US company by hiring locally.
In Greater China, major players are hiring professionals experienced in overseas markets to enhance their central investment team at their headquarters. Some have restructured their global business unit by moving the central investment team to HK in order to have better links to investment opportunities across the globe. Because of such changes in human resources, global capital will flow more smoothly than previously.
c) Deal Sourcing Mode and Partnership
When PRC investors made their first or second overseas deals, they were not familiar with global market practices and deal sourcing channels. Hence, they had to rely agents that had multinational deal communication teams and branches, such as the traditional global real estate agents Jones Lang LaSalle, CBRE, DTZ