HAL Id: hal-02989177
https://hal-univ-rennes1.archives-ouvertes.fr/hal-02989177
Submitted on 5 Nov 2020
HAL is a multi-disciplinary open access
archive for the deposit and dissemination of sci-entific research documents, whether they are pub-lished or not. The documents may come from teaching and research institutions in France or abroad, or from public or private research centers.
L’archive ouverte pluridisciplinaire HAL, est destinée au dépôt et à la diffusion de documents scientifiques de niveau recherche, publiés ou non, émanant des établissements d’enseignement et de recherche français ou étrangers, des laboratoires publics ou privés.
Filtering of a Ricker wavelet induced by anelastic
seismic wave propagation and reflection
Stephan Ker, Yves Le Gonidec
To cite this version:
Stephan Ker, Yves Le Gonidec. Filtering of a Ricker wavelet induced by anelastic seismic wave propagation and reflection. Journal of Geophysics and Engineering, IOP Publishing, 2020, 17 (5), pp.838-851. �10.1093/jge/gxaa033�. �hal-02989177�
Journal of Geophysics and Engineering (2020) 17, 838–851 doi:10.1093/jge/gxaa033
Filtering of a Ricker wavelet induced by anelastic
seismic wave propagation and reflection
Stephan Ker 1,*and Yves Le Gonidec2
1IFREMER, Géosciences Marines, Centre de Brest, 29280 Plouzané, France 2Univ Rennes, CNRS, Géosciences Rennes, UMR 6118, 35000 Rennes, France *Corresponding author: Stephan Ker. E-mail:[email protected]
Received 9 April 2020, revised 28 May 2020 Accepted for publication 17 June 2020
Abstract
A varying Q factor with depth induces modifications of seismic wave features due to anelastic propagation but also reflections at the discontinuities. Standard signal analysis methods often neglect the reflection contribution when assessing Q values from seismic data. We have developed an analytical quantification of the cumulative effects of both the propagation and reflection contributions by considering Kjartansson’s model and a seismic plane wave at normal incidence on a step-like discontinuity. We show that the cumulative effects are equivalent to a frequency filter characterised by a bandform and phase that both depend on the ratio between the elastic and anelastic contrasts. When considering this filter applied to a Ricker wavelet, we establish an analytical expression of the peak-frequency attribute as a function of propagation and reflection properties. We demonstrate that this seismic attribute depends on the anelastic contrast, which cannot be neglected when assessing Q factors: the error in Q estimate is not linearly dependent on the anelastic contrast and we establish an analytical expression for the case where this contrast is weak. An unexpected phenomenon for a step-like interface is an increase in the peak frequency that is observed when the anelastic and elastic contrasts have opposite signs, with a constraint on the anelastic propagation properties. This behaviour allows for assessment of the elastic and anelastic parameters.
Keywords: seismic attenuation, Q factor, anelasticity, seismic data analysis
1. Introduction
In the framework of exploration seismology, wave propa-gation in attenuating media has been extensively studied to understand amplitude loss, frequency content reduction and phase distortion induced by anelastic processes (Kolsky 1956; Futterman1962; Toksöz & Johnston1981). Over the last decades, intensive research efforts have been dedicated to the quantification of seismic attenuation through the estimate of the quality factor Q (Dasgupta & Clark1998; Reine et al.2009; Tary et al.2017), the attenuation compen-sation of seismic data through Q-inverse filtering methods (Wang2002,2008), Q compensation in migration (Wang 2008a; Dutta & Schuster 2014; Zhu et al. 2014; Li et al.
2016) and seismic inversion (Causse et al. 1999; Innanen & Lira2010; Brossier2011; Innanen2011). Most of these studies focused on the attenuation effects on a seismic wave during its propagation in an anelastic medium, which can be characterised by a Q factor varying with depth. However, it has been shown that Q-contrast effects may also affect the seismic wave during its reflection by an anelastic reflector (White1965; Bourbié & Nur1984; Lines et al.2014). This contribution is commonly neglected in analytical modelling. Developing quantitative analyses that takes into account the effect of anelastic propagation and reflection contribu-tions on seismic waves remains of first-order importance in the understanding and exploitation of reflected seismic
838 © The Author(s) 2020. Published by Oxford University Press on behalf of the Sinopec Geophysical Research Institute. This is an Open Access article distributed under the terms of the Creative Commons Attribution License (http://creativecommons.org/licenses/by/4.0/), which permits unrestricted reuse, distribution, and reproduction in any medium,
data. Currently, frequency-dependent seismic anomalies observed on seismic data have been attributed to strong absorptive reflection coefficients associated with contrasts of both P-wave velocities and Q factor properties between two layers (Chapman et al.2006; Odebeatu et al.2006; Ker et al. 2014; Wu et al.2015). In particular, the P- and Q-contrasts are negative/negative or positive/negative for seismic re-flectors associated with carbonate reservoirs (Adam et al. 2009; Takam Takougang & Bouzidi2018), rocks saturated with heavy oil (Gurevich et al.2008) and hydrate bearing sediments (Guerin & Goldberg2005; Marin-Moreno et al. 2017). To explain such absorptive reflection coefficients (Castagna et al.2003), different mechanisms can be con-sidered in the framework of anelastic, i.e. viscoelastic (Lam
et al.2004; Borcherdt2009; Zhao et al.2018) or poroelastic (Chapman et al.2006; Quintal et al.2009) wave propagation. In the case of anelastic interfaces, White (1965) intro-duced the concept of absorptive reflection and Bourbié & Nur (1984) experimentally identified pure anelastic reflec-tion respectively associated with a Q-contrast between two anelastic layers. Lines et al. (2014) confirmed these obser-vations by developing innovative laboratory experiments. The motivation in studying anelastic reflections, related to the imaginary part of the complex seismic impedance con-trolled by the quality factor (White1965; Lines et al.2008; Morozov2011), is better interpreting reflected wave ampli-tude (Bourbié & Nur1984) and phase rotation (Lines et al. 2014). But these studies do not deal with an anelastic upper layer, i.e. anelastic propagation is not considered before the reflection and the impact of the Q-contrast magnitude on the reflected wave is still not quantified. A full understanding of the impact of both anelastic propagation and reflection on an incoming seismic wave has not been provided yet and constitutes the aim of this work.
We develop an analytical analysis to quantify the cumula-tive effects of both the propagation and reflection contribu-tions by considering Kjartansson’s model and a seismic plane wave at normal incidence on a step-like discontinuity. In sec-tion2, we review the anelastic seismic wave propagation and reflection associated with the constant-Q model (Kjartans-son1979) that is widely used in seismic modelling, inversion and analysis (Morgan et al.2012; Chen et al.2018; Ker et al. 2019) and we revisit these wave phenomena in terms of frequency filtering. We develop a comprehensive analysis by introducing new constitutive parameters, related to both propagation and reflection. In section3, we present the filter related to the cumulative effects of both anelastic propaga-tion and reflecpropaga-tion and describe its frequency behaviour. In section4, we investigate the effect of this cumulative filter on a seismic source signal approximated by a Ricker wavelet and develop analytical descriptions of peak-frequency pa-rameters to quantify the wavelet shape distortions induced by the cumulative filter. This investigation provides some
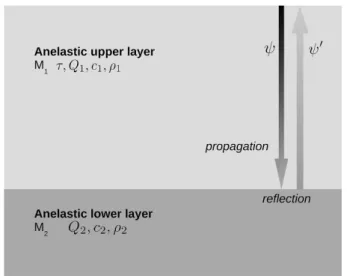
Figure 1. Step-like reflector defined by two homogeneous anelastic lay-ers: an anelastic propagation of a normal plane incoming wave in the upper layer and an anelastic reflection of the wave at the discontinuity.
insights and pitfalls related to the use of the peak-frequency attribute when estimating Q values or interpreting seismic data.
2. Frequency filters associated with anelastic propagation and reflection
2.1. Principles of the approach
We assume a 1D plane-wave seismic propagation and a step-like reflector defined between two anelastic layers M1 and
M2(figure1). As a consequence, a reflected seismic wave𝜓′
is the result of two contributions induced on the incoming wave 𝜓, i.e. (i) a propagation in the upper anelastic layer and (ii) a reflection at the anelastic interface. To develop a quantitative analysis of these effects, our proposed method consists of defining frequency filters (bandform and phase) associated with these two contributions in terms of both modulus and phase expressed in the frequency domain.
2.2. Modulus and phase associated with the anelastic propagation contribution
Seismic propagation occurs in the upper anelastic layer M1
characterised by a density 𝜌1, a reference velocity c1 and a quality factor Q1. The attenuation quantified by Q1induces
a complex P-wave velocity v∗1(𝜔), which depends on the angular frequency𝜔 of the seismic wave. Based on Kjartans-son’s model (Kjartansson1979), v∗1(𝜔) can be expressed as a function of Q1and c1according to:
v∗1(𝜔) = c1 ( 𝜔 𝜔h )1 𝜋arctan 1 Q1[ 1−i tan ( 1 2arctan 1Q1 )]−1 , (1)
where the reference angular frequency𝜔h ensures the com-pliance with the Kramers–Kröning dispersion relation and corresponds to the highest frequency of the seismic source frequency content (Wang & Guo2004; Wang2008b). In the following, we consider the approximate form of the complex velocity: v∗1(𝜔) ≃ c1 ( 𝜔 𝜔h ) 1 𝜋Q1 [ 1 + i 2Q1 ] , (2)
which induces an error lower than 1.5% for a quality factor larger than 5. According to this approximation, the phase ve-locity and attenuation associated with the real and imaginary parts of the complex wavenumber k∗1 = 𝜔∕v∗1(𝜔), respec-tively, can be used to highlight that the anelastic propagation acts as a filter defined by the modulus Mp(𝜔) = exp(−2Q𝜔𝜏
1) and the phase Pp(𝜔) = 𝜏𝜔(1 − (𝜔𝜔
h )−
1
𝜋Q1) where𝜏 is the travel time in the upper anelastic layer M1.
By introducing the ratio:
Γ = 4Q1
𝜋𝜏 , (3)
which has the dimension of a frequency, and assuming
𝜋Q1 >> 1, we can finally write:
Mp(𝜔) = exp ( − 2𝜔 𝜋Γ ) , (4a) Pp(𝜔) = 4𝜔 𝜋2Γln ( 𝜔 𝜔h ) , (4b)
which highlights that the anelastic propagation in the upper layer acts as a filter that depends on the frequency parameter Γonly. This means that the filter related to the anelastic propagation is unchanged when both the travel time and the attenuation proportionally increase or decrease.
The frequency response of the filter associated with wave propagation in the upper anelastic layer is described by the partial derivatives of both the modulus and phase with respect to the angular frequency𝜔. This is given as:
𝜕Mp(𝜔) 𝜕𝜔 = − 2𝜋ΓMp(𝜔) , (5a) 𝜕Pp(𝜔) 𝜕𝜔 = 4𝜋2Γ ( ln ( 𝜔 𝜔h ) + 1 ) , (5b) and highlights that the modulus is a monotonous decreasing function of𝜔, with a limit value of
MPh = exp ( −2𝜔h 𝜋Γ ) . (6)
Additionally, the phase reaches a minimum value:
PP
m = − 4𝜔h
e𝜋2Γ, (7)
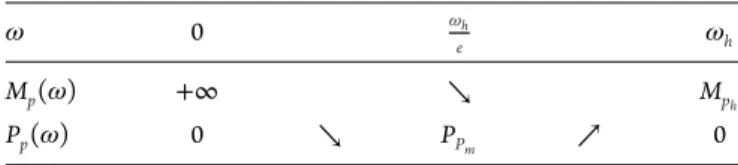
Table 1. Frequency behaviour of the filter associated with anelastic propagation (modulus Mpand phase Pp).
𝜔 0 𝜔h
e 𝜔h
Mp(𝜔) +∞ ↘ Mph
Pp(𝜔) 0 ↘ PPm ↗ 0
this occurs at the angular frequency𝜔h∕e where e = exp(1)
(Table1). This means that the anelastic propagation acts as a low-pass filter associated with a frequency-dependent phase rotation.
2.3. Modulus and phase associated with the anelastic reflection contribution
The seismic reflection that occurs at the anelastic interface is modelled by a step-like discontinuity between the up-per anelastic layer M1 where the seismic wave propagates, and a lower anelastic layer M2 characterised by a density
𝜌2, a reference velocity c2 and a quality factor Q2. Similar
to M1, M2 is associated with a complex P-wave velocity
v∗2(𝜔) ≃ c2(𝜔𝜔 h ) 1 𝜋Q2[1 + i 2Q2
] and the reflection coefficient can thus be expressed as:
R∗(𝜔) = 𝜌2c2 ( 𝜔 𝜔h )𝜂 𝜋( 1 + i 2Q2 ) − 𝜌1c1 ( 1 + i 2Q1 ) 𝜌2c2 ( 𝜔 𝜔h )𝜂 𝜋( 1 + i 2Q2 ) + 𝜌1c1 ( 1 + i 2Q1 ), (8) where we introduce the parameter
𝜂 = 1
Q2 − 1Q1, (9)
that quantifies the anelastic contrast between the two layers. To understand the filtering effects induced by the anelas-tic reflection coefficient on a normal incident plane wave, both the modulus and phase of R∗have to be expressed ana-lytically. Such developments require expressing the anelastic reflection coefficient as the sum of its real and imagery parts. To do so, we use the decomposition R∗(𝜔) = RE+ RA(𝜔) established by Bourbié & Nur (1984) where
RE = 𝜌2c2− 𝜌1c1 𝜌2c2+ 𝜌1c1
, (10)
represents the elastic impedance contrast that depends on the velocity and density parameters, and
RA(𝜔) = 𝜂 2𝜋ln ( 𝜔 𝜔h ) + i𝜂 4, (11)
represents the anelastic contribution that is complex and depends on𝜂 (equation (9)) and frequency. By introducing
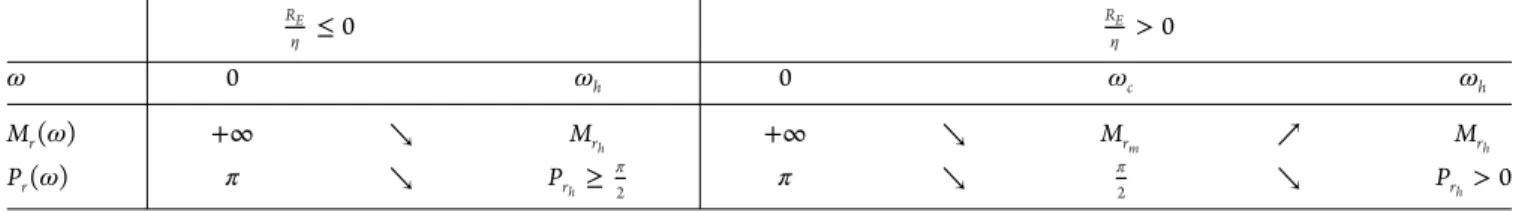
Table 2. Frequency behaviour of the filter associated with anelastic reflection (modulus Mrand phase Pr). RE 𝜂 ≤ 0 RE 𝜂 > 0 𝜔 0 𝜔h 0 𝜔c 𝜔h Mr(𝜔) +∞ ↘ Mrh +∞ ↘ Mrm ↗ Mrh Pr(𝜔) 𝜋 ↘ Prh≥ 𝜋 2 𝜋 ↘ 𝜋 2 ↘ Prh> 0 the parameter: D (𝜔) = RE 𝜂 + 12𝜋ln ( 𝜔 𝜔h ) , (12)
this allows the reflection coefficient R∗to be expressed as:
R∗(𝜔) = 𝜂D + i𝜂
4, (13)
which tends to REas𝜂 approaches 0 as expected for an elastic reflector. As a result, it is now straightforward to establish analytical formulations of the modulus Mr=
√
R2
x+ R2y
and phase Pr= atan2(Rx, Ry) of the reflection coefficient
R∗ = Rx+ iRy: Mr(𝜔) = |𝜂| 4 √ 1 + 16D2(𝜔), (14a) Pr(𝜔) = atan2 (1, 4D (𝜔)) . (14b) These equations highlight that an anelastic reflection acts as a complex frequency filter that depends on both the anelastic contrast𝜂 and the ratio RE∕𝜂 between the elastic
and anelastic contrasts.
The frequency response of the filter associated with the reflection on an anelastic interface is described by the partial derivatives of both the modulus and phase with respect to the angular frequency𝜔. We can show that
𝜕Mr(𝜔) 𝜕𝜔 = 𝜂 2D (𝜔) Mr(𝜔) 2𝜋𝜔, (15a) 𝜕Pr(𝜔) 𝜕𝜔 = − 𝜂2 8𝜋𝜔M2 r(𝜔) , (15b)
where the modulus increases or decreases with𝜔 depending on RE∕𝜂 and the phase is a monotonous decreasing function of𝜔. The asymptotic values of the partial derivatives when
𝜔 tends to 0 are +∞ and 0, respectively, and Mr h = |𝜂|4 √ 1 + ( 4RE 𝜂 )2 , (16a) Pr h = atan2 ( 1, 4RE 𝜂 ) , (16b)
when𝜔 tends to 𝜔h(Table2). This means that the frequency filter associated with an anelastic reflection is asymmetric with respect to RE∕𝜂 whereby:
- if RE∕𝜂 ≤ 0, the modulus and phase are monotonous
decreasing functions of𝜔: the anelastic reflection acts as a low-pass filter, the phase response is nonlinear and ranges between an opposite and quadrature phase; - if RE∕𝜂 > 0, the modulus is characterised by an
ex-tremum, i.e. Mrm = |𝜂|∕4, that is located at the critical
angular frequency 𝜔c= 2𝜋𝜔hexp ( −2𝜋RE 𝜂 ) , (17)
and is associated with a quadrature filter. At lower and higher frequencies, the modulus decreases and increases with 𝜔, respectively, i.e. the anelastic reflection is not a simple low-pass filter and acts as a complex attenuating filter, ranging between an opposite and in-phase response.
3. Cumulative effects induced by anelastic propagation and reflection
3.1. Modulus and phase associated with the anelastic propagation contribution
The frequency filter that takes into account both a seismic propagation in an upper anelastic layer and a reflection by an anelastic interface is the cumulative frequency filter. It is defined by the following modulus M and phase P:
M (𝜔) = Mp(𝜔) Mr(𝜔) , (18a)
P (𝜔) = Pp(𝜔) + Pr(𝜔) . (18b)
The global filter is characterised by a frequency-dependent phase rotation because Pp(𝜔) has a minimum located at the
angular frequency𝜔h∕e and Pr(𝜔) is a monotonous
decreas-ing function of 𝜔: additive contributions of the anelastic propagation and reflection effects occur when 𝜔 < 𝜔h∕e
and the opposite occurs when 𝜔 > 𝜔h∕e. The frequency response of the phase can thus be assessed analytically based on equations (5b) and (15b).
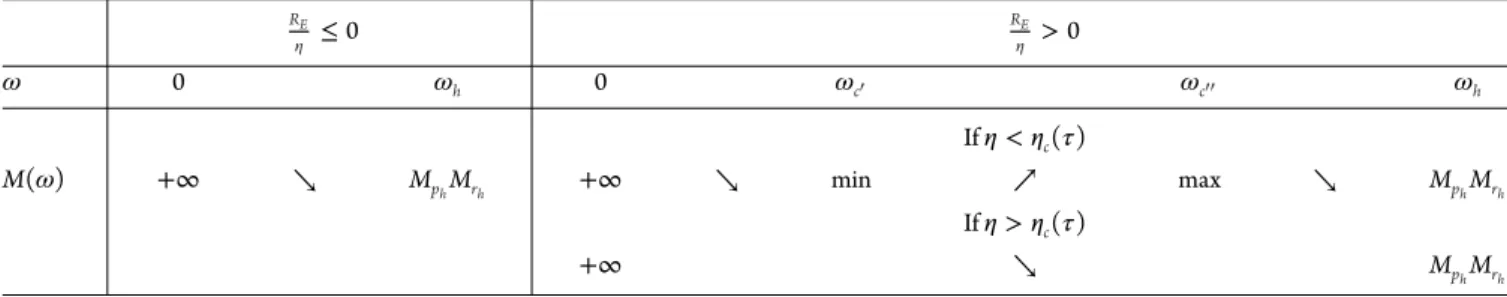
Table 3. Frequency behaviour of the filter associated with anelastic reflection (modulus M and phase P). RE 𝜂 ≤ 0 RE 𝜂 > 0 𝜔 0 𝜔h 0 𝜔c′ 𝜔c′′ 𝜔h If𝜂 < 𝜂c(𝜏) M(𝜔) +∞ ↘ MphMrh +∞ ↘ min ↗ max ↘ MphMrh If𝜂 > 𝜂c(𝜏) +∞ ↘ MphMrh
Similarly, the cumulative filter is characterised by a frequency-dependent modulus but the frequency response defined as 𝜕M (𝜔) 𝜕𝜔 = Mp(𝜔) 𝜕Mr(𝜔) 𝜕𝜔 + Mr(𝜔) 𝜕Mp(𝜔) 𝜕𝜔 (19)
does provide straightforward analytical solution. The fre-quency response depends on RE∕𝜂 and its behaviour can be
summarised as follows (Table3):
- if RE∕𝜂 ≤ 0, Mpand Mr are both monotonous de-creasing functions of the angular frequency𝜔, i.e. the cumulative filter is equivalent to a low-pass-filter with additive contributions of the anelastic propagation and reflection effects;
- if RE∕𝜂 > 0, Mpis still a monotonous decreasing
func-tion of𝜔 but Mris characterised by a minimum value
Mr
m located at the critical frequency𝜔c. The number of roots for equation (19) depends on the physical parameters. Consequently, a numerical solution is re-quired if further quantitative analysis is to be performed, allowing the descriptions reported in Table3.
A numerical application with realistic values of the phys-ical parameters is now performed to quantitatively assess the contributions of both the anelastic propagation and reflection in the frequency domain for different elastic RE and anelastic𝜂 contrasts.
3.2. Numerical investigation
The aim of the numerical evaluation, performed over a large range of physical parameters, is to quantify the frequency filtering effects that include both the anelastic propagation and reflection contributions.
For the anelastic propagation contribution, we consider
Q1 = 100 and 𝜏 = 100 ms, which corresponds to Γ = 1273
Hz. The attenuation (20 log Mp) and the phase Ppare
repre-sented as functions of the normalised frequency fn = 𝜔∕𝜔h in the frequency bandwidth 0–150 Hz (figures2a and3a). For the anelastic reflection contribution, which depends on
RE∕𝜂, we determine the attenuation (20 log Mr) and phase
Pr for three elastic reflection coefficients RE = −0.025, 0
and 0.025 and 𝜂 ranging from 0 to 0.2 with Q1 = 100 (figures 2b1–3 and 3b1–3). Note that changing Q1 to a
lower value while keeping𝜂 constant only affects the propa-gation contribution, both in amplitude and phase according to equations (4a) and (4b), but does not affect the reflection contribution. The case RE= 0 corresponds to a pure anelas-tic reflection induced by the constant-Q contrast only: for instance, when𝜂 ≃0.1, the attenuation is about 30 dB. Note that this is similar to the attenuation of 32 dB associated with the pure elastic case𝜂 = 0 with RE = ± 0.025. The cumu-lative effects of both the anelastic propagation and reflection are solved numerically to display the attenuation (20 log M) and P (figures 2c1–3 and 3c1–3) of the cumulative filter.
As expected by the previous analytical developments, (i) the filter associated with the anelastic propagation is equi-valent to a low-pass filter with a frequency-dependent phase rotation, (ii) the filter associated with the anelastic reflection is equivalent to a low-pass filter with a frequency-dependent phase rotation when RE≤ 0 and characterised by a critical frequency when RE> 0, and (iii) the cumulative filter is
equivalent to a low-pass filter with a frequency-dependent phase rotation when RE≤ 0. The numerical investigation
highlights three main effects induced by the interaction of the propagation and reflection contributions when RE> 0:
(i) it removes the critical frequency𝜔cwhen𝜂 > 𝜂cwhere
𝜂cis a critical value of𝜂 above which the modulus of the
cu-mulative filter becomes a monotonous decreasing function of the frequency (𝜂c≃0.11 in the present case), (ii) modifies
𝜔cinto𝜔c′when𝜂c′ < 𝜂 (figure2c3, solid line) and (iii)
in-duces a second critical frequency𝜔c′′ > 𝜔c′when𝜂c′′ < 𝜂c′ (figure 2c3, dot-dashed line). We show that these critical curves (𝜔c′,𝜂c′) and (𝜔c′′,𝜂c′′) depend on𝜏 (figure4) and as
a result, the cumulative filter modulus can be characterised by zero, one (case 𝜏 → 0) or two critical frequencies, i.e. the filter can be a low-pass, a band-pass or a high-pass filter depending on𝜂 and 𝜏 when RE> 0 (figure2c3).
This result means that for some particular cases, high fre-quencies of a seismic signal may be less attenuated than low frequencies when anelastic reflection is taken into account: this unexpected behaviour is controlled by the sign of the parameter D described in equation (12). These quantita-tive analyses are of first importance to better understand
Figure 2. (a) Modulus spectrum associated with the anelastic propagation contribution (normalised frequency fn= 𝜔∕𝜔h). Modulus spectra associ-ated with the anelastic reflection contribution for a negative (b1), null (b2) and positive (b3) RE. (c1, c2 and c3) Modulus spectra associated with the
cumulative effects of both the anelastic propagation and reflection for the three REvalues. The dashed curves follow the critical frequency𝜔c(equation (17)) associated with the anelastic reflection contribution. The critical value𝜂cis indicated with a black star. The solid and dot-dashed curves follow the
minimum and maximum amplitude values, respectively (numerical solution).
the effects of both the anelastic propagation and reflection phenomena on seismic signals.
4. Anelastic effects induced on a seismic source
4.1. Peak-frequency attributes associated with a Ricker source wavelet
In this section, we investigate the effect of the cumulative fil-ter associated with both anelastic propagation and reflection on a seismic signal by approximating the seismic incoming signal𝜓(t) with a Ricker wavelet. This wavelet, widely used to model a seismic source in geophysical prospecting (Wang 2015a), is a zero-phase signal expressed in the frequency domain by Wang (2015a):
Ψ (𝜔) = √2𝜔2 𝜋𝜔3 p exp ( −𝜔2 𝜔2 p ) , (20)
where𝜔p = 2𝜋FP, with FP the peak frequency defined as the frequency associated with the maximum amplitude of Ψ(𝜔). The peak frequency can be analytically described in the framework of propagation effects of anelasticity (Zhang
& Ulrych2002; Tary et al.2017) for evaluating the Q factor. The present work extends these developments by including the reflection contribution. This cannot be undertaken when considering the central frequency (Wang2015a), which can only be solved numerically. The use of the peak frequency constitutes a quantitative support for seismic analysis to better understand the physical phenomena discussed in the present study.
The signal𝜓′(t) measured after a seismic propagation of the Ricker wavelet through the anelastic upper layer and a reflection at the anelastic interface is defined by the modulus
M′(𝜔) = Ψ(𝜔)M(𝜔) and the phase P(𝜔). The peak fre-quency FPis changed into the peak-frequency attribute F′p
de-fined as the solution𝜔′p= 2𝜋Fp′of 𝜕M𝜕𝜔′ = 0 (Ker et al.2012; Wang2015b). In the following, the amplitude A′pand phase
𝜁′
p of 𝜓
′
(t) at Fp′ are the peak-frequency attributes used as complementary attributes in the present quantitative analysis of the wavelet distortion induced by the anelastic processes. The shape changing of the seismic wavelet, during propaga-tion in the upper anelastic layer and reflecpropaga-tion at the interface with the lower layer, is implicitly considered in the present an-alytical solution. The peak-frequency attribute is influenced
Figure 3. (a) Phase spectrum associated with the anelastic propagation contribution (normalised frequency fn= 𝜔∕𝜔h). Phase spectra associated with
the anelastic reflection contribution for a negative (b1), null (b2) and positive (b3)RE. (c1, c2 and c3) Phase spectra associated with the cumulative effects of both the anelastic propagation and reflection for the three REvalues. The dashed curves follow the critical frequency𝜔c(equation (17))
associated with the quadrature filter induced by the anelastic reflection contribution. The solid curve follows the quadrature filter induced by both the anelastic propagation and reflection (numerical solution).
by the increasing asymmetry of the amplitude spectrum of the reflected wavelet generated by both propagation and re-flection filters. In addition, the phase attribute𝜁p′is influenced by the effect of the wavelet shape changing induced by the cu-mulative filter on the phase spectrum of the reflected wavelet. Based on the analytical developments presented in the previous section, we show that the peak-frequency attribute of the reflected signal associated with a Ricker seismic source wavelet is given by Fp′ = Fp ⎛ ⎜ ⎜ ⎝ √ F2 p Γ2 + 1 + B (𝜔) − Fp Γ ⎞ ⎟ ⎟ ⎠ , (21)
where the parameter
B (𝜔) = 𝜋1 4D (𝜔)
1 + 16D2(𝜔), (22)
quantifies the contribution of the anelastic reflection coeffi-cient. We can show that B ranges between ±1∕2𝜋. Equation (21) can be solved numerically but to develop an analytical expression, we consider that B(𝜔) is dominated by the contribution of the peak-frequency attribute Fp
p related
to the anelastic propagation, i.e. B(𝜔) ≃ B(𝜔p
p) where 𝜔pp = 2𝜋FPpis the solution of 𝜕(ΨMp) 𝜕𝜔 = 0. We show that Fpp= Fp ⎛ ⎜ ⎜ ⎝ √ F2 p Γ2 + 1 − Fp Γ ⎞ ⎟ ⎟ ⎠ ≤ Fp. (23)
The present work focuses on the impact of the anelastic contrast 𝜂 on the peak-frequency modification and thus requires analysing 𝜕F
′ p
𝜕𝜂 by fixing Q1 in the upper layer, i.e.
we investigate the behaviour of F′pwith changes of Q2only.
The limit F′p∞when Q2tends to 0, which corresponds to𝜂
tending to infinity, is outside the validity range of the present work but a rough estimate is given in the Appendix. When Q2
tends to Q1, which corresponds to𝜂 tending to 0, we show
that the limit is Fp0′ = Fp
p. This analysis is limited to a Q2 value between 0 and Q1 as results associated with negative
𝜂 values are identical to those obtained by changing the sign
of RE(i.e. the consequence of the dependency on the sign
of RE∕𝜂 as described in Section3). We demonstrate that the
Figure 4. Representation of𝜂c(black star),𝜔c′(solid curve) and𝜔c′′
(dot-dashed curve) for different travel times𝜏 ranging between 5 ms and 1 s in steps of 50 ms (numerical solution). When𝜏 tends to 0, the curve 𝜔c′tends
to the critical frequency𝜔c(equation (17)) associated with the anelastic reflection contribution (dashed curve).
partial derivative of Fp′in relation to Q2is expressed as
𝜕F′ p 𝜕Q2 = 2 𝜋 Q12 (Q2− Q1)2 Fp ( F′p Fp +Fp Γ )RE 1 − 16D2(𝜔 pp) 1 + 16D2(𝜔 pp) . (24) When RE ≤ 0, the peak frequency is monotonous and
Fp′ ≤ Fp
p, with an increasing trend with Q2 meaning that F
′
p
decreases with𝜂. For the case RE = 0, F′pis a constant similar
to F′p∞.
When RE> 0, F′p is not monotonous but characterised
by two extrema located at two particular Q2values. Only one
corresponds to Q2 < Q1and is expressed by
Fp′ e = Fp ⎛ ⎜ ⎜ ⎝ √ F2 p Γ2 + 1 + 12𝜋 − Fp Γ ⎞ ⎟ ⎟ ⎠ > Fp. (25)
It does not depend on REand is located at
𝜂e= RE ( 1 4− 12𝜋 ln ( Fpp Fh ))−1 . (26) When 0≤ 𝜂 ≤ − 2𝜋RE ln(Fpp∕Fh) , Fp′ increases from Fp p when 𝜂 = 0 up to F′
pe and then decreases to Fpp. Additionally, we note that F′p≥ Fpwhen { Q1 ≥ 𝜋2𝜏F p 𝜂−≥ 𝜂 ≥ 𝜂+ , (27) where𝜂±= RE( Q1± √ Q2 1−(𝜋2𝜏Fp) 2 4𝜋2𝜏F p − 1 2𝜋 ln( Fpp Fh)) −1. The
ex-istence of the unexpected phenomenon F′p≥ Fpassociated
with a step-like interface is based on the condition𝜏 < Q1
𝜋2F p, which deals with the anelastic propagation in the upper layer only.
For the peak-frequency attributes A′p and𝜁p′, we develop analytical expressions in relation to Q2, i.e. with𝜂 when Q1
is fixed based on approximations detailed in the Appendix and used here. The analysis predicts that A′pis a monotonous increasing function of𝜂 if RE ≤ 0, but is characterised by an
extremum if RE > 0, located at RE( −𝜋 8 ln(Fpp Fh) − 1 2𝜋ln( Fpp Fh)) −1
which differs from 𝜂e. The analysis also predicts that 𝜁p′
decreases or increases monotonically with 𝜂 from 𝜁p∞′ to
𝜁pp(see Appendix) if RE< 0 or RE> 0, respectively, and is similar to𝜁p∞′ if RE= 0.
4.2. Numerical applications to quantify the anelastic Ricker wavelet distortions
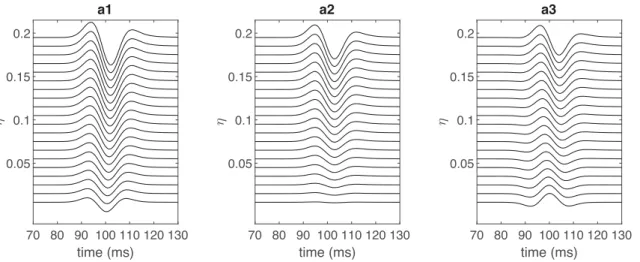
The analytical expressions developed previously allow gen-eral considerations of the Ricker wavelet distortion induced by the anelastic processes. To illustrate the results, we con-sider the following parameters: the peak frequency of the Ricker source wavelet is FP= 50 Hz, RE = −0.025, 0 and
0.025, Q1= 100 and 𝜏 = 100 ms. We determine the reflected seismic signal as a function of𝜂 in the range [0; 0.2], which corresponds to a Q2range of [5; 100], both in the time and frequency domains (figures 5 and 6). Note that because the Ricker frequency content is theoretically unlimited, the reference upper frequency Fh has to be defined in order to be able to perform the analyses. In practice, this may be controlled by a threshold on the signal-to-noise ratio: an arbitrary threshold of 0.3 % corresponds to Fh= 150 Hz.
When𝜂 tends to 0, the waveform associated with RE< 0 (figure5a1) is in the opposite phase with the one associated with RE> 0 (figure 5a3), which is similar to the shape of
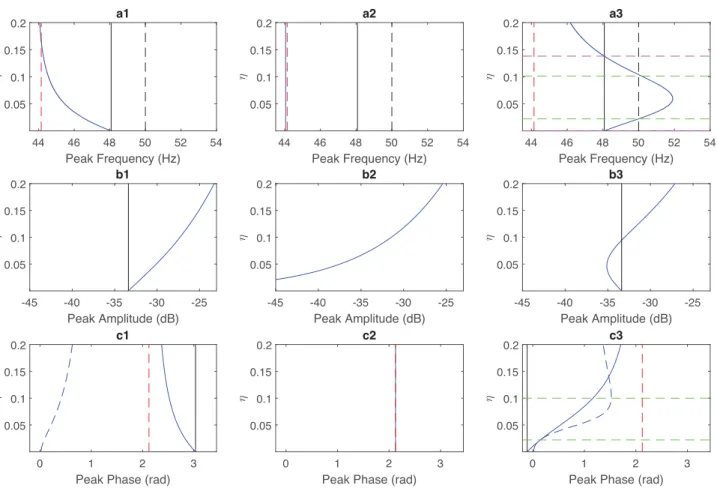
the Ricker source wavelet, and for RE = 0 (figure5a2), the amplitude of the waveform tends to 0. When 𝜂 increases to 0.2, reflected waveforms for the three cases look similar but strongly differ for intermediate𝜂 values. This behaviour is quantified by the associated modulus and phase spectra displayed with respect to𝜂 (figure6), in accordance with the analytical results developed in the previous section. In partic-ular, the peak-frequency attribute F′p(figure6, blue curves) decreases monotonously with 𝜂 when RE< 0, is constant
when RE= 0 and is characterised by an extremum when
RE> 0 where Fp′ can be larger than Fp (figure 6, dashed-black lines). It is interesting to note that (i) measuring
F′p> Fpmeans that both RE> 0 and 𝜂 are between 𝜂c′and
𝜂c′′ (figure 7a1, dashed-green lines), with the condition
70 80 90 100 110 120 130 time (ms) 0.05 0.1 0.15 0.2 a1 70 80 90 100 110 120 130 time (ms) 0.05 0.1 0.15 0.2 a2 70 80 90 100 110 120 130 time (ms) 0.05 0.1 0.15 0.2 a3
Figure 5. Synthetic seismic signals associated with a 50 Hz Ricker source wavelet after a propagation in an anelastic layer and a reflection by an anelastic reflector according to the equivalent cumulative filter (figures2and3) for a negative (a1), null (a2) and positive (a3) elastic impedance contrast RE.
Figure 6. (a1–3) Modulus spectra of the signals displayed in figure5associated with a Ricker source wavelet of peak frequency Fp= 50 Hz (dashed
line) modified into the attribute Fp′(equation (21)) by the anelastic cumulative filter for a negative (left), null (middle) and positive (right) RE. The solid
and dot-dashed-black curves follow the minimum and maximum amplitudes of the cumulative filter, respectively (numerical solution). (b1–3) Phase spectra of the signals displayed in figure5: a mask defined on the modulus spectrum by a threshold of −24 dB has been applied to focus on the main representative frequency content.
𝜏 < Q1
𝜋2F
p being satisfied, and (ii) whatever the value of RE, the peak frequency measured on the reflected signal is lim-ited to the range [44; 52 Hz] (figure7a1–3). This highlights relative changes of the peak-frequency attribute limited to [−8; 4%]. Importantly, 𝜂 can be assessed from F′p when
RE< 0 but uncertainties increase when F′ptends to 44 Hz. The two peak-frequency attributes associated with F′pare also used to quantify the Ricker wavelet distortions. First, the amplitude A′p(figure7b1–3, blue curves) increases with
𝜂 when RE ≤ 0, and is characterised by an extremum when
RE> 0. Amplitude variations are about 10 dB when RE≠ 0
and about to 20 dB when RE = 0. Second, the phase 𝜁p′
(figure7c1–3, blue curves) strongly depends on both𝜂 and the sign of RE: it highlights a phase rotation that decreases
with𝜂 in a limited range [2.5; 3 rad] when RE < 0, is constant to about 2 rad if RE= 0, and varies from in-phase to opposite
phase when RE> 0 in the range [−0.1; 1.7 rad]. As a result,
the phase of the cumulative filter significantly contributes to the variations in the reflected wavelet observed in the time domain (figure5).
It is important to remember that the phase spectrum of the reflected signal associated with a zero-phase Ricker source wavelet is given by the phase of the cumulative filter. In order to focus on the phase rotation around the main frequency content of the reflected signal, we apply a mask
44 46 48 50 52 54 Peak Frequency (Hz) 0.05 0.1 0.15 0.2 a1 -45 -40 -35 -30 -25 Peak Amplitude (dB) 0.05 0.1 0.15 0.2 b1 0 1 2 3
Peak Phase (rad)
0.05 0.1 0.15 0.2 c1 44 46 48 50 52 54 Peak Frequency (Hz) 0.05 0.1 0.15 0.2 a2 -45 -40 -35 -30 -25 Peak Amplitude (dB) 0.05 0.1 0.15 0.2 b2 0 1 2 3
Peak Phase (rad)
0.05 0.1 0.15 0.2 c2 44 46 48 50 52 54 Peak Frequency (Hz) 0.05 0.1 0.15 0.2 a3 -45 -40 -35 -30 -25 Peak Amplitude (dB) 0.05 0.1 0.15 0.2 b3 0 1 2 3
Peak Phase (rad)
0.05 0.1 0.15
0.2 c3
Figure 7. Seismic peak-frequency attributes (blue curves) associated with a Ricker source wavelet of peak frequency Fp= 50 Hz (dashed-black line)
modified by the cumulative filter for a negative (left), null (middle) and positive (right) RE. (a1–3) The peak-frequency attribute F′p(equation (21), blue curve) ranges between Fpp ≃ 48 Hz (equation (23), black line) and F
′
p∞(equation (32a), black line). Dashed magenta and green lines define the interval
where F′p≥ F′p
pand F
′
p≥ Fp(equation (27)), respectively. (b1–3) The amplitude attribute A ′
p(equation (31b), blue curve) associated withF ′
p: the black
line represents the amplitude of the modulus spectrum at the frequency Fpp. (c1–3) The phase attribute𝜁
′
p(equation (31c), blue curve) associated with Fp′: the black line represents the phase at the frequency Fppand the dashed blue curve represents the phase range (see figures6b1–3) with strong variations
located in the range F′p≥ Fp(dashed-green lines).
defined by an amplitude threshold, fixed here to −24 dB on the modulus (figure 6b1–3): the difference between the minimum and maximum values of the phase monotonously increase with 𝜂 when RE < 0 but is characterised by an
extremum when RE> 0 where most of the phase variations occurs between𝜂c′and𝜂c′′(figure7c1 and 3, dashed lines).
4.3. Discussions on the peak-frequency attribute: pitfalls and insights
As quantified by the numerical example described above, the second order contribution of the anelastic propagation can be neglected in most realistic cases, i.e. F
2 p
Γ2 << 1. This allows us to neglect the case where a seismic wave vanishes in the upper layer and considering Fpp ≃ Fp(1 −
Fp
Γ) and
Fp′ ≃ Fp(
√
1 + B − Fp
Γ) for sake of simplicity. Recall that
Γ = 4Q1∕𝜋𝜏.
The peak-frequency attribute F′p is commonly used to assess the quality factor Q1of the upper layer. The approach is based on the assumption that 𝜂 = 0, i.e. the anelastic contribution of the reflection is negligible. In this case, a first approximation consists in Fp′ ≃ Fp
pwhich allows relating Q1 and F′paccording to Q1 ≃
𝜋𝜏Fp
4(1−F′p∕Fp). But this relation induces errors when anelastic reflection is not negligible. Based on the present study, we are able to quantify the modification of
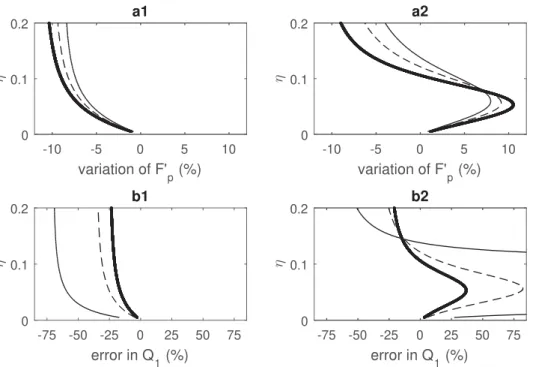
F′pwhen𝜂 is taken into account, and as a result, the impact on the Q1 assessment. The modification of Fp′with𝜂 relatively to Fpp is quantified by ΔF = (Fp′− Fpp)∕Fpp, which
high-lights a dependency with both𝜂, REand𝜏 (figure8a1 and 2),
and induces a relative modification of Q1quantified by ΔQ1 (figure8b1 and 2). When RE< 0, ΔF is negative and its
am-plitude increases with both𝜂 and 𝜏 by up to 10% (figure8a1): assessing Q1from Fp′, whose relationship is nonlinear, results
in an underestimation of 20% that increases to 75% at large
Figure 8. (a1–2) Modifications ΔF of the peak-frequency attributeF′p, relative to Fppassociated with a negligible anelastic contrast𝜂 = 0, as a function of𝜂 for a negative (left) and positive (right) elastic contrast RE. Results for different travel times𝜏 are displayed (0.1, 0.5 and 1 s as solid, dashed and bold
curves, respectively). (b1–2) Error in Q1estimate based on the peak-frequency attribute Fp′as a function of𝜂.
travel times (figure8b1). When RE> 0, ΔF is more complex (figure 8a2) and mainly induces an overestimation of Q1
(figure8b2): regardless of the value of𝜏, the minimum error occurs when𝜂 reaches the value − 2𝜋RE
ln(Fpp∕Fh)(see section4.1). To go beyond these particular numerical examples, it is interesting to observe the approximated linear depen-dency of ΔF with 𝜂 when 𝜂 is low. We can demonstrate that at large RE∕𝜂 values, i.e. roughly larger than unity,
F′p≃ Fp(1 +8𝜋R𝜂
E − Fp
Γ) and the modification of the
peak-frequency attribute can be approximated as
ΔF ≃ 𝜂 [ 8𝜋RE ( 1 − FΓp )]−1 . (28)
This result analytically predicts a significant modification of
F′peven at low𝜂 values. In addition, it also demonstrates a weak dependency with Q1and𝜏, quantified by Fp∕Γ, imply-ing a low contribution of the effects of the anelastic propa-gation in the relative modification ΔF of the peak-frequency attribute. Finally, we show that the error in assessing Q1 when𝜂 is low can be expressed by the approximation
ΔQ1 ≃ [ 8𝜋RE 𝜂 Fp Γ − 1 ]−1 =⎡⎢ ⎢ ⎣ 2𝜋2Fp𝜏 RE Q1 Q2 − 1− 1 ⎤ ⎥ ⎥ ⎦ −1 , (29) which is nonlinear in𝜂 and depends on Q1∕Q2. Note that
an underestimation of Q1 is expected if RE < 0 and that
according to equation (29), the error in Q1 increases when
FPdecreases. For example, the error is almost doubled when
FPdecreases from 50 to 30 Hz.
5. Conclusions
In the present work, we have quantified the effects induced by both anelastic propagation and reflection by performing an-alytical developments of the equivalent cumulative filter de-fined in the framework of Kjartansson’s model for a step-like reflector. In particular, the cumulative filter is characterised by an asymmetrical frequency behaviour that depends on the ratio RE∕𝜂 between the elastic reflection coefficient of
the reflector and the anelastic contrast between the upper and lower layers. In most cases, the cumulative filter acts as a low-pass filter in agreement with the classical understanding that higher seismic frequencies are more attenuated than low frequencies. The band- or high-pass behaviour occurs only for a limited range of source peak frequency,𝜂 parameter and travel time𝜏, and when the signs of 𝜂 and REare the same:
this unexpected behaviour constitutes a key result.
In order to quantify the impact of the cumulative filter on an incoming seismic wave at normal incidence, we have veloped analytical expressions for a Ricker source wavelet de-fined by a peak frequency. Because of the anelasic reflection, the reflected seismic signal is modified: its peak frequency and related amplitude and phase are used as attributes to quantify the distortions of the incoming source signal. We
show that the peak frequency depends on the sign of RE∕𝜂.
The effect of a negative ratio is to amplify both the shift of the peak frequency and the phase rotation induced by the anelas-tic propagation contribution. With a positive ratio, the effect is to decrease the shift of the peak frequency. We also high-light that the peak frequency can be larger than the source peak frequency, an unexpected phenomenon for a step-like interface controlled by the two critical frequencies of the cu-mulative filter when𝜏 < Q1
𝜋2F
p. The consequence of the cumu-lative filter is to introduce fluctuations in the peak frequency that cannot be explained by considering anelastic propaga-tion alone as is commonly assumed when estimating the Q factor from the peak frequency. For a 50 Hz Ricker source wavelet, the modification of the peak-frequency attribute rel-ative to the propagation contribution can be as high as 10%, with a strong impact when assessing the quality factor of the layer above the anelastic reflector. Errors arise as soon as𝜂 is not negligible and follow a nonlinear relationship with𝜂.
The accuracy of the Q value estimation based on the peak frequency of a seismic wave reflected by an anelastic reflector depends on many physical parameters, as analyt-ically demonstrated in this work that considered a Ricker wavelet. Consequently, estimating the quality factor of the upper layer from this seismic attribute alone is not a well-constraint inversion problem. A suggestion would be to consider further quantification in taking advantage of the full set of peak-frequency attributes introduced in this study in a simultaneous inversion scheme to assess both the elastic reflection coefficient and the constant-Q parameters defining the anelastic reflector.
Acknowledgements
We thank two anonymous reviewers for their comments that help us to improve this paper. We sincerely thank Shane Murphy for the revision of the English language.
Conflict of interest statement. None declared.
Appendix
Seismic attributes associated with the propagation in an anelastic layer with Γ =4Q1∕𝜋𝜏
Fpp = Fp ⎛ ⎜ ⎜ ⎝ √ F2 p Γ2 + 1 − Fp Γ ⎞ ⎟ ⎟ ⎠ = 𝜔pp∕2𝜋 < Fp, (30a) App = ||RE||Ψ(𝜔pp) exp ( −4Fpp Γ ) , (30b) 𝜁pp = ⎧ ⎪ ⎨ ⎪ ⎩ 8 𝜋 Fpp Γ ln (F pp Fh ) + 𝜋 : when RE≤ 0 8 𝜋 Fpp Γ ln (F pp Fh ) : when RE > 0 . (30c)
Seismic attributes associated with both an anelastic propagation and an anelastic reflection
Fp′ = Fp ⎛ ⎜ ⎜ ⎝ √ F2 p Γ2 + 1 + B(𝜔pp) − Fp Γ ⎞ ⎟ ⎟ ⎠ = 𝜔′ p∕2𝜋, (31a) A′p = 1 4Ψ(𝜔 ′ p) exp ( −4F ′ p Γ ) √ 𝜂2(1 + 16D2(𝜔 pp) ) , (31b) 𝜁′ p ≃ 8𝜋 F′p Γ ln ( Fp′ Fh ) + atan2(1, 4D(𝜔pp) ) . (31c)
Asymptotic limits when𝜂 tends to infinity
The limit when𝜂 is large is equivalent to Q2 tends toward 0 for Q1fixed in the upper layer. This is outside the validity
range of the approximations used in the present study but as a first estimate, the asymptotic limits of the peak frequency and phase attributes can be expressed by:
Fp∞′ = Fp ⎛ ⎜ ⎜ ⎜ ⎜ ⎝ √ √ √ √ √ √ √ F2 p Γ2 + 1 + 2 ln ( Fp p∕Fh ) ( 2 ln ( Fp p∕Fh ))2 + 𝜋2 −Fp Γ ⎞ ⎟ ⎟ ⎟ ⎟ ⎠ (32a) 𝜁′ p∞ ≃ 8𝜋 Fp∞′ Γ ln ( F′p∞ Fh ) + atan2 ( 1,2 𝜋 ln ( F′p∞ Fh )) . (32b) Behaviour ofF′pwithQ2 𝜕F′ p 𝜕Q2 = 2 𝜋 Q2 1 (Q2− Q1) 2RE𝜅, (33a) 𝜅 = ( Fp F′p Fp + Fp Γ )1 − 16D 2(𝜔 pp) 1 + 16D2(𝜔 pp) . (33b)
Behaviour ofA′pwithQ2: 𝜕A′ p 𝜕Q2 = A ′ pQ 2 1 (Q1− Q2)2RE [( 1 + 𝜅 𝜋2F′ p ) × ⎛ ⎜ ⎜ ⎜ ⎝ 16D ( 𝜔′ p ) 1 + 16D2(𝜔′ p ) − 16D ( 𝜔pp ) 1 + 16D2(𝜔 pp ) ⎞ ⎟ ⎟ ⎟ ⎠ + 16D ( 𝜔pp ) 1 + 16D2(𝜔 pp ) − 𝜂 RE ⎤ ⎥ ⎥ ⎥ ⎦ . (34)
The behaviour of the parameter D with the frequency is inversely proportional to the frequency and with Fp′ >> 1 similar in magnitude to Fpp, a first approximation consists in replacing D(𝜔′p) by D(𝜔pp), which gives
𝜕A′ p 𝜕Q2 ≃ A ′ pQ 2 1 (Q1− Q2) 2RE [ + 16D(𝜔pp) 1 + 16D2(𝜔 pp) − 𝜂 RE ] . (35) A minimum amplitude is located at the quality factor
1 Q1 − RE( 𝜋 8 ln(Fpp Fh) + 1 2𝜋 ln( Fpp Fh)) −1if R E > 0. Behaviour of𝜁p′withQ2 𝜕𝜁′ p 𝜕Q2 = −4Q12 (Q2− Q1) 2( 1 + 16D2(𝜔′ p) ) ×RE [ 1 + 𝜅 𝜋2F′ p − 4 𝜋2Γ𝜅 ( 1 + 16D2(𝜔′p) ) × ( 1 + ln ( F′p Fh ))] . (36)
By considering both Q1 >> 1 and 𝜏 << 1s, which cor-responds to a frequency Γ much larger than the seismic fre-quency, the behaviour of𝜁p′with Q2can be approximated to:
𝜕𝜁′ p 𝜕Q2 ≃ −4Q 2 1 (Q2− Q1) 2( 1 + 16D2(𝜔′ p) )RE [ 1 + 𝜅 𝜋2F′ p ] . (37) Since 𝜅 ranges between −1 and 1, the peak phase at-tribute increases or decreases monotonically with Q2 from
𝜁′
p∞(equation (32b)) to 𝜁pp (equation (30c)) when RE is negative or positive, respectively.
References
Adam, L., Batzle, M., Lewallen, K.T. & van Wikj, K., 2009. Seismic wave attenuation in carbonates, Journal of Geophysical Research, 114, B06208.
Borcherdt, R.D., 2009. Viscoelastic Waves in Layered Media, Cambridge University Press.
Bourbié, T. & Nur, A., 1984. Effects of attenuation on reflections: Experi-mental test, Journal of Geophysical Research, 89, 6197–6202.
Brossier, R., 2011. Two-dimensional frequency-domain visco-elastic full waveform inversion: parallel algorithms, optimization and performance,
Computers & Geosciences, 37, 444–455.
Causse, E., Mittet, R. & Ursin, B., 1999. Preconditioning of full-waveform inversion in viscoacoustic media, Geophysics, 64, 130–145.
Castagna, J.P., Sun, S. & Siegfried, R.W., 2003. Instantaneous spectral anal-ysis: detection of low-frequency shadows associated with hydrocarbons,
The Leading Edge, 22, 120–127.
Chapman, M., Liu, E. & Li, X.-Y., 2006. The influence of fluid-sensitive dispersion and attenuation on AVO analysis, Geophysical Journal
Inter-national, 167, 89–105.
Chen, H., Innanen, K.A. & Chen, T., 2018. Estimating P- and S-wave in-verse quality factors from observed seismic data using an attenuative elastic impedance, Geophysics, 83, R173–R187.
Dasgupta, R. & Clark, R.A., 1998. Estimation of Q from surface seismic reflection data, Geophysics, 63, 2120–2128.
Dutta, G. & Schuster, G.T., 2014. Attenuation compensation for least-squares reverse time migration using the viscoacoustic-wave equation,
Geophysics, 79, S251–S262.
Futterman, W.I., 1962. Dispersive body waves, Journal of Geophysical
Re-search, 67, 5279–5291.
Guerin, G. & Goldberg, D., 2005. Modeling of acoustic wave dissipation in gas hydrate-bearing sediments, Geochemistry Geophysics Geosystems, 6, Q07010.
Gurevich, B., Osypov, K., Ciz, R. & Makarynska, D., 2008. Modeling elas-tic wave velocities and attenuation in rocks saturated with heavy oil,
Geo-physics, 73, E115–E122.
Innanen, K., 2011. Inversion of the seismic AVF/AVA signatures of highly attenuative targets, Geophysics, 76, R1–R14.
Innanen, K.A. & Lira, J.E., 2010. Direct nonlinear Q-compensation of seismic primaries reflecting from a stratified, two-parameter absorptive medium, Geophysics, 75, V13–V23.
Ker, S., Le Gonidec, Y. & Gibert, D., 2012. Multiscale seismic at-tributes: source-corrected wavelet response and application to high-resolution seismic data, Geophysical Journal International, 190, 1746–1760.
Ker, S., Le Gonidec, Y., Marsset, B., Westbrook, G., Gibert, D. & Min-shull, T.A., 2014. Fine-scale gas distribution in marine sediments as-sessed from deep-towed seismic data, Geophysical Journal International, 196, 1466–1470.
Ker, S., Thomas, Y., Riboulot, V., Sultan, N., Bernard, C., Scalabrin, C., Ion, G. & Marsset, B., 2019. Anomalously deep BSR related to a transient state of the gas hydrate system in the Western Black Sea, Geochemistry
Geophysics Geosystems, 20, 442–459.
Kjartansson, E., 1979. Constant Q-wave propagation and attenuation,
Jour-nal of Geophysical Research, 84, 4737–4748.
Kolsky, H., 1956. The propagation of stress pulses in viscoelastic solids,
Philosophical Magazine, 1, 693–710.
Lam, C.-H., Kooij, B.J. & De Hoop, A.T., 2004. Impulsive sound reflection from an absorptive and dispersive planar boundary, Journal of the
Acous-tical Society of America, 116, 677–685.
Li, Q., Zhou, H., Zhang, Q., Chen, H. & Sheng, S., 2016. Efficient reverse time migration based on fractional Laplacian viscoacoustic wave equa-tion, Geophysical Journal International, 204, 488–504.
Lines, L., Vasheghani, F. & Treitel, S., 2008. Reflections on Q, CSEG
Recorder, December, 36–38.
Lines, L., Wong, J., Innanen, K., Vasheghani, F., Sondergeld, C., Treitel, S. & Ulrych, T., 2014. Experimental measurements of Q-contrast reflections,
Geophysical Prospecting, 62, 190–195.
Marin-Moreno, H., Sahoo, S.K. & Best, A.I., 2017. Theoretical model-ing insights into elastic wave attenuation mechanisms in marine pore-filling methane hydrate, Journal of Geophysical Research: Solid Earth, 122, 1835–1847.
Morgan, E.C., Vanneste, M., Lecomte, I., Baise, L.G., Longva, O. & McAdoo, B., 2012. Estimation of free gas saturation from seismic reflec-tion surveys by the genetic algorithm inversion of P-wave attenuareflec-tion model, Geophysics, 77, R175–R187.
Morozov, I., 2011. Anelastic acoustic impedance and the correspondence principle, Geophysical Prospecting, 59, 24–34.
Odebeatu, E., Zhang, J., Chapman, M., Liu, E. & Li, X.-Y., 2006. Application of spectral decomposition to detection of dispersion anomalies associ-ated with gas saturation, The Leading Edge, 25, 206–210.
Quintal, B., Schmalholz, S.M. & Podladchikov, Y., 2009. Low-frequency reflections from a thin layer with high attenuation caused by interlayer flow, Geophysics, 74, N15–N23.
Reine, C., van der Baan, M. & Clark, R., 2009. The robustness of seis-mic attenuation measurements using fixed- and variable-window time-frequency transforms, Geophysics,74, WA123–WA135.
Takam Takougang, E. & Bouzidi, Y., 2018. Imaging high-resolution ve-locity and attenuation structures from walkaway vertical seismic profile data in a carbonate reservoir using visco-acoustic inversion, Geophysics, 83, B323–B337.
Tary, J.B., van der Baan, M. & Herrera, R.H., 2017. Applications of high-resolution time-frequency transforms to attenuation estimation,
Geophysics, 82, V7–V20.
Toksöz, M.N. & Johnston, D.H., 1981. Seismic Wave Attenuation. SEG, Tulsa, p. 45.
Wang, Y., 2002. A stable and efficient approach of inverse Q filtering,
Geophysics, 67, 657–663.
Wang, Y. & Guo, J., 2004. Modified Kolsky model for seismic at-tenuation and dispersion, Journal of Geophysics and Engineering, 1, 187–196.
Wang, Y., 2008a. Inverse-Q filtered migration, Geophysics, 73, S1–S6. Wang, Y., 2008b. Seismic Inverse Q Filtering. Blackwell, Oxford.
Wang, Y., 2015a. The Ricker wavelet and the Lambert W function,
Geophysical Journal International, 200, 111–115.
Wang, Y., 2015b. Generalized seismic wavelets, Geophysical Journal
Inter-national, 203, 1172–1178.
White, J.E., 1965. Reflections from lossy media, The Journal of the Acoustical
Society of America, 38, 604–607.
Wu, X., Chapman, M. & Angerer, E., 2015. Interpretation of phase rever-sals in seismic reflections from attenuating targets, Geophysical Journal
International, 200, 690–697.
Zhang, Z. & Ulrych, T.J., 2002. Estimation of quality factors from CMP records, Geophysics, 67, 1542–1547.
Zhao, H., Gao, J. & Peng, J., 2018. Frequency-dependent reflections in elas-tic diffusive-viscous media, Journal of Geophysics and Engineering, 15, 1900–1916.
Zhu, T., Harris, J.M. & Biondi, B., 2014. Q-compensated reverse-time migration, Geophysics, 79, S77–S87.