Choice or Mimetism in the Decision to Migrate? A European Illustration
29
0
0
Texte intégral
(2) CIRANO Le CIRANO est un organisme sans but lucratif constitué en vertu de la Loi des compagnies du Québec. Le financement de son infrastructure et de ses activités de recherche provient des cotisations de ses organisations-membres, d’une subvention d’infrastructure du Ministère du Développement économique et régional et de la Recherche, de même que des subventions et mandats obtenus par ses équipes de recherche. CIRANO is a private non-profit organization incorporated under the Québec Companies Act. Its infrastructure and research activities are funded through fees paid by member organizations, an infrastructure grant from the Ministère du Développement économique et régional et de la Recherche, and grants and research mandates obtained by its research teams. Les partenaires du CIRANO Partenaire majeur Ministère du Développement économique, de l’Innovation et de l’Exportation Partenaires corporatifs Banque de développement du Canada Banque du Canada Banque Laurentienne du Canada Banque Nationale du Canada Banque Royale du Canada Banque Scotia Bell Canada BMO Groupe financier Caisse de dépôt et placement du Québec DMR Fédération des caisses Desjardins du Québec Gaz de France Gaz Métro Hydro-Québec Industrie Canada Investissements PSP Ministère des Finances du Québec Power Corporation du Canada Raymond Chabot Grant Thornton Rio Tinto State Street Global Advisors Transat A.T. Ville de Montréal Partenaires universitaires École Polytechnique de Montréal HEC Montréal McGill University Université Concordia Université de Montréal Université de Sherbrooke Université du Québec Université du Québec à Montréal Université Laval Le CIRANO collabore avec de nombreux centres et chaires de recherche universitaires dont on peut consulter la liste sur son site web. Les cahiers de la série scientifique (CS) visent à rendre accessibles des résultats de recherche effectuée au CIRANO afin de susciter échanges et commentaires. Ces cahiers sont écrits dans le style des publications scientifiques. Les idées et les opinions émises sont sous l’unique responsabilité des auteurs et ne représentent pas nécessairement les positions du CIRANO ou de ses partenaires. This paper presents research carried out at CIRANO and aims at encouraging discussion and comment. The observations and viewpoints expressed are the sole responsibility of the authors. They do not necessarily represent positions of CIRANO or its partners.. ISSN 1198-8177. Partenaire financier.
(3) Choice or Mimetism in the Decision to Migrate? A European Illustration Thierry Warin*, Andrew Blakely †. Résumé / Abstract Cet article étudie le rôle des comportements mimétiques et des effets de réseaux dans les décisions de migration vers treize pays de l’Union européenne. En utilisant un modèle de gravité adapté à cette question et incluant des indicateurs mesurant l’activité économique, le progrès social, et les relations historiques, les résultats de cette étude précisent les méthodes traditionnelles d’évaluation des flux migratoires. Les comportements mimétiques influencent positivement les flux migratoires vers l’Europe, alors que les effets de réseaux dans le pays hôte ne prédisent pas de façon toujours satisfaisante les flux d’immigration. De plus, l’activité économique, et en particulier les conditions du marché du travail, jouent un rôle moindre que ceux mis en évidence dans des études précédentes. La prise en compte des comportements mimétiques en tant que déterminant des flux migratoires en Europe vient donc changer le paradigme pour l’étude des flux migratoires. Mots clés : flux migratoires, comportements mimétiques, effets de réseaux. This paper examines the role of herd behavior (mimetism) and network effects as determinants of bilateral migration flows to thirteen of the EU-15 countries. Using an adapted gravity model controlling for economic activity, welfare progressivity, geospatial, and historic relationships, the results force us to question the ways in which we explain migration flows. Herd behavior influences positively the flows of migrants to Europe, whereas the existence of network complementarities in the receiving country does not consistently predict and may in some cases reduce the likelihood of immigrant inflows. Moreover, economic activity and particularly labor market conditions play a lesser role in migrants’ choice of location than was previously thought. The introduction of herd behavior as a determinant of European Migration in our empirical analysis changes the paradigm for understanding migration and suggests that prior definitions of social perceptions are inadequate. Keywords: migration, herd behavior, network effects Codes JEL : J6, O15, Z13. *. Corresponding author: Associate Professor of Economics, director of International Studies, Middlebury College, Middlebury, Vermont, 05753, USA. Email: twarin@middlebury.edu; and Associate Fellow at CIRANO, Montreal, Quebec, Canada. † Middlebury College, Vermont, 05753, USA..
(4) 1. 1. INTRODUCTION In popular perception, reasons to migrate are often explained by the simple idea of obtaining a better standard of living. The reality is more complex. People may migrate not only because they are hoping for a better life, but also perhaps for cultural reasons. When one studies migration flows, one should consider and control not only for the economic background of the migrant but also for the reasons why the migrant decides to leave her own country. A person with poor economic background may migrate more likely to hope for a better life, while a wealthy person may migrate also for a better economic life, but also for societal or cultural reasons. A better life may not only mean a better economic life, it may also mean a better life in other dimensions: rights, culture, diversity, etc. Far from being an exhaustive study, we will adapt here an econometric methodology used in Warin and Svaton (2008) to isolate the migration drivers in Europe while also introducing the notion of network effects and herd behavior. This will bridge macroeconomics with Keynes’ notion of herd behavior, industrial organization with network effects, and the migration literature. Our study is innovative, therefore, in its expansion of the traditional characterization of migration. Our study will limit itself to migration flows to Europe for data quality reasons. The introduction of network effects is well documented in the migration literature and captures the fact that decisions to migrate may rely on pre-existing migration flows. The candidate to migration may be in communication with a current migrant who can give actual information on the living conditions in the host country. This is an incredibly valuable source of information for the candidate to migration. However, this captures only one kind of migration: the rational migration. Our study questions this notion, and although the usefulness of pre-existing networks in the host country is undeniable once the migrant arrives in the host country, we question (1) the efficiency of the decision to migrate based on this communication stream, and (2) the fact that this communication occurs in the real world. Very often, candidates to migration know by fact that a former friend left for a country, but don’t know what her current living conditions are. No news when one does not have a good life may mean that the migrant is happier since she did not return home. The lack of communication crossed with the economic background of the candidate to migration may in fact be of a relatively strong importance. This lack of communication being taken in a positive way is what we will define as herd behavior. Basically, a candidate to migration knows somebody who left, and the lack of communication is a signal of success. In other words, we tend to clarify and re-qualify a lot of the effects previously defined as network effects into herd behavior. Indeed, what the previous literature may see as network effects may in fact be herd behavior. One candidate to migration may go to a host country solely based on the fact that she knows there are many of her fellow citizens living in the host country rather than on knowledge that her fellow citizens have an actual better life there compared to another host country. To go beyond, very often the network effect is in fact not based on actual communication but is just a signal inferred by the candidate to migrate of a successful migration decision. A real network effect should capture this communication flow between the former migrant and the current candidate to migration leading to a well-thought decision to migration. If this were true, one would not observe in host countries newly arrived-migrants as well as old migrants in the poverty trap. Therefore, a lot of these so-called network effects should be in fact re-qualified into herd behavior. Herd behavior sometimes leads to positive outcomes, but are also very likely to lead to inefficient decisions. Herd behavior infers from past migrations the signal that the decision to migrate to a certain host country was a successful one. This may indeed be true, but is also very likely to lead to inefficient decisions to migrate. In numerous situations, had the candidate to migration known the exact socio-economic conditions of the former migrants with the same kind of background as hers, she would have gone to a different host country..
(5) 2. The paper, thus, resolves to clarify the nature of the drivers behind migration flows into thirteen Western European countries belonging to the EU-15 group. Much of the current discourse on European immigration remains biased towards traditional explanations. While previous studies have contributed to the existing literature by highlighting the importance of welfare on immigration decisions, they continue to lack adequate controls for social perception phenomena. Warin and Svaton (2008) conclude that generous total social protection expenditure in the host country is positively correlated with immigrant inflows towards EU-15 countries. Migration flows are likely, however, to be a more complex mechanism than previously thought. We estimate network effects by using the stock of individuals born in the origin country residing in the host country and we estimate herd effects by employing past migration inflows. The question of herd behavior is of principal concern. It introduces the idea of informational cascades as an influence on the complex mechanism of immigration. The presence of imperfect information in the immigration decision process may lead prospective emigrants to emulate previous emigrants because they assume that their forebears possess more or better information. Discounting potentially accurate private information in favor of the perceived information of others may lead to undesirable outcomes for both immigrant and host country. We hope, therefore, to identify the role of these social phenomena relative to other push and pull agents of migration towards EU-15 countries. To introduce these informational cascades, we will present a game theoretical model illustrating a sub-Pareto equilibrium. The latter is driven by a player’s decision to act motivated by the signal inferred from the lack of communication between two players. This is precisely what we observe in herd behavior. We will also illustrate and further this theoretical model with an empirical estimation. Our empirical analysis relies on an expanded gravity model typically geared towards bilateral trade or migration flows using aggregate data. Accounting for a variety of biases implicit in the available statistical estimators and the likelihood of cross-panel heteroscedasticity and serial correlation within panels that arise with longitudinal datasets, we estimate our models with pooled ordinary least squares, generalized least squares, and Parks-Kmenta feasible generalized least squares methods. We find that social perceptions are important predictors of immigrant inflows, however, the results also challenge commonly held notions about network effects. Much of the previous literature may have been capturing the effects of informational cascades (herd behavior) as part of the network effect. We note that herd behavior influences positively the locational choices of migrants to the EU-15, while the network effect generally correlates negatively to and seldom influences migration decisions. This startling result indicates that more attention be directed to social perception as a determinant of migration flows and that preconceived notions of network effects be reevaluated. The remainder of the paper is structured as follows. Part two presents a survey of prior literature focusing on international migration theory while paying particular attention to the role of networks and informational cascades. Part three presents a theoretical model illustrating informational cascades in the context of migration decisions. Part four provides an overview of the data sources and stylized facts. Part five describes the empirical analysis and presents the results. Part six discusses the policy implications of the analysis and concludes the paper.. 2. REVIEW OF THE LITERATURE In this section, we present a range of theories, which has shaped the study of the economics of international migration. Moreover, we evaluate several recent theoretical and methodological developments concerning.
(6) 3. locational choice behavior of immigrants. We use the results to design an empirical model capable of explaining the role of network effects and herd behavior in determining European migration inflows. 2.1 Theoretical Origins The entirety of human history is a migration story. Understandably, therefore, migration has vehemently persisted in the minds of social scientists. People move for any multitude of different reasons. Understanding these reasons and observing patterns in migration decisions are of strategic importance to policy makers as the migration of peoples has broad implications for all parties involved. The first attempt to construct an explanatory framework for analyzing migration is attributable to Ernest G. Ravenstein (1889). Drawing on census data, Ravenstein explains migration currents by proposing a “push-pull” paradigm. Adverse conditions in one location such as “oppressive laws, heavy taxation, an unattractive climate, *and+ uncongenial social surroundings” exert a “push” on individuals to relocate. Conversely, positive conditions in one location (underdeveloped resources, a deficiency of labor-supply, etc.) “pull” individuals from their current location. Furthermore, Ravenstein notes that migration is negatively correlated with the distance between origin and destination location. Consequently, migration is a gradual process in which migrants move in stages rather than in one long journey. Rounding out his theory of migration, Ravenstein indicates that migration differentials such as gender significantly impact an individual’s mobility. Many of Ravenstein’s conclusions are still operative in the current body theoretic. Income, unemployment, and welfare differentials persist as “push-pull” mechanisms. More modern characteristics of the International System have, however, widened the scope of Ravenstein’s paradigm. Many western governments, for instance, have adopted restrictive immigration policies, which “push” back on migration inflows. While groundbreaking for its time, Ravenstein’s study does not paint a complete picture of migration determinants. 2.2 Neoclassical Migration Theory The neoclassical theory of migration provides both macroeconomic and microeconomic explanations. The macroeconomic argument follows that international migration results from spatial imbalances in factor endowments and in the supply and demand of labor. Countries with relatively high labor to capital ratios exhibit low wages, whereas countries with relatively low labor to capital ratios generate high equilibrium wages. The wage imbalance between locations induces a flow of labor from the relatively low-wage origin country to the high-wage host country.1 The transfer of labor, therefore, exhibits an equilibrating force on the respective labor to capital ratios and wages. Assuming that migration was costless, international wages would converge. However, reality demonstrates no justification for such an assumption. Migration, from the microeconomic perspective, can be explained through the lens of individual choice. Sjaastad (1962) followed by Todaro (1969) frame migration as a simple question of cost-benefit analysis. Observing the opportunity to increase income and utility present in the above story of wage differentials individuals weigh the associated costs (transportation, learning a foreign language, adjusting to a new labor market, etc.) against the potential benefits (improved wages associated with greater labor productivity). The individual will migrate if the. 1. Massey et al. (1993), p. 433-434..
(7) 4. expected income returns in the host country are greater than the sum of migration costs and income in the origin country. Increasingly, however, empirical analyses demonstrate that neoclassical elements do not sufficiently predict locational choices made by immigrants. Examining migration to the United States over a five-year period (19891994), Zavodny (1998) discovers that economic conditions (unemployment rate and the average manufacturing wage) are statistically weak indicators of immigrants’ settlement patterns. Furthermore, in an investigation of EastWest migration in Germany and migration within the EU, Alecke et al. (2001) reveal the tendency of neoclassical factors to overestimate migration patterns. These results indicate that strictly economic variables cannot account for all determinants of migration. 2.3 Welfare and Migration In recent years another explanation for migration patterns has become popular. The rise of the welfare state, particularly in a European context, has generated a body of research that questions the linkages between welfare and immigration. Early studies such as Borjas and Trejo (1991) and Borjas (1994) indicate that welfare participation rates among immigrants have risen above welfare participation rates among natives in the United States. Moreover, whether or not immigrants “pay their way” for this more intensive welfare participation is ambiguous. The result will depend mostly upon the accounting methods selected. Another major question within the welfare-migration debate is whether welfare provisions exhibit a magnet effect on immigrant inflows. In other words, greater welfare-based expenditures in destination countries will generate larger immigrant inflows. Previous studies have provided varied results. Borjas (1999) discovers, for example, that locational choice of immigrants going to the United States exhibits evidence for welfare-magnetism. Immigrants typically clustered geographically in states with the highest welfare provisions. By contrast, in an investigation of migration flows to OECD countries, Pedersen et al. (2008) find that welfare-magnetism plays no significant role in predicting migration patterns. Most recently, however, in a study of the same European context to be used in this paper Warin and Svaton (2008) show that social protection expenditures among EU-15 countries are positively significant determinants of immigrant inflows. This final result indicates that welfare should be included in an analysis such as ours, which considers European immigration. However, the mixed results overall vis-à-vis the link between immigration and welfare demonstrates that there are further explanations to be examined. 2.4 Network Theory of International Migration The neoclassical model’s tendency to underemphasize social explanations for migration patterns has led economists to turn to other social sciences for answers. Studies of the Great Migration of southern Blacks to the northern United States provide key findings vis-à-vis economic migration theory. Gottlieb (1987) and Grossman (1989) suggest that large enclaves of Blacks in Pittsburgh and Chicago directly contributed to the migration decisions of southern Blacks. The idea of migrant networks has since been championed in much of the international migration literature. Migrant networks function in two distinct ways, which directly affect the cost-benefit analyses mentioned in section 2.2. First, networks provide a cost-reducing complementarity. Existing social linkages reduce the likelihood that subsequent immigrants will incur certain adjustment costs. To give an extreme example, international migration often requires new immigrants to adopt the host country’s language; however, in cases where migrant networks are sufficiently large and well-integrated (ex. the Hispanic community in California) language learning.
(8) 5. may not be necessary. Second, networks also reduce the risks associated with migration. Migrant networks reduce risk in two ways: direct linkages and information. Through established social connections, migrant networks can provide employment leads for arriving immigrants. Furthermore, through experience and group communication migrant networks function as information channels, which provide accurate information on labor market conditions. In sum, the positive externalities created by migrant networks will have swaying power in decisions to migrate and in locational choice of those who do. Munshi (2003), for example, confirms that exogenously larger networks among Mexican immigrants in the U.S. result in better likelihood of employment and better employment. Furthermore, the networks provided the most assistance to disadvantaged participants (women, the low-skilled, etc.) Other empirical analyses confirm the network effect hypothesis (see Zavodny, 1998; Bauer et al., 2000; Bruder, 2003; Pedersen et al. 2008, and Rainer & Siedler, 2008). The network theory, however, is not without its inconsistencies. As Bauer et al. (2000) note, networks do not always positively correlate with migration. Initially, network externalities positively affect utility as the migrant population in a location rises. However, once the migrant population reaches a critical threshold the positive network externalities are overpowered by a negative wage effect generated by an oversupply of labor. Graphically, this result demonstrates an inverse U-shaped relationship between the number of migrants in a location and the probability of migration to that location. 2.5 Herd Behavior and Migration The most recent addition to the theoretical literature on migration emanates from choice theory. We have seen in the cost-benefit calculations in 2.2 and the network effects in 2.3 that prospective immigrants rely heavily on information when conducting the decision to migrate or where to migrate. If perfect information were available the best choice would distinguish itself from all alternatives. However, as is the case in reality, imperfect information is likely to be the norm. In the case of the latter, decisions must be made in the face of uncertainty. What decision rule do individuals follow under such circumstances? Keynes (1936) explains a similar uncertainty in the context of asset markets and demonstrates that investors disregard personal information in favor of mimicking the actions of predecessors. Epstein (2002) is the first to adopt Keynes’ notion of informational cascades in a migration context. Epstein arrives at a startling proposition. If the number of immigrants in a given country is greater than immigrants in all the other alternative countries by at least two individuals, then all future individuals regardless of their personal information will immigrate to that country. This could have significant explanatory value in regards to the puzzling results of neoclassical studies that economic variables were not sufficiently able to predict migration. 2.6 Modeling Network Effects and Herd Behavior Given the popularity of the network effect argument modeling networks has become standardized to a degree. The majority of empirical models considered represent network effects using data on the stock of immigrants residing in a given location. In a simple gravity regression, Zavodny (1998) accounts for migrant stock using data on the percentage of the state population that is foreign-born. Also included in the regressions are proxies for neoclassical elements (average unemployment rate, real average hourly wage in manufacturing, and marginal income tax rate differentials), for welfare generosity, and total population. While the model demonstrates the importance of controlling for determinants of migration in order to accurately distinguish the significance of network effects on migration, we believe it to be deficient in its controls. Variables controlling for cost such as geographic distance, are completely absent..
(9) 6. Like Zavodny, Bruder (2003) uses the migrant stock as a proxy for networks. Unfortunately, the model suffers from similar shortcomings. Variables accounting for cost and welfare are conspicuously absent from the equation. The model does, however, present several improvements relative to Zavodny’s. First, all variables are lagged by one period because migration decisions are based on experiences rather than on short-term economic developments. Furthermore, the regression is log-linear in design, which acknowledges that migrant behavior is based on choices between several alternatives. Bauer et al. (2000) provide a similar, yet, better alternative. In the estimations, conditional logit models are used. This type of model is particularly appropriate when trying to capture choice behavior. The explanatory variables include attributes of the choice alternatives (ex. cost) as well as characteristics of the individuals making the choices (ex. income). None of the above analyses and models attempts, however, to capture herd behavior. Using Epstein’s (2002) discussion of informational cascades, Bauer et al. (2002) incorporate a herd behavior variable into a conditional logit model. The flow of migrants during the year before an individual migrates serves as a proxy for the variable. Furthermore, the variable differentiates the flow to a particular destination relative to other locations, which reflects the understanding that herd behavior implies that migrants should conduct locational choice based only on the largest flow. Therefore, the herd behavior variable is best represented in relative terms rather than absolutely because it makes relative changes to flows visible. Herd behavior is modeled, therefore, as the difference between the migrant stock of country x residing in country y at time t (or, STOCK xyt) and the migrant stock of country x residing in country y at time t-1 (or, STOCKxy(t-1)). Hence, the herd behavior variable is as follows: HERDxyt = STOCKxyt – STOCKxy(t-1). The model also accounts for the nonlinear relationship between the size of the migrant stock in a location and the probability of migration to that location mentioned in section 2.3 by including both a linear and a squared term of the network effects variable. Despite the progress made by Bauer et al. (2002), the model, like its predecessors, suffers from a control deficiency. While some effort is made to control for the transportation and monetary costs involved in migration, other cost controls (lack of a common language) are neglected. Welfare differentials between origin and host countries are not present in the model. Although Zavodny (1998), Bruder (2003), Espstein (2002), and Bauer et al. (2002) ask the right questions, their studies are clearly hampered by models characterized by insufficient control mechanisms. The present study on European migration hopes to avoid similar flaws by incorporating economic and noneconomic variables representing macro and micro conditions, costs, and welfare. This will allow us to accurately isolate the network and herd effects from any background noise. Before studying the empirical model, we will present a theoretical model in the following section.. 3. MODEL SET-UP2 3.1 Players We represent a two-player game, i. 1, 2 . One player is the current migrant in the host country and the other is. the candidate to migration. The current migrant knows the state of nature: her own economic situation in the host country. At the beginning of each game, the potential migrant makes her decision based on what she knows about the state of nature: N. 2. A, B . A corresponds to a situation in which the economic integration in the host country is easy. This model is an adaptation of the one presented in Bonardi and Warin (2007).
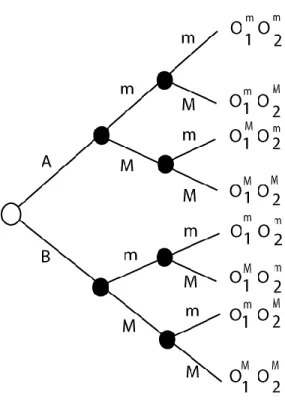
(10) 7. for the candidate’s profile, and the candidate to migration should not invest some more time to find a better host country. easy.. B. corresponds to a situation in which the economic integration of the candidate to migration will not be. The objective functions can be represented by:. Oi ( N ) where. Ci. max. (Ci ). represents the total cost of candidate to migration. i. (1). in the state of nature. A. or. B.. 3.2 Strategies The candidate to migration has two options: low search costs ( m ) or high search costs ( M ). Low search costs mean that the candidate to migration may not spend too much time or resources searching for a better fit in terms of host country. On the other hand, high search costs mean that the candidate to migration plans to devote most or all her time and effort to find the best host country based on her own profile. The total cost function is:. Cim A ; CiM A. Ci. (2). Cim B ; CiM B , otherwise. The optimal-Pareto solution is thus:. O1m , O2m. In such a configuration, payments are. Oim A. prisoner’s dilemma, as represented in Figure 1.. A ; O1M , O2M. B. OiM A and OiM B. (3). Oim B , and they prevent the.
(11) 8. Figure 1. Decision tree. In reality, the co-ordination mechanism of the commitment strategies of the two players is imperfect. Building on Rubinstein’s (1989) approach, we model the interaction between the current migrant and the candidate to migration. This interaction takes place within a context of incomplete information concerning the state of nature. In order to represent the “noise” in the co-ordination mechanism, we assume that the current migrant has private information on the state of nature. The current migrant, then, freely passes this information to the other player, the potential candidate to migration. If the economic integration of migrants is easy in the host country, the current migrant simply does not send additional messages. On the other hand, if the state of nature is such that economic integration is not easy, she also sends messages to warn the candidate to migration. This transmission corresponds to the modeling of co-ordination. To begin the analysis, we assume that the most probable event is state of nature A , i.e., that economic integration is easy. If B occurs, a message is sent from the current migrant to the candidate to migration. The candidate to migration receives the message, understands the warning about bad economic integration and therefore sends a message back to the current migrant acknowledging the receipt. The current migrant then responds with another confirmation. This entire exchange is made necessary by potential communication failures: the information contained in the message sent by one of the players has a small probability of being lost or misunderstood by the other player, q 0 . The probability that a message still circulates beyond a very large number of exchanges is thus a priori weak, but still exists and is not insignificant. The game has an infinite horizon because of the back-and-forth transmission of messages. The procedure of sending messages does not form part of the strategy: the real game begins only when no further messages are exchanged between the two players..
(12) 9. Formally, we use the following notations to depict this situation:. C0 , the beginning of the game ; the current migrant discovers that the state of nature is either A or B with the probability distribution. p,1 p and p 1/ 2;. th. Ct , the t message (sent by the current migrant if T is odd and by the candidate to migration if T is even);. I t , following sets of information:. I A , the current migrant discovered that the state of nature is A and sent no additional message to the candidate to migration,. I 0 , the candidate to migration did not receive any message,. I1 , the current migrant discovered that the state of nature is B and sent C1 to the candidate to migration,. I 2 , the candidate to migration received C1 , understood that the innovation had the potential to be a radical one and therefore sent C 2 to express willingness to make a commitment to its development; and more generally: I 2t , corresponds to the state of information of the candidate to migration when he sent C2t , while I 2t. 1. is the current migrant’s information set..
(13) 10. Figure 2. Developed form. The fact that q>0 is not a trivial assumption. The interesting feature of this assumption and of the model that follows is that even when the uncertainty seems to be resolved, the outcome may still be Pareto ineffective. Indeed, as soon as the candidate to migration receives a message regarding the state of nature, she knows by definition that the state of nature is. B . Thus, except I A. and I 0 , the uncertainty is no longer due to the initial. event, which is now known to both players, but rather to the state of information of the other player. For example, in I 2 , the candidate to migration replied to the first message with C 2 , and, as she did not receive any further messages, she does not know if the current migrant is in I1 (the current migrant sent the first message C1 but did not receive C2) or in I 3 (the current migrant received C 2 but did not send anything after that). More generally, if the player’s state of information is I t , she does not know whether the other is informed of I t. 1. or I t 1 . However, the probability of these two events taking place is not equal. In fact, we can show that, if a player sent a message Ct and did not receive a confirmation, there is a greater chance that Ct was lost rather than Ct. 1. confirmation did not arrive..
(14) 11. LEMMA 1. If a player sent a message Ct and did not receive a response from the other player, it is more likely that Ct was lost rather than that Ct Proof. We calculate the conditional probabilities of I t. P It 1 It. q. q , and P I t 1 q q. 1. 1. 1. did not arrive. and I t. It. 1. knowing I t for any t. 1 q q q. 1 q q. Knowing I t , a player knows that the other player is more likely to be in I t. 1. , thus:. 1:. P It. 1. It. 1. P It. 1. It. 1 q. 1.. than in I t 1 . □. The implication of Lemma 1 is that, when a player does not receive a message in which the other player confirms the reception, the former thinks that the latter is in fact more likely to invest in a low search cost strategy rather than a high one. If the candidate to migration did not receive a message, she thinks that it is more likely that the current migrant plays as if the state of nature was. A.. LEMMA 2. The property of conditional optimality of a sequential equilibrium implies here that, whatever q 0 and whatever the number of exchanged messages, co-ordination between the current migrant and the candidate to migration cannot be applied with certainty. Proof. As p. 1/ 2 , we have:. P I A I0. p. p 1 p q. P I1 I 0 .. In other words, if the outside candidate to migration did not receive any messages, she thinks that it is more likely that the state of nature is. A , rather than that the first message was lost.. □. To obtain perfect co-ordination, the current migrant must thus play m if A . As a consequence, the candidate to migration will make a weak commitment. The following proposition makes that clear. PROPOSITION 1: When the state of nature is A, the property of conditional optimality implies that the candidate to migration plays m. Proof. Let us determine a sequential equilibrium in which the current migrant plays m if A . In this case: In I 0 , the candidate to migration minimizes its loss expectation, knowing that it will obtain:. As. P I A I0. P I1 I0. and. min E 2 m. P I A I0 O2m A. P I1 I 0 O2m B. min E 2 M. P I A I0 O2M A. P I1 I 0 O2M B. O2m A. outside candidate to migration plays m . □. (4). O2M A , the property of conditional optimality implies that the.
(15) 12. Here it is a Pareto-optimal equilibrium since the host country is a well-suited country in terms of economic integration of our candidate to migration, and that our candidate decided not to look for another host country. This is the illustration of a real network effect, i.e. when the networking helps the decision to migrate to the right country. PROPOSITION 2: When the state of nature is B, the property of conditional optimality implies that the candidate to migration play m, even though the state of nature would require M. Proof. In I1 , the current migrant knows. B. and knows that the candidate to migration plays m in I 0 . Its. expectations of conditional losses are then respectively:. As. P I0 I1. P I 2 I1. and. min E 1 m. P I0 I1 O1m B. P I 2 I1 O1m B. min E 1 m. P I0 I1 O1M B. P I 2 I1 O1M B. O1m B m. O1M B m. (5). , the property of conditional optimality implies again. that the current migrant chooses m . By recurrence, the candidate to migration always chooses m . □ This equilibrium is sub-optimal. The candidate to migration should invest some new resources to find a bettersuited host country, but won’t. This is how we setup the herd behavior. In retrospect, the candidate to migration will always consider that the state of nature is favorable to her own emigration even though the state of nature can be B and would require some more time searching for a better suited host country. The set-up of this game is interesting because it illustrates at once the network effects (benefitting from the communication with a current migrant in the host country and emigrating to a well-suited host country),and the herd behavior (not being sure about the level of economic integration of migrants, but deciding to migrate anyway).. 4. DATA AND STYLIZED FACTS 4.1 Data Sources Our empirical application employs Warin and Svaton’s (2008) cross-sectional time-series pair-based dataset.3 The original dataset was constructed for the immigration relationships between fourteen host countries of the. 3. Upon updating and expanding the dataset estimations were performed to mimic those conducted by Warin and Svaton (2008) in order to ensure consistency. The results gathered confirmed Warin and Svaton’s conclusions..
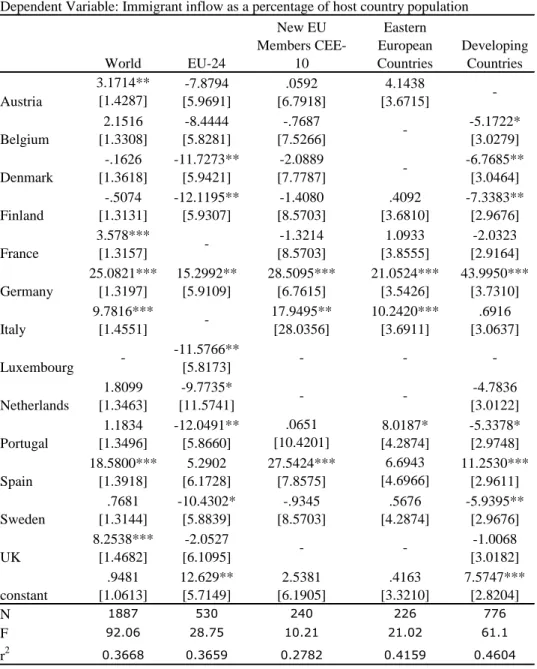
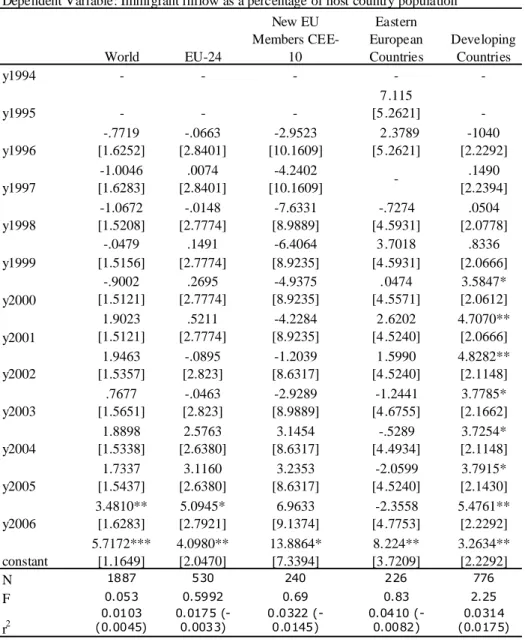
(16) 13 European Union4 and seventy-six origin countries during the period 1995-2004. Migration data such as immigrant inflow by nationality as a percentage of the host country population and stock of foreign population by nationality in the host country is acquired from the OECD International Migration Outlook (2008). Due to data asymmetries, one host country, Ireland, has been dropped from the dataset. Furthermore, the time-series has been expanded to include data for 1994, 2005, and 2006. The dataset has a unique construction. It exhibits an inherent bias by using an anchor of the thirteen host countries, each of which are paired with the top fifteen countries in terms of emigration to that host country. Assuming perfect data this would correspond to 195 pairs for thirteen years and produce 2,535 observations per variable. However, migration data on the top fifteen origin countries for several small host countries could not be accessed, thus, making our panel unbalanced. The final dataset, therefore, includes 183 pairs for the period 1994-2006, spanning seventy-six different origin countries. The remaining variables describing welfare progressivity, economic activity, and gravity characteristics were obtained from a variety of sources. From Eurostat (European Commission, 2008) come social protection expenditure, old-age dependency ratio, and the cost of labor in the host country. Variables such as unemployment rates, GDP per capita in both host and origin countries were collected from the World Development Indicators database (World Bank, 2008). Last, gravity characteristics controlling for geospatial and cultural effects including distance and historical relationship were found in the Cepii 5 Distance Database (Cepii, 2008). Although our dataset represents an improvement over most of what has been employed in earlier studies, there exist certain problems worth noting. Namely, the dataset exhibits some unbalance. For example, in data on certain variables in unstable source countries such as Somalia and Afghanistan the number of observations may be less than the norm for other source countries. Furthermore, we have data on immigrant inflows to and immigrant stock in the majority of destination countries for most of the years; once again, however, there are certain instances in which the number of observations varies from the norm. Therefore, we have provided summary statistics for all variables in the following section. For complete descriptions of all included variables, please see Appendix Table A. 4.2 Stylized Facts Performing a rudimentary estimation of variance according to time-specific and host country-specific fixed effects demonstrates the degree to which spatial or temporal effects are relevant. Table one presents the results of such an estimation focusing on the host country-specific effects, which describe twenty-seven percent to forty-six percent of the dependent variable’s variance. By contrast, the time-specific effects highlighted in table two do not predict nearly as much of the variation of the dependent variable. Across all five divisions of the dataset timespecific effects predict a maximum of four percent of the overall variance. We may conclude, therefore, that host country-specific effects play a significant role in determining migration flows while time-specific effects are of lesser importance. The summary statistics for all non-dummy variables are provided in table three and are organized into sub-samples by country of origin.. 4. Austria, Belgium, Denmark, Finland, France, Germany, Ireland, Italy, Luxembourg, Netherlands, Portugal, Spain, Sweden, United Kingdom 5. Centre D’Etudes Prospectives et D’Informations Internationales.
(17) 14. Table 1: Country-Specific Fixed Effects Dependent Variable: Immigrant inflow as a percentage of host country population New EU Eastern Members CEEEuropean Developing World EU-24 10 Countries Countries 3.1714** -7.8794 .0592 4.1438 [1.4287] [5.9691] [6.7918] [3.6715] Austria 2.1516 -8.4444 -.7687 -5.1722* [1.3308] [5.8281] [7.5266] [3.0279] Belgium -.1626 -11.7273** -2.0889 -6.7685** [1.3618] [5.9421] [7.7787] [3.0464] Denmark -.5074 -12.1195** -1.4080 .4092 -7.3383** [1.3131] [5.9307] [8.5703] [3.6810] [2.9676] Finland 3.578*** -1.3214 1.0933 -2.0323 [1.3157] [8.5703] [3.8555] [2.9164] France 25.0821*** 15.2992** 28.5095*** 21.0524*** 43.9950*** [1.3197] [5.9109] [6.7615] [3.5426] [3.7310] Germany 9.7816*** 17.9495** 10.2420*** .6916 [1.4551] [28.0356] [3.6911] [3.0637] Italy -11.5766** [5.8173] Luxembourg 1.8099 -9.7735* -4.7836 [1.3463] [11.5741] [3.0122] Netherlands .0651 1.1834 -12.0491** 8.0187* -5.3378* [10.4201] [1.3496] [5.8660] [4.2874] [2.9748] Portugal 6.6943 18.5800*** 5.2902 27.5424*** 11.2530*** [4.6966] [1.3918] [6.1728] [7.8575] [2.9611] Spain .7681 -10.4302* -.9345 .5676 -5.9395** [1.3144] [5.8839] [8.5703] [4.2874] [2.9676] Sweden 8.2538*** -2.0527 -1.0068 [1.4682] [6.1095] [3.0182] UK .9481 12.629** 2.5381 .4163 7.5747*** [1.0613] [5.7149] [6.1905] [3.3210] [2.8204] constant 1887 530 240 226 776 N 92.06 28.75 10.21 21.02 61.1 F 0.3668 r2 Standard errors in brackets *p<0.10 **p<0.05 ***p<0.01. 0.3659. 0.2782. 0.4159. 0.4604.
(18) 15. Table 2: Time-Specific Fixed Effects Dependent Variable: Immigrant inflow as a percentage of host country population New EU Eastern Members CEEEuropean Developing World EU-24 10 Countries Countries y1994 7.115 y1995 [5.2621] -.7719 -.0663 -2.9523 2.3789 -1040 y1996 [1.6252] [2.8401] [10.1609] [5.2621] [2.2292] -1.0046 .0074 -4.2402 .1490 y1997 [1.6283] [2.8401] [10.1609] [2.2394] -1.0672 -.0148 -7.6331 -.7274 .0504 y1998 [1.5208] [2.7774] [8.9889] [4.5931] [2.0778] -.0479 .1491 -6.4064 3.7018 .8336 y1999 [1.5156] [2.7774] [8.9235] [4.5931] [2.0666] -.9002 .2695 -4.9375 .0474 3.5847* [1.5121] [2.7774] [8.9235] [4.5571] [2.0612] y2000 1.9023 .5211 -4.2284 2.6202 4.7070** [1.5121] [2.7774] [8.9235] [4.5240] [2.0666] y2001 1.9463 -.0895 -1.2039 1.5990 4.8282** y2002 [1.5357] [2.823] [8.6317] [4.5240] [2.1148] .7677 -.0463 -2.9289 -1.2441 3.7785* y2003 [1.5651] [2.823] [8.9889] [4.6755] [2.1662] 1.8898 2.5763 3.1454 -.5289 3.7254* y2004 [1.5338] [2.6380] [8.6317] [4.4934] [2.1148] 1.7337 3.1160 3.2353 -2.0599 3.7915* y2005 [1.5437] [2.6380] [8.6317] [4.5240] [2.1430] 3.4810** 5.0945* 6.9633 -2.3558 5.4761** y2006 [1.6283] [2.7921] [9.1374] [4.7753] [2.2292] 5.7172*** 4.0980** 13.8864* 8.224** 3.2634** constant [1.1649] [2.0470] [7.3394] [3.7209] [2.2292] 1887 530 240 226 776 N 0.053 0.5992 0.69 0.83 2.25 F 0.0103. 0.0175 (-. 2 (0.0045) 0.0033) r Standard errors in brackets *p<0.10 **p<0.05 ***p<0.01. 0.0322 (0.0145). 0.0410 (0.0082). 0.0314 (0.0175).
(19) 16. Table 3: Summary Statistics Organized by Country of Origin World N Mean S.D. Max Min Inflow of Immigrant Population 1887 6.554 13.001 152.733 0.000 Stock of Immigrant Population 1877 2.376 9.387 101.197 0.000 Total Social Protection Expenditure in the Host Country 2208 6253.517 1748.318 13458.300 2309.500 Unemployment Rate in the Host Country 2208 8.111 3.909 23.900 1.800 Unemployment Rate in the Origin Country 1843 9.025 4.909 37.300 0.900 Old Age Dependency Ratio in the Host Country 2392 23.844 2.177 29.800 19.100 Cost of Labor in the Host Country 2288 100.312 2.483 107.458 93.594 Geographical Distance 2392 3728.110 3573.123 19147.140 59.617 EU -24 N Mean S.D. Max Min Inflow of Immigrant Population 530 5.174 12.431 152.733 0.085 Stock of Immigrant Population 560 5.539 14.611 101.197 0.017 Total Social Protection Expenditure in the Host Country573 6831.700 2148.306 13458.300 2309.500 Unemployment Rate in the Host Country 548 6.653 3.374 23.900 1.800 Unemployment Rate in the Origin Country 548 9.429 3.716 23.900 2.700 Old Age Dependency Ratio in the Host Country 607 23.270 2.321 29.800 19.100 Cost of Labor in the Host Country 516 100.002 2.182 106.521 93.594 Geographical Distance 607 919.370 610.682 2394.850 59.617 New EU Members: CEE-10 N Mean S.D. Max Min Inflow of Immigrant Population 240 12.164 24.166 152.733 0.248 Stock of Immigrant Population 194 0.474 1.059 7.799 0.001 Total Social Protection Expenditure in the Host Country288 6371.721 1428.703 9099.400 2309.500 Unemployment Rate in the Host Country 288 7.878 3.887 23.900 2.700 Unemployment Rate in the Origin Country 288 10.979 4.589 20.000 3.900 Old Age Dependency Ratio in the Host Country 312 23.933 2.020 29.800 19.100 Cost of Labor in the Host Country 312 100.022 2.382 107.458 93.594. 5. METHODOLOGY AND ANALYSIS 5.1 Estimation Procedure Given the nature of the dataset (pair-based cross-sectional time series) we acknowledge the probability of panel heteroscedasticity and serial correlation, which may undermine the assumptions of the ordinary least squares estimator. The Hausman test reveals that the data are not well suited for poolability. The test indicates, furthermore, that fixed effects should be used. This confirms our initial belief that country-specific effects play an important role in the model. In addition, we conducted tests for normality on all explanatory variables and concluded that the data were generally non-normal. In response, we employ log-log specifications in order to achieve distributions closer to Gaussian functions. Like Bruder (2003) we assume that the decision to migrate is more likely to be influenced by historical experiences than by short-term economic activity. We, therefore, apply one-period lags to all explanatory variables describing conditions in host and origin countries. In contrast to Bauer et al’s (2002) use of a conditional logit framework we select and implement a gravity framework. The decision was motivated by data limitations, which restricted our analysis to European macro-level data. The gravity framework does not provide an optimal analysis of choice alternatives; however, it will provide an adequate estimation of social perception variables as determinants of immigrant inflows to a particular country relative to other explanatory variables..
(20) 17. Understanding the limitations of available estimators we perform regressions of our empirical model using three different estimators. Despite the Hausman test’s indications against pooling our data, we include results for a least squares dummy variable estimator under the assumption that the estimator has a tendency to underestimate the significance of explanatory variables. Explanatory variables demonstrating significance despite this bias should aid our interpretation of the results generated by different estimators. Given the panel nature of the dataset we turn next to a generalized least squares estimator incorporating time and country-specific fixed effects. This estimator, however, may complicate analysis as it does not completely ensure the assumption of equal variance of the dependent variable across the data nor does it correct for autocorrelation. We, therefore, also apply a feasible generalized least squares estimator to our model using the method outlined by Parks (1967) and Kmenta (1997), which rectifies any serial correlation or heteroscedasticity. 5.2 Empirical Analysis Due to the fact that the seventy-six origin countries in the dataset do not represent a homogenous selection of countries, but rather a diverse sampling of socio-economic situations, we divide the dataset into four categories to be analyzed alongside the overall sample. We conduct estimations of immigrant inflows from EU-24 member countries, Central and Eastern European countries that have joined the EU in 2004 and 2007, other Eastern European countries, and countries belonging to the so-called “developing world.” 5.3 Social Perception Our original model is expressed in terms of equation (6) where INFLOWij,t represents the annual inflow of immigrants from the origin to the host country as a percentage of the host country’s total population, HERDij,t-1 is past immigrant inflow and functions as a proxy for herd behavior, STOCKij,t-1 is the percentage of host country population representing those individuals residing in the host country of the origin country nationality 6 , SOC_TOTij,t-1 captures the cumulative social protection expenditure per capita in the host country, UE_Hij,t-1 indicates the unemployment rate in the host country, similarly UE_Oij,t-1 denotes the unemployment rate in the origin country, LABORij,t-1 measures the real unit cost of labor in the host country, AGEij,t-1 expresses the old age dependency ratio in the host country, and DISTij is a measure of geographical distance separating the countries within a pair. HISTORYij is a gravity dummy signaling one if the countries within a pair were formerly in a colonial or colonial-like relationship. 7 Last,. represents a vector of time dummies included in the estimations when. applicable.. 6. The following caveat should be noted when interpreting the STOCK variable as a proxy for network effects. The stock of immigrants residing in the destination country in a given year represents the net flow of immigrants over time (i.e. the total number of persons remaining in the destination country from previous inflows, outflows, and return migration in previous years). Therefore, the STOCK variable may, as Pederson et al. (2008) state, be “weakly exogenous.”. 7. Variables for contiguity and common official language were initially part of the equation, but were ultimately removed prior to estimation due to instances of multicollinearity. We expect that this will not significantly alter the results since we assume that contiguity will be to some measure captured by the.
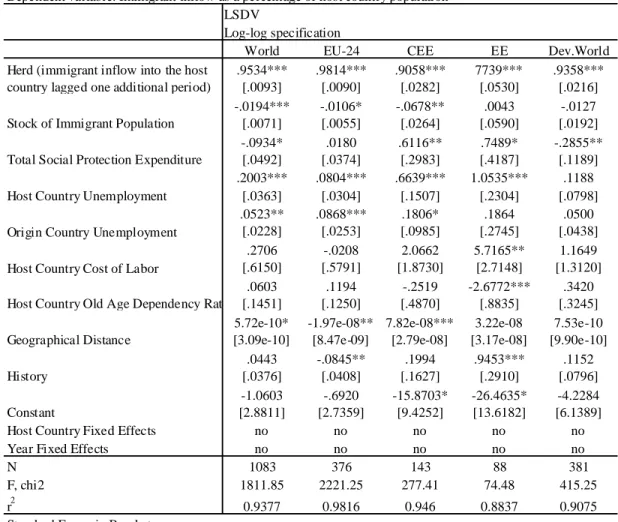
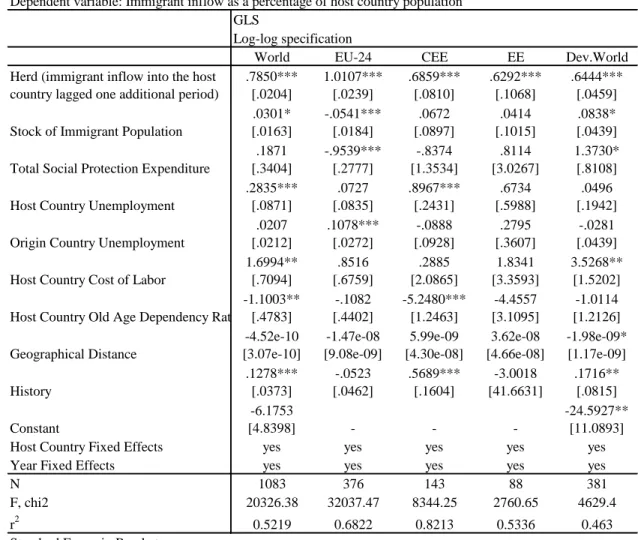
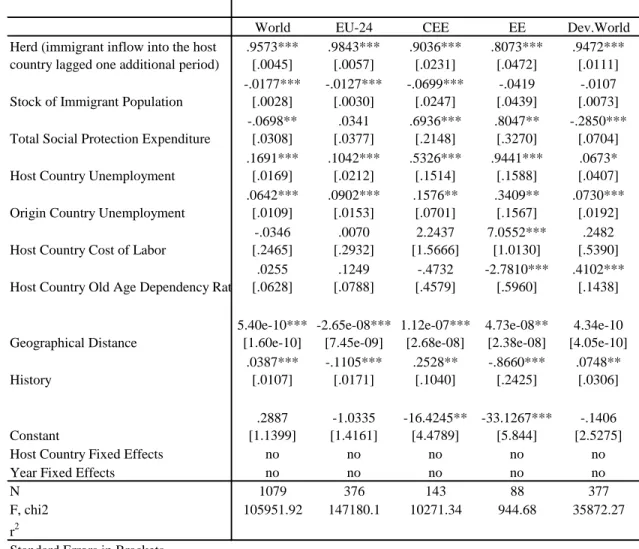
(21) 18. (6). Considering the precedent established by Warin and Svaton (2008) using a reduced form of the dataset, we expect several results to remain consistent. The level of total social protection expenditure should be positively correlated with the influx of immigrants. Positive labor market conditions in the host country will also attract immigrants. We expect, in other words, that high unemployment rates in the host country will exhibit negative correlation with the immigrant inflows. By similar reasoning, we may assume that high unemployment rates in the sending country will compliment increased immigrant inflows. We may also anticipate that ageing societies will, in an effort to equilibrate the size of the labor force with the size of the population, be characterized by greater immigration inflows. Concerning our hypotheses we should expect that perceptions of positive network complementarities would be captured by positive correlation of the stock variable with the dependent variable. Furthermore, we anticipate that the herd variable will be positively correlated with the dependent variable, thus, demonstrating that immigrants perceive their antecedents to have accurate information. Estimations of our model explaining immigrant flows provide startling results vis-à-vis the prior literature and the above assumptions (Tables 4, 5, and 6). Demonstrated by ninety-nine percent significance levels and positive correlation between immigrant inflows and the proxy for herd effects across all three estimators and all four subsamples of the dataset, herd behavior is a principal driver behind migration flows. Conversely, the immigrant stock variable provides mixed results. Curiously, if the variable sends any signal to immigrants it generally does so negatively. Of particular interest is the result for the EU-24 sub sample, which indicates that the network effect negatively impacts immigrant inflows. The negative correlation between the immigrant inflows from the EU-24 countries and the stock of resident immigrants of the same nationality in the receiving country may be explained by the following speculation. The negative sign might be confirmation of the inverse U-shaped relationship between the stock of immigrants and immigrant inflows posited by Bauer et al. (2000). In other words, a critical threshold has been reached at which the negative wage effect generated by the immigrant stock from EU-24 countries begins to outweigh the positive network externalities, thus providing less incentive to migrate. Consistent across estimators and the various data samples is the positive 8 influence of the host country unemployment rates on immigrant inflows. Rather than accepting the confusing indication that high unemployment rates in the host country are attracting immigrants, we may reason that individuals are migrating to EU-15 countries in spite of high unemployment rates. Immigrants either do not care about host country unemployment or they do not have access to unemployment figures that ceteris paribus might influence their choice of location.9 Unemployment in the origin country performs in a manner generally consistent with previous. distance variable and common language will be captured by the variable accounting for historic relationship. 8. The sign of the coefficients for this variable is unexpected; therefore we also estimated the dependent variable with host country unemployment as the sole explanatory variable to test this result. Alone, unemployment in the host country behaves consistently with the prior literature (i.e. influences negatively the dependent variable). Moreover, we conducted a similar test for all other explanatory variables, each of which demonstrated effects consistent with past literature. 9. Among EU-24 origin countries we may expect some indifference regarding unemployment in the host country given that European unemployment is generally homogenous across the region. As regards.
(22) 19. analyses. Where significant, higher rates of unemployment in the sending country typically push individuals out, creating immigrant inflows; however, they play a less significant role as a determinant than do host country unemployment rates. Generally, the real unit cost of labor in the host country does not influence migrants’ choice of location. Immigrants from Eastern European countries, nevertheless, seem to be driven towards receiving countries with higher costs of labor. This may be explained in terms of the relationship between labor costs and welfare provisions. Higher unit labor costs often result from the necessity of firms to pay for healthcare benefits, other insurance, and pensions. We should note, then, that relative to the other sub-samples the Eastern European countries more consistently respond positively to social protection expenditure. On the whole, the old-age dependency ratio in the receiving country is not consistent across estimators or sub-samples; however, there is some indication that the former CEE countries now belonging to the EU and the Eastern European countries are not attracted to countries with ageing societies. Among the geospatial and historical relationship variables no overall trend is observable, yet migration originating in EU-24 countries appears to be influenced negatively by migration costs and by prior historic relationships. The latter result may be explained by the existence of the European Union’s Single Market in which several European states possessing formal colonial or colonial-like ties are now highly integrated. The free flow of goods and services throughout the Single Market may substitute for the flow of individuals.10. ignorance to unemployment we may consider any number of examples from the developing world or some Eastern European countries in which information about the rest of the world is scarce and local conditions are poor enough to motivate emigration regardless. 10. Warin and Svaton (2008) have similar findings regarding colonial relationship, which they substantiate using the same conjecture based on the Single Market..
(23) 20. Table 4: Social Perception Estimation 1 Dependent variable: Immigrant inflow as a percentage of host country population LSDV Log-log specification World EU-24 CEE Herd (immigrant inflow into the host .9534*** .9814*** .9058*** country lagged one additional period) [.0093] [.0090] [.0282] -.0194*** -.0106* -.0678** Stock of Immigrant Population [.0071] [.0055] [.0264] -.0934* .0180 .6116** Total Social Protection Expenditure [.0492] [.0374] [.2983] .2003*** .0804*** .6639*** Host Country Unemployment [.0363] [.0304] [.1507] .0523** .0868*** .1806* [.0228] [.0253] [.0985] Origin Country Unemployment .2706 -.0208 2.0662 [.6150] [.5791] [1.8730] Host Country Cost of Labor .0603 .1194 -.2519 Host Country Old Age Dependency Ratio [.1451] [.1250] [.4870] 5.72e-10* -1.97e-08** 7.82e-08*** Geographical Distance [3.09e-10] [8.47e-09] [2.79e-08] .0443 -.0845** .1994 History [.0376] [.0408] [.1627] -1.0603 -.6920 -15.8703* Constant [2.8811] [2.7359] [9.4252] Host Country Fixed Effects no no no Year Fixed Effects no no no N 1083 376 143 F, chi2 1811.85 2221.25 277.41 2. r Standard Errors in Brackets *p<0.10 **p<0.05 ***p<0.01. 0.9377. 0.9816. 0.946. EE 7739*** [.0530] .0043 [.0590] .7489* [.4187] 1.0535*** [.2304] .1864 [.2745] 5.7165** [2.7148] -2.6772*** [.8835] 3.22e-08 [3.17e-08] .9453*** [.2910] -26.4635* [13.6182] no no 88 74.48. Dev.World .9358*** [.0216] -.0127 [.0192] -.2855** [.1189] .1188 [.0798] .0500 [.0438] 1.1649 [1.3120] .3420 [.3245] 7.53e-10 [9.90e-10] .1152 [.0796] -4.2284 [6.1389] no no 381 415.25. 0.8837. 0.9075.
(24) 21. Table 5: Social Perception Estimation 2 Dependent variable: Immigrant inflow as a percentage of host country population GLS Log-log specification World EU-24 CEE Herd (immigrant inflow into the host .7850*** 1.0107*** .6859*** country lagged one additional period) [.0204] [.0239] [.0810] .0301* -.0541*** .0672 [.0163] [.0184] [.0897] Stock of Immigrant Population .1871 -.9539*** -.8374 [.3404] [.2777] [1.3534] Total Social Protection Expenditure .2835*** .0727 .8967*** [.0871] [.0835] [.2431] Host Country Unemployment .0207 .1078*** -.0888 [.0212] [.0272] [.0928] Origin Country Unemployment 1.6994** .8516 .2885 [.7094] [.6759] [2.0865] Host Country Cost of Labor -1.1003** -.1082 -5.2480*** [.4402] [1.2463] Host Country Old Age Dependency Ratio [.4783] -4.52e-10 -1.47e-08 5.99e-09 [3.07e-10] [9.08e-09] [4.30e-08] Geographical Distance .1278*** -.0523 .5689*** [.0373] [.0462] [.1604] History -6.1753 [4.8398] Constant yes yes yes Host Country Fixed Effects yes yes yes Year Fixed Effects N 1083 376 143 F, chi2 20326.38 32037.47 8344.25 r2 Standard Errors in Brackets *p<0.10 **p<0.05 ***p<0.01. 0.5219. 0.6822. 0.8213. EE .6292*** [.1068] .0414 [.1015] .8114 [3.0267] .6734 [.5988] .2795 [.3607] 1.8341 [3.3593] -4.4557 [3.1095] 3.62e-08 [4.66e-08] -3.0018 [41.6631] yes yes 88 2760.65. Dev.World .6444*** [.0459] .0838* [.0439] 1.3730* [.8108] .0496 [.1942] -.0281 [.0439] 3.5268** [1.5202] -1.0114 [1.2126] -1.98e-09* [1.17e-09] .1716** [.0815] -24.5927** [11.0893] yes yes 381 4629.4. 0.5336. 0.463.
(25) 22. Table 6: Social Perception Estimation 3 Dependent variable: Immigrant inflow as a percentage of host country population FGLS: Parks-Kmenta Method World .9573*** [.0045] -.0177*** [.0028] Stock of Immigrant Population -.0698** [.0308] Total Social Protection Expenditure .1691*** [.0169] Host Country Unemployment .0642*** [.0109] Origin Country Unemployment -.0346 [.2465] Host Country Cost of Labor .0255 Host Country Old Age Dependency Ratio [.0628] Herd (immigrant inflow into the host country lagged one additional period). Geographical Distance History. Constant Host Country Fixed Effects Year Fixed Effects N F, chi2. EU-24 .9843*** [.0057] -.0127*** [.0030] .0341 [.0377] .1042*** [.0212] .0902*** [.0153] .0070 [.2932] .1249 [.0788]. CEE .9036*** [.0231] -.0699*** [.0247] .6936*** [.2148] .5326*** [.1514] .1576** [.0701] 2.2437 [1.5666] -.4732 [.4579]. 5.40e-10*** -2.65e-08*** 1.12e-07*** [1.60e-10] [7.45e-09] [2.68e-08] .0387*** -.1105*** .2528** [.0107] [.0171] [.1040] .2887 [1.1399] no no 1079 105951.92. -1.0335 [1.4161] no no 376 147180.1. -16.4245** [4.4789] no no 143 10271.34. EE .8073*** [.0472] -.0419 [.0439] .8047** [.3270] .9441*** [.1588] .3409** [.1567] 7.0552*** [1.0130] -2.7810*** [.5960]. Dev.World .9472*** [.0111] -.0107 [.0073] -.2850*** [.0704] .0673* [.0407] .0730*** [.0192] .2482 [.5390] .4102*** [.1438]. 4.73e-08** [2.38e-08] -.8660*** [.2425]. 4.34e-10 [4.05e-10] .0748** [.0306]. -33.1267*** [5.844] no no 88 944.68. -.1406 [2.5275] no no 377 35872.27. r2 Standard Errors in Brackets *p<0.10 **p<0.05 ***p<0.01. 6. POLICY IMPLICATIONS AND CONCLUSION At the outset of this paper we criticized the rationale behind prior empirical studies of migration in so far as they have not included sufficient mechanisms that capture the effects of social perception. Our results strongly support the above notion. Applying Bauer et al.’s (2002) conception of herd behavior to the unique EU-15 anchored dataset characterizing the European bilateral migration context developed by Warin and Svaton (2008) in the gravity framework, we believe that our study enhanced the understanding and the estimation of European immigration in prior articles. The paramount finding that herd behavior is not only present, but is also a major determinant of immigration in the European context indicates that more attention must be directed towards understanding social perception phenomena where immigration is concerned. Moreover, we suggest a reevaluation of the complacent acceptance among empirical economists of the network effect as a determinant of migration flows. Having noted that the.
(26) 23. network externality is likely to exhibit an inverse U-shaped relationship with immigrant inflows, we must consider that network effects can also occur in the negative direction such as we observed in immigrant flows from EU-24 countries. In addition, the demonstration of diminished significance of network effects when evaluated alongside herd effects inclines us to reason that much of the literature confirming the network effect may have in fact been capturing some of the herd behavior. We caution future studies, therefore, to highlight the interaction between networks and herd behavior. Herds can give rise to networks and networks can likewise generate herds. Based on the above, policy makers concerned with immigration should reconsider the weight they attribute to economic and welfare explanations. Many immigrants may choose their destinations irrespective of labor market conditions and state-provided safety nets. Coordinated economic and welfare policy-making that specifically targets reduced immigration may be ineffective or even damaging. Reduction of social protection expenditures for new migrants, for example, as a deterrent against immigration is likely to cause more harm than to reduce immigrant inflows. If this is the case, then the only solution is to provide accurate and copious information to prospective immigrants around the globe such that they make optimal locational choices rather than relying on herd instincts..
(27) 24. Appendix Table A: Variables Explained Variable. Definition. Source. INFLOW immigrant inflow as a percentage of host country population HERD - immigrant inflow as a percentage of host country population (with lag) NETWORK - stock of immigrant population SOC_TOT - total social protection expenditure UE_H unemployment rate of the host country UE_O unemployment rate of the origin country. Inflow of foreign population into the host country as apercentage of host country population. Organization for Economic Co-operation and Development (OECD). 2008. OECD International Migration Outlook 2008. Paris: OECD Publishing.. Inflow of foreign population into the host country as apercentage of host country population lagged on period.. Organization for Economic Co-operation and Development (OECD). 2008. OECD International Migration Outlook 2008. Paris: OECD Publishing.. Stock of foreign population by nationality in the host country as a percentage of host country population. Aggregate social protection expenditure (all functions) measured in PPS per inhabitant in the host country. Rate of unemployment in the host country, total (percent of total labor force) Rate of unemployment in the origin country, total (percent of total labor force). Organization for Economic Co-operation and Development (OECD). 2008. OECD International Migration Outlook 2008. Paris: OECD Publishing. European Commission. 2008a. Eurostat. Vol.2009. European Union: Luxembourg.. Real unit labor costs in the host country, total economy (Performance relative to the rest of 14 EU countries: Former EU15 excluding Luxembourg) double export weights. Old age dependency ratio in the host country.. European Commission. 2008a. Eurostat. Vol.2009. European Union: Luxembourg.. Geodesic distance calculated by the great circle formula using latitude and longitude of the most important cities in terms of population. Dummy variable signals 1 if the members of a pair were ever engaged in a colonial colonial-like relationship.. Centre D'Etudes Prospectives et D'Informations Internationales (CEPII). 2006. CEPII Distance Database. Paris: CEPII.. LABOR - cost of labor of the host country AGE - old age dependency of the host country DIST geographical distance HISTORY historical relationship. World Bank. 2009. World Development Indicators. Vol. 2009. The World Bank: Washington. World Bank. 2009. World Development Indicators. Vol. 2009. The World Bank: Washington.. European Commission. 2008a. Eurostat. Vol.2009. European Union: Luxembourg.. Centre D'Etudes Prospectives et D'Informations Internationales (CEPII). 2006. CEPII Distance Database. Paris: CEPII..
(28) 25. References. Alecke, B., Huber, P., and Untiedt, G. (2001): “What a Difference a Constant Makes: How Predictable are International Migration Flows?,” Migration Policies and EU Enlargement: The Case of Central and Eastern Europe, 63-78. Paris: OECD. Bauer, T., Epstein, G., and Gang, I.N. (2000): “What are Migration Networks?,” IZA Discussion Paper Series (200). ---------------------. (2002): “Herd Effects or Migration Networks? Location Choice of Mexican Immigrants in the U.S.,” IZA Discussion Paper Series (551). Bonardi, J.P., and Warin, T. (2007): “Open Source Software Development, Innovation, and Coordination Costs,” Global Business & Economics Anthology (ed. D. Kantarelis), vol. II, December. Borjas, G. J. (1994): “The Economics of Immigration.” Journal of Economic Literature, Vol. 32, 1667-1717. ---------------------. (1999): “Immigration and Welfare Magnets.” Journal of Labor Economics, Vol. 17(4-pt.1), 607637. Borjas, G. J. and Trejo, S.J. “Immigrant Participation in the Welfare System.” Industrial and Labor Relations Review, Vol. 44 (2), 195-211. Bruder, J. (2003): “East-West Migration in Europe, 2004-2015,” Thünen-Series of Applied Economic Theory, Working Paper (40). Epstein, G.S. (2002): “Informational Cascades and Decision to Migrate,” IZA Discussion Paper Series (445). Gottlieb, P. (1987): Making Their Own Way: Southern Blacks’ Migration to Pittsburgh, 1916-1930. Urbana: University of Illinois Press. Grossman, J.R. (1989): Land of Hope: Chicago, Black Southerners, and the Great Migration. Chicago: University of Chicago Press. Keynes, J.M. (1936): The General Theory of Employment, Interest, and Money. London: Macmillan. Kmenta, J. (1997): Elements of Econometrics. Michigan: University of Michigan Press. Massey, D.S., Arango, J., Hugo, G., Kouaouci, A., Pellegrino, A., and Taylor, J.E. (1993): “Theories of International Migration: A Review and Appraisal,” Population and Development Review, Vol. 19(3), 431-466. Munshi, K. (2003): “Networks in the Modern Economy: Mexican Migrants in the U.S. Labor Market.” The Quarterly Journal of Economics, Vol. 118 (2), 549-599. Parks, R.W. (1967): “Efficient Estimation of a System of Equations When Disturbances are Both Serially and Contemporaneously Correlated.” Journal of the American Statistical Association. 62(318), 500-509. Pedersen, Peder J., Pytlikova, M., and Smith, N. (2008): “Selection and Network Effects—Migration Flows into OECD countries 1990-2000.” European Economic Review, Vol. 52, 1160-1186. Rainer, H. and Siedler, T. (2008): “Social Networks in Determining Migration and Labor Market Outcomes: Evidence from the German Reunification,” Working Paper..
(29) 26 Ravenstein, E.G. (1889): “The Laws of Migration,” Journal of the Royal Statistical Society, Vol. 52(2), 241-305. Rubinstein, Ariel (1989), “The Electronic Mail Game: Strategic Behavior Under "Almost Common Knowledge"”, The American Economic Review, Volume 79, Issue 3, June, 385-391. Sjaastad, L.A. (1962): “The Costs and Returns of Human Migration,” The journal of Political Economy, Vol. 70(5 pt.2), 80-93. Todaro, M.P. (1969): “A Model of Labor Migration and Urban Unemployment in Less Developed Countries,” The American Economic Review, Vol. 59(1), 138-148. Warin, T. and Svaton, P. (2008) “European Migration: Welfare Migration or Economic Migration?,” Global Economy Journal, Vol. 8(3). Berkeley: Berkeley Electronic Press. Zavodny, M. (1998): “Determinants of Recent Immigrants’ Locational Choices,” Federal Reserve Bank of Atlanta, Working Paper (98-3)..
(30)
Figure

+5

Documents relatifs
In Europe, the repeated introductions of West Nile and Usutu viruses have been associated with bird migration from Africa, whereas the autochthonous transmission of
CAESAR countries and areas: Albania, Armenia, Azerbaijan, Belarus, Bosnia and Herzegovina, Georgia, Kazakhstan, Kyrgyzstan, Montenegro, the Republic of Moldova, the Russian
The Central Asian and Eastern European Surveillance of Antimicrobial Resistance (CAESAR) network originated in 2012 as a partnership between the WHO Regional Office for Europe,
and i v) the presence of humans in images, particularly the gender distribution in positive and in negative impact images. For the analy sis a specific part of the grid
DD_KMV = Distance to Default estimated with KMV approach; DD_Duan = Distance to Default estimated with Duan’s approach; Zscore1 = Zscore estimated with equation (4); Zscore3 =
The model constructed in this way has a good in-sample performance indentifying contagion, growing private sector indebtedness, short-term capital inflows, and interest and
Thus, even if respect for family life is among the fundamental rights safeguarded by international and European conventions, hardened national migration laws
For example, all the Czech, Hungarian and Slovakian regions, except for their capital regions are in regional class 1 (specialized in industry), while these three countries
