HAL Id: hal-01507419
https://hal.archives-ouvertes.fr/hal-01507419
Submitted on 13 Apr 2017
HAL is a multi-disciplinary open access
archive for the deposit and dissemination of
sci-entific research documents, whether they are
pub-lished or not. The documents may come from
teaching and research institutions in France or
abroad, or from public or private research centers.
L’archive ouverte pluridisciplinaire HAL, est
destinée au dépôt et à la diffusion de documents
scientifiques de niveau recherche, publiés ou non,
émanant des établissements d’enseignement et de
recherche français ou étrangers, des laboratoires
publics ou privés.
black marl gully from a time series of high-resolution
digital elevation models (DEMs)
J. Bechet, J. Duc, A. Loye, M. Jaboyedoff, N. Mathys, J.P. Malet, S. Klotz, C.
Le Bouteiller, B. Rudaz, J. Travelletti
To cite this version:
J. Bechet, J. Duc, A. Loye, M. Jaboyedoff, N. Mathys, et al.. Detection of seasonal cycles of erosion
processes in a black marl gully from a time series of high-resolution digital elevation models (DEMs).
Earth Surface Dynamics, European Geosciences Union, 2016, 4 (4), pp.781-798.
�10.5194/esurf-4-781-2016�. �hal-01507419�
Earth Surf. Dynam., 4, 781–798, 2016 www.earth-surf-dynam.net/4/781/2016/ doi:10.5194/esurf-4-781-2016
© Author(s) 2016. CC Attribution 3.0 License.
Detection of seasonal cycles of erosion processes in
a black marl gully from a time series of
high-resolution digital elevation models (DEMs)
Jacques Bechet1,†, Julien Duc1, Alexandre Loye1, Michel Jaboyedoff1, Nicolle Mathys2, Jean-Philippe Malet3, Sébastien Klotz2, Caroline Le Bouteiller2, Benjamin Rudaz1, and
Julien Travelletti3,a
1University of Lausanne, Risk-group – ISTE – Institute of Earth Sciences, Lausanne, Switzerland 2IRSTEA Grenoble, Unité de recherche Erosion Torrentielle, Neige et Avalanches, BP 76,
38402 Saint Martin d’Hères, France
3Institut de Physique du Globe de Strasbourg, CNRS UMR 7516, Ecole et Observatoire des Sciences de la Terre, Université de Strasbourg, 5 rue Descartes, 67084 Strasbourg, France
anow at: BEG – Bureau d’Etudes Géologiques SA, Rue de la Printse 4, 1994 Aproz, Switzlerland †deceased, 28 March 2015
Correspondence to:Michel Jaboyedoff ([email protected])
Received: 1 December 2015 – Published in Earth Surf. Dynam. Discuss.: 18 December 2015 Revised: 12 August 2016 – Accepted: 19 September 2016 – Published: 19 October 2016
Abstract. The Roubine catchment located in the experimental research station of Draix-Bléone (south French Alps) is situated in Callovo-Oxfordian black marls, a lithology particularly prone to erosion and weathering processes. For 30 years, this small watershed (0.13 ha) has been monitored for analysing hillslope processes on the scale of elementary gullies.
Since 2007, surface changes have been monitored by comparing high-resolution digital elevation models (HRDEMs) produced from terrestrial laser scanner (TLS). The objectives are (1) to detect and (2) to quantify the sediment production and the evolution of the gully morphology in terms of sediment availability/transport ca-pacity vs. rainfall and runoff generation. Time series of TLS observations have been acquired periodically based on the seasonal runoff activity with a very high point cloud density ensuring a resolution of the digital elevation model (DEM) on the centimetre scale. The topographic changes over a time span of 2 years are analysed.
Quantitative analyses of the seasonal erosion activity and of the sediment fluxes show and confirm that during winter, loose regolith is created by mechanical weathering, and it is eroded and accumulates in the rills and gullies. Because of limited rainfall intensity in spring, part of the material is transported in the main gullies, which are assumed to be a transport-limited erosion system. In the late spring and summer the rainfall intensities increase, allowing the regolith, weathered and accumulated in the gullies and rills during the earlier seasons, to be washed out. Later in the year the catchment acts as a sediment-limited system because no more loose regolith is available. One interesting result is the fact that in the gullies the erosion–deposition processes are more active around the slope angle value of 35◦, which probably indicates a behaviour close to dry granular material.
It is also observed that there exist thresholds for the rainfall events that are able to trigger significant erosion; they are above 9 mm rainfall or of an intensity of more than 1 mm min−1, values which can vary if antecedent precipitation is significant within the last 5 days.
This study improves knowledge of the spatial distribution of erosion seasonality in badlands and demonstrates the potential of careful 3-D high-resolution topography using TLS to improve the understanding of erosive processes.
1 Introduction
This study is integrated into the cross-disciplinary re-search activities conducted in the Draix-Bléone catchments (SOERE-RBV, i.e. network of catchments for the study of the critical zone; see http://portailrbv.sedoo.fr/), composed of seven nested catchments characterized by several sizes and types of vegetation cover. This work focuses on the anal-ysis of the processes controlling the annual pattern of ero-sion rates in elementary gullies (Richard, 1997; Meunier and Mathys, 1995; Mathys et al., 2005).
The region of Draix, where the study was conducted, is located within Jurassic, black marls of Callovo-Oxfordian age (also called Terres Noires), which cover large areas in south-east France. The badlands landscape observed in these clay-shale catchments is the result of the conjunction of favourable lithological and climatic factors. Freeze–thaw and wetting–drying cycles progressively disintegrate the black marl formation, thus favouring the annual development of a weathered marly layer exposed to surface runoff erosion and shallow landslides (Antoine et al., 1995; Maquaire et al., 2003). The weathered marls can be mobilized by Hortonian runoff, especially during high-intensity rainfalls in summer. This causes flash floods and hyperconcentrated flows, induc-ing significant problems in sedimentation reservoirs and river systems (Oostwoud Wijdenes and Ergenzinger, 1998; De-scroix and Olivry, 2002). Saturation of the weathered marl layers can also locally trigger shallow landslides supplying high sediment loads to the basins. In addition, rain infiltra-tion in the fractured marl bedrock contributes to the trigger-ing of larger landslides whose geometry is controlled by the bedding and the discontinuities. There is a strong seasonal difference between the rates of surface erosion processes in summer and winter (Descroix and Gautier, 2002; Descroix and Mathys, 2003); the erosion processes therefore have an annually cyclic activity pattern.
A terrestrial laser scanner (TLS) is a powerful tool to mon-itor erosion processes on the gully scale at a relatively low cost (Perroy et al., 2010; Jaboyedoff et al., 2012) where high spatial-resolution data on surface changes are needed (Ja-come, 2009). Such high-resolution mapping of erosion rates on a fine (e.g. seasonal) temporal scale for an entire catch-ment is innovative and represents considerable progress in the field of erosion assessment (Lopez Saez et al., 2011). Pre-liminary studies show a great potential of TLS to measure and map surface erosion (Puech et al., 2009) since it can de-tect millimetre-scale changes at short-range distances (50 m; Abellán et al., 2009).
In this study, time series of intra-annual TLS observations are used to quantify surface erosion. The main objectives are (i) to create erosion and deposition maps for every season; (ii) to estimate the sediment budget and evaluate the accu-racy of the volume calculation on the catchment scale by
comparing it to sediment trap observation; and (iii) to pro-pose a conceptual model describing the observed seasonal pattern of erosion and deposition. The results allow the iden-tification and quaniden-tification of the topographic changes in the catchment in terms of regolith development, slope transfer processes, and transient storages of sediment within the rills and gullies. This is placed in the context of previous work on similar black marl slopes, confirming the high impact of season on erosion process cycles.
2 Physio-geographic settings of the study area: the Roubine catchment
2.1 Morphology
The research has been conducted in the Draix-Bléone ex-perimental catchments (SOERE RBV network, Systèmes d’Observation et d’Expérimentation pour la Recherche en Environnement Réseau de Bassins Versants) in south-east France, near the city of Digne-les-Bains (Alpes-de-Haute-Provence). Draix-Bléone observatory is composed of seven small mountain watersheds. It was created by IRSTEA (In-stitut national de recherche en sciences et technologies pour l’environnement et l’agriculture) in 1983 in order to bet-ter understand erosion and sediment transfer processes, in-cluding hyperconcentrated floods, and to improve the design of protections in response to erosion processes. The experi-mental site selected for this work is the Roubine elementary catchment (Fig. 1), which is the smallest (1330 m2) moni-tored watershed of the Draix experimental site (Mathys et al., 2003). No human activity has been conducted within the gully since the setup of the observatory in 1983.
This elementary watershed has a typical badland morphol-ogy, characterized by v-shaped gullies, steep slopes (35 to 45◦), and low-vegetation coverage (ca. 20 %). The Roubine elementary catchment is made up of one main gully that crosses it from east to west. This gully separates the catch-ment into a north- and a facing slope. On the south-facing slope, a secondary gully crosses diagonally in the di-rection north-east to south-west and joins the main gully at the catchment outlet. Both north- and south-facing slopes have with many small gullies and rills of decametric widths. A few unweathered marl outcrops can be observed in the steepest sections of both slopes. On these outcrops, the dip of the black marl formation is 25◦to the east, which has an impact on erosion processes (Esteves et al., 2005; Mathys et al., 2005). The scarce vegetation cover is made up of a few black pines (Pinus nigra) and tufts of grass restricted to the flatter interfluves near the sediment trap and on the top of the crests.
A sediment trap, a stream gauge and an automatic sampler are installed at the bottom of La Roubine in order to monitor the sediment yield and the water discharge (Mathys et al.,
J. Bechet et al.: Detection of seasonal cycles of erosion processes 783
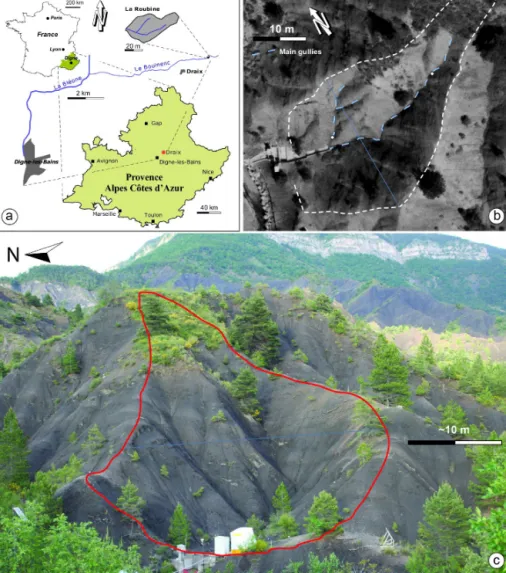
Figure 1.Location and picture of La Roubine. (a) Location of La Roubine catchment. (b) Aerial image of La Roubine. (c) Photograph of the Roubine catchment (1 June 2011) with the contours indicated in red line. Foreground: La Roubine catchment characterized by a typical badland morphology, many small-scale rills and gullies, steep slopes, and scarce vegetation. The catchment outlet is located at the western extremity with the sediment trap and the limnigraph. Background: surrounding badlands and limestone ridge.
2003). Rainfall observations are collected by a rain gauge located 20 m from the Roubine outlet.
2.2 Geology
Large areas of south-east France are covered by black marls, which outcrop over more than 10 000 km2in the watershed of the Durance river (Légier, 1977; Phan and Antoine, 1994; Mathys et al., 1996). This sedimentary lithology is com-posed of alternating marl and limestone sequences whose ages range from Lias to Cretaceous. The marly sequence which outcrops in the Draix-Bléone catchments is from the Bathonian to Oxfordian, and its thickness can exceed 2000 m in some places (Antoine et al., 1995; Maquaire et al., 2003). These black marls are overlain by limestones, creating cliffs in the upper part of the Draix catchment (Ballais, 1999).
The mean erosion rate of the black marls averaged over 3 years (1985–1987) is 8 mm yr−1, which is approximately 100 t ha−1yr−1 (Olivry and Hoorelbeck, 1989) and more specifically 100 t ha−1yr−1 or 13 mm yr−1 for the Roubine catchment.
2.3 Climate
The specific features of a Mediterranean mountain climate influence slope erosion rates with strong seasonal and yearly differences in temperature and rainfall. At Draix, the mean annual rainfall is 920 mm, with an interannual variability of nearly 400 mm over the period 1970–2000. The summer is relatively dry, but several heavy thunderstorms can oc-cur, the intensity of which sometimes exceeds 60 mm h−1 (Richard, 1997) and can even reach more than 100 mm h−1
during a few minutes (Yamakoshi et al., 2009), i.e. 210, 138, 90, 74 and 45 mm h−1 respectively during 1, 5, 15, 30 and 60 min (Mathys, 2006). These events trigger hyper-concentrated flows characterized by suspended sediment dis-charge of up to 800 g L−1(Olivier, 1999). Micro-debris flows (MDFs) have also been observed (Oostwoud Wijdenes and Ergenzinger, 1998) and clearly associated with high ero-sive events (Yamakoshi et al., 2009, 2010). Hailstorms are not unusual. During spring and autumn seasons, the rain-fall amounts are at their maxima. During the winter, very small amounts of rainfall are measured, but over 100 cycles of freezing–thawing are observed (Oostwoud Wijdenes and Ergenzinger 1998; Rovera and Robert, 2005). A snow cover can form but does not usually last the whole winter. The av-erage yearly air temperature is 10.9◦C with a standard devi-ation of 8.7◦C (based on daily average temperature) over the period 1970–2000.
3 Methodology 3.1 TLS measurements
The study site has been monitored using a TLS. This remote scanning device is a monochromatic laser pulse transmit-ter/receiver. The laser beam pulses are oriented using mir-rors or by moving the laser source mechanically or both. The time of flight (TOF) is the time for the pulses to travel the double distance (d), at the speed of light (c), to the reflecting surfaces (2 × d = c × TOF). In practice the laser has a foot-print that increases in diameter with increasing distances to the target. The operation is repeated millions of times giving access to a very dense grid of XY Z points (Shan and Toth, 2008). Two types of TLS were used for this study: TLS1 is an Ilris 3-D (Optech, Canada) scanner, and TLS2 is a TotalSta-tion II (Leica, Germany) scanner. The TLS1 laser is infrared (1535 nm) and the performance coming from the manufac-turer indicates that it produces data with an accuracy of 8 mm with a spot diameter of 22 mm at 100 m. The TLS2 laser is in the green wavelength (only information available from the manufacturer) with 6 mm accuracy and a 6 mm spot size at 50 m.
3.2 Data acquisition and processing
Twelve TLS campaigns were performed from 9 May 2007 to 4 November 2010 (Table 1). The data of the years 2007 and 2008 are sparser as the methodology and protocol were being developed. In 2009 and 2010, TLS data were acquired more regularly throughout the year in order to take into account more precisely the influences of the seasonal rainfall.
For each TLS campaign, the measurements were per-formed from up to five different scan positions in order to minimize shadow areas. However, some shadow areas still remain because of the presence of foreground in the line of sight of the scanner or of vegetation. All scan spatial
resolu-tions are less than 10 mm at a 50 m distance range. The point cloud density is very high for all the time series and ranges from 0.3 to 3 pts cm−2.
The software Polyworks V. 9.1.8. (InnovMetric, 2010) was used to process the TLS point clouds. First, the vegetated ar-eas are deleted from the raw point clouds in order to keep only the bare soil surface for the analysis. The scans of each campaign are then aligned using the iterative closest point (ICP) procedure (Chen and Medioni, 1992; Besl and McKay, 1992) to obtain a point cloud of the entire catch-ment. The TLS campaigns are aligned to a reference cam-paign (e.g. June 2009) using eight white 180 mm diameter styrene spheres located around the catchment since 2008. Depending on the TLS distance of acquisition and the over-lapping of the different scenes, the final point cloud density is variable; thus, each TLS point cloud has been interpolated into a homogeneous 0.02 m high-resolution digital elevation model (HRDEM) using the Surfer 8 (GoldenSoftware) in-verse distance method (Shepard, 1968). A high-density point cloud produces an over-defined problem during the inter-polation due to too many points being present in one grid cell (Schürch et al., 2011). If we do not consider the sys-tematic error (which will be discussed separately later), the law of large numbers (Kromer et al., 2015) indicates that the accuracy will increase when the average is taken, as-suming that the surface is locally planar, on the centimetre scale. As an example, considering that the lower accuracy for one point is σ1=8 mm. Performing an average on a surface area of 4 cm2(2 × 2 cm) with densities ranging from 0.3 to 3 pts cm−2(n = 1.2 and 12 pts in 4 cm2) provides an accuracy ranging from 6.7 to 2.3 mm because σnis given by (σ12/n)0.5, assuming that the point cloud is well georeferenced. In some cases, TLS data can allow detecting movements below 1 mm because of the law of large numbers (Kromer et al., 2015).
We do not consider horizontal error for two main rea-sons: (1) the effect of the slope orientation on the measure-ment of point location is very similar for each scan (the av-erage slope does not change significantly between scans); (2) when merging the scan with ICP, the errors between scans include their horizontal components. This error does not exceed the thresholds we used for detecting erosive pro-cesses (see Sects. 3.5 and 4.1). Assuming the systematic er-rors caused by slope orientation are similar (except for iden-tified other problems) for all scans, we do not tackle this topic in more detail.
3.3 Calculation of vertical difference HRDEMs: location of erosion-prone areas and quantification of volume changes
To quantify and map the erosion and deposition through time, the most recent HRDEM was subtracted from an earlier HR-DEM (DeRose et al., 1998). The resulting elevation changes have negative pixel values representing erosion and positive pixel values representing deposition.
J. Bechet et al.: Detection of seasonal cycles of erosion processes 785
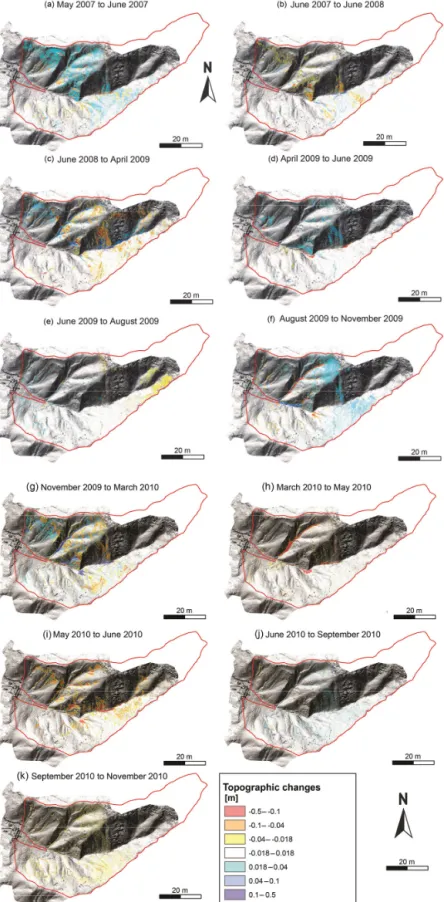
Figure 2.Observed height differences for the period 2007–2010 highlighting the soil surface changes of La Roubine catchment. The red outline indicates the boundary of the catchment (see large version in the Supplement).
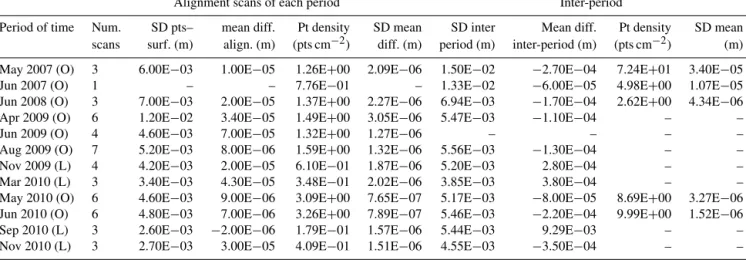
Table 1.Characteristics of the TLS alignment with, for each time period, the information on the number of scans used to create a scene. The table indicates standard deviation (SD) of the point from the surface matched (point-to-surface ICP), the mean difference between two scans (either used to align with period or for inter-period comparison), the average point density used, and the standard deviation of the average mean difference.
Alignment scans of each period Inter-period
Period of time Num. SD pts– mean diff. Pt density SD mean SD inter Mean diff. Pt density SD mean
scans surf. (m) align. (m) (pts cm−2) diff. (m) period (m) inter-period (m) (pts cm−2) (m)
May 2007 (O) 3 6.00E−03 1.00E−05 1.26E+00 2.09E−06 1.50E−02 −2.70E−04 7.24E+01 3.40E−05
Jun 2007 (O) 1 – – 7.76E−01 – 1.33E−02 −6.00E−05 4.98E+00 1.07E−05
Jun 2008 (O) 3 7.00E−03 2.00E−05 1.37E+00 2.27E−06 6.94E−03 −1.70E−04 2.62E+00 4.34E−06
Apr 2009 (O) 6 1.20E−02 3.40E−05 1.49E+00 3.05E−06 5.47E−03 −1.10E−04 – –
Jun 2009 (O) 4 4.60E−03 7.00E−05 1.32E+00 1.27E−06 – – – –
Aug 2009 (O) 7 5.20E−03 8.00E−06 1.59E+00 1.32E−06 5.56E−03 −1.30E−04 – –
Nov 2009 (L) 4 4.20E−03 2.00E−05 6.10E−01 1.87E−06 5.20E−03 2.80E−04 – –
Mar 2010 (L) 3 3.40E−03 4.30E−05 3.48E−01 2.02E−06 3.85E−03 3.80E−04 – –
May 2010 (O) 6 4.60E−03 9.00E−06 3.09E+00 7.65E−07 5.17E−03 −8.00E−05 8.69E+00 3.27E−06
Jun 2010 (O) 6 4.80E−03 7.00E−06 3.26E+00 7.89E−07 5.46E−03 −2.20E−04 9.99E+00 1.52E−06
Sep 2010 (L) 3 2.60E−03 −2.00E−06 1.79E−01 1.57E−06 5.44E−03 9.29E−03 – –
Nov 2010 (L) 3 2.70E−03 3.00E−05 4.09E−01 1.51E−06 4.55E−03 −3.50E−04 – –
O: lidar Optech Ilris 3-D; L: lidar Leica TotalStation II.
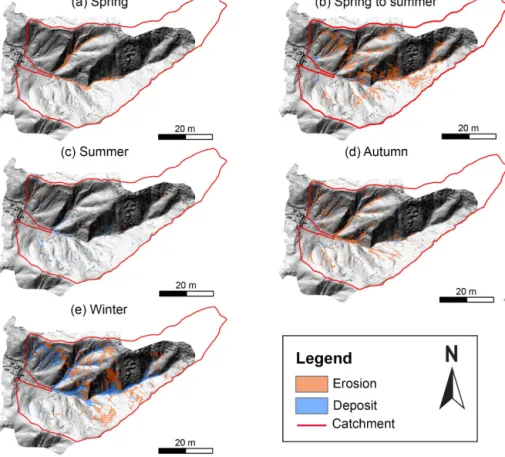
Eleven differences between successive HRDEMs provid-ing digital elevation models (DEMs) of differences (DoDs) have been calculated from 9 May 2007 to 4 November 2010 (Fig. 2). Because the occurrence of processes is strongly re-lated to each season, the HRDEMs are sorted by seasonal periods. The mapping of the different erosion and deposi-tion areas is carried out for each season by taking into ac-count the DoDs of the corresponding seasons. These compar-isons allow the detection and mapping of the most erosion– deposition-prone areas in the catchment (Fig. 3) and the characterization of the annual pattern of erosion (Betts and DeRose, 1999). These maps represent a synthesis of the DoDs (Fig. 2) showing the erosion or deposition areas. On these maps (Fig. 3), the erosion areas are displayed in orange and the deposition areas are in blue (see also the video in the Supplement).
To quantify the volume of soil surface changes, the ele-vation differences are summed and multiplied by the DEM squared cell resolution (0.004 m2). To obtain the sediment budget, the total volume of deposition is subtracted from the total volume of erosion. This calculation provides the final results of topographic changes in cubic metres. To minimize scan alignment inaccuracy on the quantification of the vol-umes, the topographic changes outside the active erosion– prone areas previously mapped have been ignored. Finally, an average density of 1500 kg m−3 for the black marl de-posits was measured in the sediment trap as proposed by Mathys et al. (1996). In addition, the volumes of sediment deposited in the sediment trap increased by 20 % because an annual average of 20 % of the total eroded sediment exits the catchment in water-suspended flows (Mathys, 2006). It must be noted that during major storm events, up to 40 % of sediments can exit the catchment in hyperconcentrated flows
(Mathys, 2006). The corrected volumes are obtained using these two values and the results are used to calibrate the TLS volumes in order to take into account the expansion. This has been done because some vegetated areas and some oc-clusions exist which are not imaged by the scans (Tables 2 and 3). As a reminder, these corrections were performed be-cause access to the Roubine catchment is prohibited. This allows us to also get a rough idea of the density of the eroded material. It changes throughout the year according to the sea-sons, indicating that in summer the density is close to the bedrock value (i.e. 2325 kg m−3) and during spring it is close to the sediment 1500 kg m−3.
3.4 Slope gradient and aspect
In order to evaluate the role of topographic proxies (slope angle, slope aspect, upstream contributing area (UCA), TO-BIA index; Meentemeyer and Moody, 2000), the DoDs of each period are averaged on a 10 cm grid to reduce noisy values. Several topographic parameters are computed on the June 2010 topography, using ArcGIS (slope angle, aspect, and upstream contributing area) and Matlab (TOBIA). Gul-lies are identified as pixels with UCA values over 10 m2with a 20 cm buffer to account for gully width. This distinguishes slopes from gullies.
The TOBIA index is computed assuming a uniform dip and dip direction of the black marls at 25◦/86◦, as observed in the field and computed using Coltop software (Jaboyedoff et al., 2007).
J. Bechet et al.: Detection of seasonal cycles of erosion processes 787
Figure 3.Typical pattern of slope activity (erosion in orange; deposition in blue) for each predefined season. The red outline indicates the boundary of the catchment (see also the video in the Supplement).
Table 2. Measured volume of erosion and deposition. In order to perform a comparison with Table 3, 0.48 m3have been added to the cumulative volume of the first period.
Start date End date Density Erosion Deposit Balance Cum. vol. Vol. yr−1 Erosion rate (kg m3) (m3) (m3) (m3) (m3) (m3yr−1) (mm yr−1) 14.04.2009 31.05.2009 1500 −0.56 0.27 −0.30 0.78 6.04 4.54 31.05.2009 11.08.2009 2325 −0.38 0.38 −0.01 0.78 0.03 0.02 11.08.2009 03.11.2009 1875 −1.99 1.05 −0.94 1.73 4.09 3.07 03.11.2009 23.03.2010 1875 −4.54 3.34 −1.20 2.92 3.12 2.34 23.03.2010 28.05.2010 1500 −2.74 0.02 −2.72 5.64 15.05 11.32 28.05.2010 23.06.2010 1500 −6.29 0.26 −6.03 11.68 84.71 63.69 23.06.2010 22.09.2010 2325 −0.42 0.05 −0.37 12.04 1.47 1.10 22.09.2010 04.11.2010 1875 −1.78 0.16 −1.62 13.66 13.73 10.33
Volume added for 14 April 2009 0.48
3.5 Sources of errors
The use of TLS observations resulted in several sources of errors that were quantified. First, TLS measurements are affected by instrumental errors as described by Abellán et al. (2009). These authors showed, in particular, that when av-eraging point clouds, the detection of changes improved sig-nificantly. Second, some scans are also affected by
deforma-tion due to atmospheric condideforma-tions. Third, some DoDs con-tain some misalignment characterized by slight tiling due to scan deformation and/or scan alignment inaccuracies; such a source of error is, for instance, clearly visible in Fig. 2f. The use of a high threshold value to validate DoD values to detect the process of erosion or deposition permits us to escape the problems of misalignment or atmospheric deformation (see below). In fact, the quality precision and precision of the two
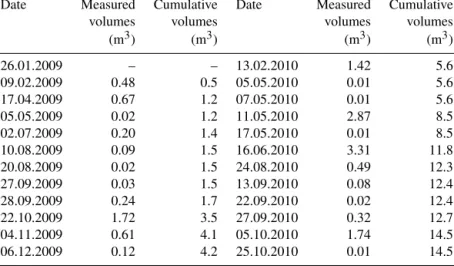
Table 3.Measured volume in the sediment trap.
Date Measured Cumulative Date Measured Cumulative volumes volumes volumes volumes (m3) (m3) (m3) (m3) 26.01.2009 – – 13.02.2010 1.42 5.6 09.02.2009 0.48 0.5 05.05.2010 0.01 5.6 17.04.2009 0.67 1.2 07.05.2010 0.01 5.6 05.05.2009 0.02 1.2 11.05.2010 2.87 8.5 02.07.2009 0.20 1.4 17.05.2010 0.01 8.5 10.08.2009 0.09 1.5 16.06.2010 3.31 11.8 20.08.2009 0.02 1.5 24.08.2010 0.49 12.3 27.09.2009 0.03 1.5 13.09.2010 0.08 12.4 28.09.2009 0.24 1.7 22.09.2010 0.02 12.4 22.10.2009 1.72 3.5 27.09.2010 0.32 12.7 04.11.2009 0.61 4.1 05.10.2010 1.74 14.5 06.12.2009 0.12 4.2 25.10.2010 0.01 14.5
successive alignment procedures, i.e. the scan merging and the “georeferencing”, vary from one measurement campaign to another as the TLS instrument, the scan deformation, and the spatial resolution were different (Table 2).
A possible procedure to estimate the overall errors is to define the quality of (1) the alignments for each campaign and (2) the alignment between campaigns. This corresponds to the measurement of the dispersion of the points between two merged scans (1). This is performed by identifying the areas that have not changed (fixed surfaces like the spheres, wall, etc.). The average distance between two scans and the associated standard deviation is measured using the point-to-surface method. A similar procedure can be applied to suc-cessive campaigns (2). Note that the averaging of the HR-DEM allows us to reduce the noise and minimize other mea-surement errors.
4 Results
4.1 Analysis of soil surface height differences
DoDs outline the slope surface changes on a centimetre scale (Fig. 2). All the DoDs are presented in a plan view on a hillshade of the watershed. The eastern limit of the catch-ment lacks data because of dense vegetation cover. The dif-ferences under 1.8 cm are not displayed. This limit has been chosen according to a trial and error procedure and assum-ing that it contains in most cases above 3 times the max-imum error of alignment of 6 mm, except for the scans of 2007. A clustering of the height differences in three classes is proposed both for erosion and deposition: small height dif-ferences ranging from 1.8 to 4.0 cm; moderate height differ-ences ranging from 4.0 to 10.0 cm; large height differdiffer-ences above 10.0 cm in absolute value. The erosion pattern is played in warm colours, while the deposition pattern is dis-played in cold colours.
4.2 Cartography and temporal pattern of erosion processes
Five erosion patterns are distinguished for La Roubine catch-ment: winter, spring, late spring to early summer, summer, and autumn.
– The winter seasons erosion pattern is illustrated by the DoDs between 3 November 2009 and 23 March 2010 (Fig. 2g).
– The spring seasons erosion pattern is represented by DoDs between 14 April to 1 June 2009 and 23 March to 28 May 2010 (respectively Fig. 2d and h).
– The erosion pattern of late spring to early summer rainy season is illustrated by the DoDs between 9 May to 24 June 2007 and 28 May to 23 June 2010 (respectively Fig. 2a and i). In 2009, the rainfall amount in this season was 30 % below average up to 20 December and 19 % below average for the whole year, only thanks to some late precipitations in the last days of the calendar year, most probably snow. Thus no DoD corresponds to that period in 2009.
– The summer season erosion pattern is represented by DoDs between 1 June to 11 August 2009 and 23 June to 22 September 2010 (respectively Fig. 2e and j). – The autumn season erosion pattern is represented by
DoDs between 11 August to 3 November 2009 and 22 September to 4 November 2010 (respectively Fig. 2f and k).
– During winter seasons (Fig. 3e), the alternating freezing–thawing cycles favour regolith development. Gelifluction (and solifluction during thawing) in the up-per parts of the gullies and on the steep slopes surround-ing the gullies leads to an accumulation of material in
J. Bechet et al.: Detection of seasonal cycles of erosion processes 789
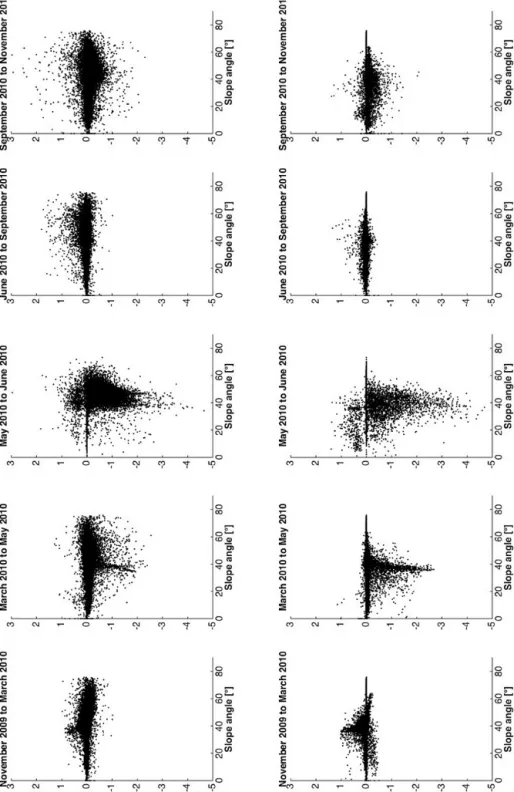
Figure 4.Vertical change over time vs. slope angle. Rates are calculated from a 10 cm grid average of original DoDs and divided by the time separating the two lidar acquisitions. Slope angle in degrees, calculated in ArcGIS on a 10 cm DEM of June 2010. Top graphs of the left column show rates for slopes and the right column for gullies and adjacent (20 cm or closer) pixels (see the Supplement for similar graphs showing vertical change in absolute value vs. slope angle).
the lower parts of the gullies. The soil surface changes are mostly located on the south-facing slopes of the wa-tershed. A higher number of freezing–thawing cycles
results in a higher amount of regolith that can be mo-bilized (Maquaire et al., 2002; Raclot et al., 2005) and therefore more production of sediment along the slopes.
During the spring seasons, (Fig. 3a), the sediment accumu-lated during winter in the main gullies is transported at the outlet of the catchment. This transport is generally limited to the two main gullies. Erosion is transport-limited and conse-quently only the gullies with the larger contributing surface are drained.
During late spring to early summer rainy seasons (Fig. 3b), rainfall can be relatively intense (Mathys et al., 2005). Con-sequently, the secondary rills, gullies, and the steepest slopes can be strongly affected by Hortonian runoff and the weath-ered regolith developed during winter can be washed out. The south-facing slopes are more prone to such a type of erosion pattern as more weathered sediment is produced during win-ters. Often, small deposition levees are observed in the lower (flatter) parts of the gullies.
During the summer seasons (Fig. 3c), characterized by rel-ative drought except for the occurrence of a few thunder-storms, there is very little erosion activity. The same small gullies and rills as those affected by the late spring erosion pattern continue to be eroded in their steepest parts, while de-posits and small levees are formed in their lower parts. Most of the loose weathered regolith has already been washed away. The less frequent but more intense storms observed in this season do not impact the erosion pattern, now sediment-limited.
During the autumn seasons (Fig. 3d), the rainfall pattern is characterized by long and low-intensity events with some very short intense precipitation leading to slow soil wetting and consecutive increase in soil moisture. Progressively, a new layer of regolith is created, and in most of the rills and gullies, sediment transport is reactivated.
4.3 Topographic influences
DoD value changes over time are plotted against topographic proxies. The DoD values are displayed for slopes (left) and gullies (right) for each period (Figs. 4–6; in the Supple-ment, similar figures provide DoD values plotted against to-pographic proxies).
The seasonal cycle is clearly visible on the slope angle vs. DoD rate of change (Fig. 4), with the deposition–erosion cycle during the year and regolith expansion. Autumn and winter periods see an accumulation of loose sediments in the gullies, which are then eroded in late spring or early summer. We may suspect that in winter, the cycle is a slow continu-ous process and in late spring to early summer it was subject to an intensive short erosive event (this can be also an arte-fact because of the unequal time between surveys). In those gullies, both maximum deposition (November to March) and erosion (March to May) are reached at a slope angle of 35◦, a critical slope for granular material (Gotzinger et al., 2007) and thus also for the deposits most susceptible to erosion. The summer and autumn periods show limited change, both in gullies and slopes.
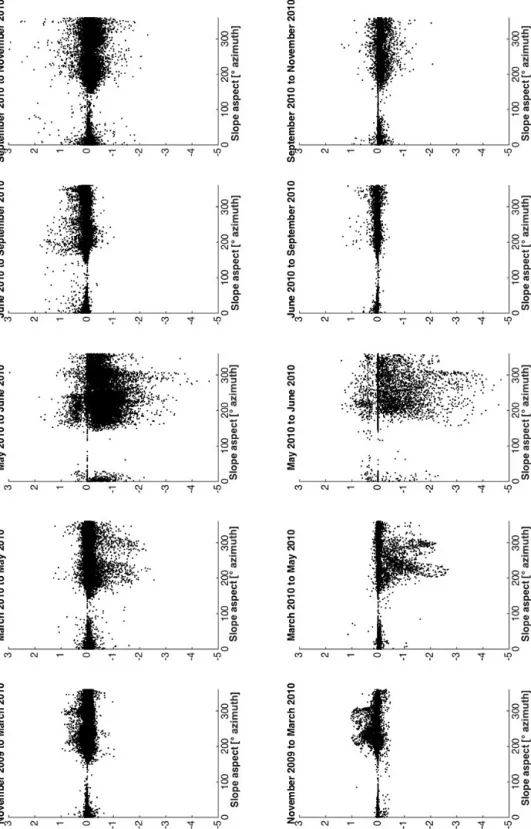
The slope aspect proxy (Fig. 5) also shows the annual cycle and different behaviour between slopes and gullies. South- and south-west-facing slopes are more susceptible to increased erosion and deposition and probably expansion (particularly in the November to March and June to Septem-ber periods).
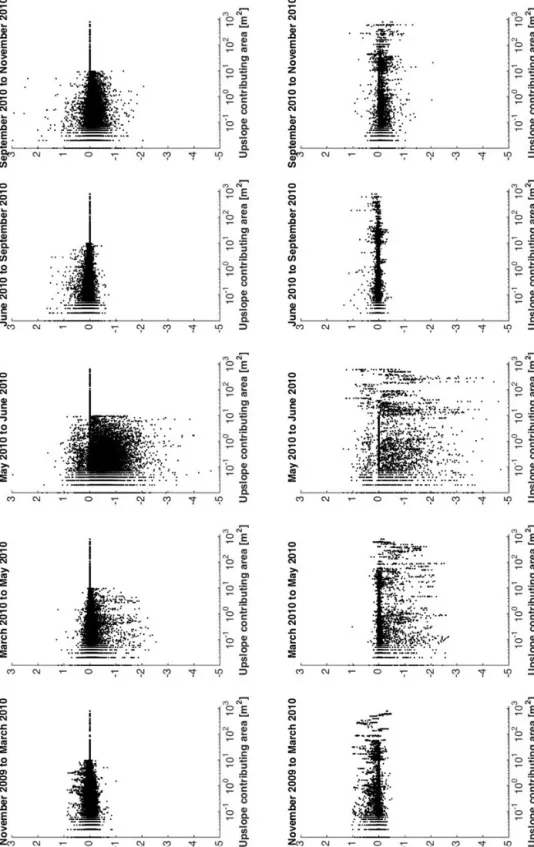
The upstream contributing area shows the same seasonal pattern, with deposition (gullies) and expansion (slopes) in winter and erosion in early summer. From June to September, DoD values are inversely proportional to UCA in slopes, with gullies showing smaller changes (Fig. 6).
TOBIA index values show that the Roubine gully is mainly composed of orthoclinal slopes (52 % of area) and steepened escarpments (39 % of area), consistent with its east–west in-cision into east-dipping marls, but no link can be seen be-tween erosion activity and structural outcropping conditions. The intersection between bedding and topography is very similar across the whole catchment.
4.4 Quantification of seasonal sediment budget changes
For the quantification of the seasonal sediment budget changes, the TLS data of the years 2007 and 2008 have been ignored because TLS data did not cover the largest possi-ble area of the catchment but others did. The eroded volume trend estimated with TLS (Table 2) is in agreement with the integrated measurement of coarse-sediment transfer at the outlet trap (Table 3; Fig. 7). The difference is in an acceptable range (5.5 % for the period from 14 April 2009 to 4 Novem-ber 2010 on the total cumulated volumes).
The maximum eroded volume is produced for the period March–June 2010 (Table 2) with a sediment transfer of ca. 8.7 m3(35 m3yr−1or 26 mm yr−1) out of the catchment. For the period November 2009–March 2010 (Table 2), more than 1.2 m3(3.1 m3yr−1or 2.3 mm yr−1) are transported but most of the volume is redistributed within the catchment because the rainfall was not intense enough to transport the sediment out of the catchment. The autumns 2009 and 2010 (Table 2) are characterized by moderate sediment transfers with re-spectively 0.9 m3 (4.1 m3yr−1 or 3.1 mm yr−1) and 1.6 m3 (13.7 m3yr−1or 10.3 mm yr−1) transported out of the catch-ment based on TLS observations, with some significant rain-fall events. It must be noted that the event of 21 October 2009 led to a deposit of 1.7 m3(more than 1 cm eroded over the whole catchment) in the sediment trap, with an intensity reaching 0.8 mm min−1and rain totalling 36 mm during the day. The three main events of 2010 are of a different kind. The first occurred during the first 14 days of May, reaching a total of precipitation of 155 mm. The main precipitation event occurred on 10 May, which reached 1 mm min−1 (dur-ing 4 min more than 0.5 mm min−1) after antecedent precip-itation since May 1 of 70 mm. A volume of nearly 3 m3was transferred out of the catchment during that period. The sec-ond occurred on 15 June 2010, with a daily rainfall of 69 mm
J. Bechet et al.: Detection of seasonal cycles of erosion processes 791
Figure 5.Vertical change over time vs. slope aspect. Rates are calculated from a 10 cm grid average of original DoDs and divided by the time separating the two lidar acquisitions. Slope aspect in degrees, calculated in ArcGIS on a 10 cm DEM of June 2010. Top graphs of the left column show rates for slopes and the right column for gullies and adjacent (20 cm or closer) pixels (see the Supplement for similar graphs showing vertical change in absolute value vs. slope aspect).
Figure 6.Vertical change over time vs. upslope contributing area. Rates are calculated from a 10 cm grid average of original DoDs and divided by the time separating the two lidar acquisitions. Upslope contributing area in square metres, calculated in ArcGIS on a 10 cm DEM of June 2010. Top graphs of the left column show rates for slopes and the right column for gullies and adjacent (20 cm or closer) pixels (see the Supplement for similar graphs showing vertical change in absolute value vs. contributing area).
J. Bechet et al.: Detection of seasonal cycles of erosion processes 793
Figure 7.Cumulated TLS-measured volumes (in bold black line) against cumulated calibration on sediment-trap-measured volumes (thin black line) for the years 2009 and 2010. In addition, the cumu-lative precipitation is shown as well as the daily precipitation events (in grey) and the main daily precipitation events that are considered as significant in red (> 20 mm day−1) and the largest-intensity event above 10 mm min−1sampled with a tipping-bucket rain gauge. The initial sediment delivery is not zero because we used the storage in the sediment trap of the previous period as the initial value.
and rainfall the day before being 5.5 mm, including an inten-sity maximum of 0.8 mm min−1. The maximum intensity on the 15th was 0.6 mm min−1 after 42 mm of antecedent pre-cipitation (from 14 June). It appears that this event was able to transport out of the catchment around 3 m3measured in the trap and estimated at 6 m3from TLS for the period 28 May– 23 July 2010. The last important event occurred on 4 Oc-tober 2010, with a small but intense 12 mm rain event. The intensity reached 1 mm min−1during 10 min. The measure-ments by TLS (1.6 m3) and within the sediment trap (1.7 m3) were very close.
5 Discussion 5.1 Interpretation
With the TLS measurements, the balance value is negative when the erosion sediment volume is larger than the de-posited sediment volumes. The presence of shadow areas in the TLS scans affects the TLS sediment budget as erosion-prone areas can be hidden from the laser pulse. When these erosion-prone areas are hidden, the deposited sediments can be considered to be more important than the erosion volumes. The balance is therefore positive, as for example for the pe-riod June–September 2010 (Table 2). The shadow areas are usually located in the upper parts of the slopes and are of-ten very steep and close to the crests of the catchment; these areas are highly productive sources of sediments. Therefore, it is hypothesized that the sediment budget is underestimated for most of the periods. The value of eroded volumes based on the sediment trap is increased by 20 % to include the sus-pended sediments; otherwise the true erosion rates are
un-derestimated. In addition, although the swelling or inflation of the regolith surface (Bechet et al., 2015) can have an in-fluence on the georeferencing, it was not possible to quan-tify it at the level of the Roubine catchment. Nevertheless, it has been shown that the unweathered black marl density is 2650 kg m−3, while the regolith density can be as small as 1300 kg m−3, but it varies greatly in space and time accord-ing to the presence of local discontinuities (Maquaire et al., 2003; Travelletti et al., 2012). The measurements of the den-sities of the black marl deposited in the sediment trap usually vary from 1500 to 1800 kg m−3(Mathys et al., 1996). By cal-ibrating the TLS with sediment trap volume, the swelling or inflation of the regolith has been indirectly quantified by the observed changes of eroded material density. The density of the regolith when it is mostly in a disturbed state possesses a density of 1500 kg m−3, which gives a ∼ 75 % volume in-crease compared to the bedrock density 2650 kg m−3. More-over, 2325 kg m−3corresponds to an expansion of 14 %. For the lowest measured value (1300 kg m−3), the increase is more than 100 %. In addition, the slope–erosion relationship shows some positive values in winter, indicating an increase in volume.
Also, topographic height differences smaller than the TLS threshold of 1.8 cm are not integrated into the sediment bud-get although they could contribute to an important sediment volume because of their possible widespread occurrence, mainly during the summer storms that trigger important Hor-tonian runoff. This limitation also influences the sediment budget by underestimating the total volume of erosion. But because of the coherence of the results, we consider that it can be a base for an interpretation of the catchment erosional system.
5.2 Conceptual model
All the results can be synthesized in a conceptual model de-scribing the seasonal pattern of erosion and deposition and quantifying the volumes of sediment transfer (Fig. 8). This seasonal pattern is controlled by the rainfall distribution and the availability of sediment during each period. The results may thus be different depending on the year, but the sequence will not change; only the time lapses between major erosive events will change.
During the spring and summer seasons, the sediment trans-fer consists of the erosion of the weathered loose regolith layer on the slopes and a mobilization of the transient stor-ages of accumulated sediments in the rills and gullies (right graphs in Figs. 4, 5, and 6) if no exceptional rainfall event occurs. But during the late spring and early summer, intense rainfall events produce very high erosive events (Figs. 4, 5, and 6 and the Supplement). Most of the sediments exiting the Roubine catchment are a product of the winter weathering. It appears to be a slow process, with rates of change smaller than in the other periods, but it is longer, and as a conse-quence the total changes are important but can be an
arte-Figure 8.Conceptual model describing the seasonal pattern of erosion and deposition and quantification of the volumes of sediment transfer at La Roubine catchment.
fact due to the time period between surveys (see and com-pare Figs. 4–6 and the Supplement). The erosion progres-sively evolves from a transport-limited (at the beginning of spring) to a supply-limited (in summer) pattern. However, diffuse erosion may happen during intense summer storms as heavy drops may detach and displace small particles, cre-ating sparse local erosion and deposition. Hortonian runoff may also be generated, but its effects could not be mea-sured with the TLS technique as a higher accuracy is nec-essary. In the autumn seasons, a new layer of loose regolith is progressively created (Fig. 4, left graphs), and if an intense rainfall event has occurred before in summer, as is usually the case, then the quantity of available sediment is limited (Figs. 4, 5, 6, right graphs).
The main events summarized above all occurred after more than 9 mm rainfall, which is also the limit for ini-tiating runoff in a larger similar catchment (Laval) after more than 5 antecedent dry days (Mathys et al., 2000). That threshold is lower if the dry period is smaller than 5 days. These events either possess an intensity that reaches 1 mm min−1(= 60 mm h−1), which is the limit to trigger MDFs (Yamakoshi et al., 2009), or have immediate an-tecedent rainfall that has saturated the soil. This last situation
permits the earlier initiation of runoff if it is coupled with significant precipitation, which permits an intense short ero-sive event with lower intensities such as 0.6 mm min−1to be induced. The sediment yield is controlled by the availability of the upper part of the regolith and by the grain size dis-tribution. Mathys (2006) indicated that in the area of Draix, the four first centimetres of the regolith contain 45 % clay and silts and the next four centimetres contain 35 % clays and silts. This shows that the size of material transported will change with time, i.e. the antecedent period in terms of rain-fall and climate. In addition, it has been shown that in the beginning of the year, the sediment moves but stays partially within the catchment, concentrating the material in the gul-lies. This non-linearity is supported by the fact that the quan-tity and type of material mobilized depends on the duration and intensity of the rainfall. Partitioning of the total load ex-ported from the catchment shows that at low discharge the suspended material part ranges between 0 and 40 %, whereas it is close to 40 % for higher discharge (Mathys, 2006). This indicates that only high-intensity precipitation can mobilize the whole upper part of the regolith and/or split marl plates into smaller particles, whereas small intensities depend on
J. Bechet et al.: Detection of seasonal cycles of erosion processes 795
the grain size of this upper part of the regolith at the time of the event.
It is also clear that sediment transfer depends on the mate-rial available (Bardou and Jaboyedoff, 2008). The winter pe-riod, because of frost–thaw cycles and low rainfall intensity, permits the creation and accumulation of weathered mate-rial. The relatively low rainfall intensities of these winter pe-riods permit the mobilization of partial material that remains within the slope and gullies. It is also interesting to note that the most active zones within the gullies, both regarding ero-sion and deposition, are located around a slope angle of 35◦, which corresponds to the angle of repose of dry granular ma-terial (Gotzinger et al., 2007). This indicates that sediment transfer from the slopes to the gullies is mostly controlled by local dry transport.
The difference between rills and inter-rill erosion depends on rainfall intensity and antecedent rainfall amounts. The ac-cumulated material in the rills can be mobilized by moderate rainfall intensities for fine material, while inter-rills need in-tense precipitation and/or a well-developed upper part of the regolith. In winter, the upper regolith probably only moves a short distance on a centimetre scale by small mass move-ments (Bechet et al., 2015) and on a metre scale by MDFs. In spring, the material accumulated in the rill is washed away, and later the inter-rills and rills with small contributing areas can be eroded and the material transported outside the catch-ment. Autumn permits the material accumulated in the main rills during summer to be cleaned. This scheme may change depending on the future climate if less precipitation occurs and only intense rainfall events remain. The system could then concentrate the full erosion in one or a few events. A warmer climate may also reduce the number of frost–thaw cycles and thus also reduce the depth of the regolith layer generated every year. But in any case, the seasonality that leads to weathered material will remain in the cold period, which is the main producer of sediments that can be mobi-lized.
5.3 Hillslope activity processes
The observed high production of loose regolith is mainly caused by the alternating of freezing–thawing and wetting– drying cycles, which is the key process controlling the weath-ering of black marl slopes (Maquaire et al., 2002; Brochot et Meunier, 1994). At the end of the winter season, a thick layer of loose regolith can be accumulated in the areas of the slopes and gullies with slope angles around 35◦. The south-facing slope is characterized by a higher number of weathering cycles than the north-facing slope (Maquaire et al., 2002), leading to the observed more active erosion– deposition processes. Because we consider only the freezing and thaw cycles, the south-facing slopes experience more cy-cles than the north-facing ones, but the gullies located in the south-facing slope are equivalent to those in the north-facing slope (Rovera and Robert, 2005). However, the north-facing
slopes present higher depths of frozen soils. In addition, it has been demonstrated that erosion rates increase with in-creasing slope angle on bare marls (Lopez-Saez et al., 2001). This is not clearly the case here; in fact the regions close to gullies are more subject to erosion because of previous ac-cumulation. In addition, the structures can play a role. The slopes cutting the bedding by an angle close to 90◦are more prone to erosion than dip slopes or those following the top of bedding (Esteves et al., 2005). This is mainly caused by the alternation of more competent and weaker bedding, the latter controlling the erosion of the competent beds. Dip slopes are less sensitive to weak layers except if they outcrop at the top. However, this behaviour cannot be confirmed in La Roubine, as not all outcropping types are present.
Another point is runoff seasonal changes. It is transport-limited in spring, which is probably mainly caused by the limited amount of intense rainfall during this season. Look-ing at the flow accumulation values, the gullies that have a contributive area smaller than 100 m2are not able to mobi-lize material if the daily rainfall or the intensity is not suffi-cient. To give an order of magnitude, if an intense event of a few minutes at 0.5 mm min−1occurs on saturated ground (on these 100 m2) and assuming 100 % runoff, the discharge will be 0.5 L min−1, which probably permits the erosion of the rills. In addition, the effect of runoff and rainfall intensity is not straightforward. The erosion rate depends first on the ma-terial available, second on the rainfall intensity, and third on the slope. The summer season does not include the two first conditions. But low-intensity rainfall participates in the cycle of erosion by allowing drying and wetting plus micro-slope movements, which weather the regolith more and transfer mass locally. As we observed, the slope surfaces evolve dy-namically throughout the yearly cycle. In the spring season, the regolith observed in the gullies has a popcorn structure defined as an “Expansion [. . . ] accompanied by the develop-ment of cracks separated by micro-humps” (Gutiérrez, 2005) and therefore a lower density compared to the unweathered black marls. In the summer season, sedimentary and struc-turally thin crusts can develop at the surface of the regolith because of the wetting (Malet et al., 2003). In the absence of shallow mass movements, the lower part of the slopes are, generally, eroded by runoff at the same rate as the in-terfluves and the upper part the slopes; this system yields to relatively constant slope gradient values over time (Descroix and Mathys, 2003).
6 Conclusion
By their strong and rapid responses to climate forcing, the black marls of Draix-Bléone are a good basis for the analysis of erosive processes. This article confirmed the results of pre-vious works, i.e. the strong dependence on the seasons and the cycle of processes (Jacome, 2009), the issues linked to the sediment trap measurements, and the estimation of
den-sity of the regolith (Mathys, 2006). The prediction of the re-sponses of small mountain watersheds to climatic events is improved.
TLS has proved to be an appropriate tool to monitor gully erosion while being easily reproducible and accu-rate all at once. It also allowed working on the centimetre scale with success. The method used to create and compare DEMs proved very effective to map and quantify topographic changes, but some difficulties have still to be solved to fully quantify the sediment transfer.
The TLS permits us mainly to locate the different pro-cesses. This first results show that the rainfall pattern, i.e. time series, intensity, and duration, controls the sediment de-livery sequence, but the process of weathering (mainly freez-ing and thawfreez-ing) is fundamental to providfreez-ing material for ei-ther suspended load or bedload. The interplay of rainfall and weathering creates the seasonal pattern. The complete ero-sion processes seem to apply during winter, and they are slow transport-limited processes by weathering (swelling). How-ever, they affect important volumes and later in summer the behaviour is sediment-limited, while from late spring to early summer the erosion is very intensely controlled by intense short erosive events induced by intense rainfalls. Further in-vestigation could also focus on the dry granular transport and its role in the accumulation of sediments during winter peri-ods.
Here we have shown the limits of the methods. Further in-vestigations with HRDEM must be carefully set up in order to avoid errors from data acquisition. In addition, this sur-face monitoring must be coupled with more variables moni-tored simultaneously during the event, such as soil moisture, swelling, rain drop size, grain size distribution, and soil den-sity. Furthermore, a density map of the regolith inside the catchment throughout the year (season by season) would be a great help to improve the TLS volume correction, but this will require physical intervention in the catchment to install sensors and collect samples.
Such procedures are not possible in the Roubine catch-ment, which must not be disturbed by human activity. A new small catchment (Roubinette) has thus been instrumented on the site of Draix, which will permit the installation of instru-ments inside the watershed itself. The next step will be to acquire TLS data during a storm event.
7 Data availability
The data may be accessible on direct request to the corre-sponding author because no structured repository exists at present.
The Supplement related to this article is available online at doi:10.5194/esurf-4-781-2016-supplement.
Acknowledgements. We would like to thank the IRSTEA who let us work on their field and who gave us valuable data. Thanks to the GIS Draix and particularly to S. Klotz (IRSTEA). We dedicate this paper to the first author, Jacques Bechet, who died in a snow avalanche on 28 March 2015. The content of this paper is an expression of his great ingenuity, curiosity and passion for research he shared with his co-worker Julien Duc. We will ever remember his enthusiasm.
Edited by: G. Sofia
Reviewed by: three anonymous referees
References
Abellán, A., Jaboyedoff, M., Oppikofer, T., and Vilaplana, J. M.: Detection of millimetric deformation using a terrestrial laser scanner: experiment and application to a rockfall event, Nat. Hazards Earth Syst. Sci., 9, 365–372, doi:10.5194/nhess-9-365-2009, 2009.
Antoine, P., Giraud, A., Meunier, M., and van Asch, T. W. J.: Ge-ological and geotechnical properties of the ‘Terres Noires’ in southeastern France: weathering, erosion, solid transport and in-stability, Eng. Geol., 40, 223–234, 1995.
Ballais J. L. : Apparition et évolution du modelé de roubines dans les Préalpes du Sud: l’exemple de Draix, in: Actes du col-loque “La montagne méditerranéenne” (Aix-en-Provence, 1998), edited by: Riser, J., Études de Géographie Physique, no. XXVIII, 105–108, 1999.
Bardou, E. and Jaboyedoff, M.: Debris Flows as a Factor of Hills-lope Evolution controlled by a Continuous or a Pulse Process?, in: Landscape Evolution: Denudation, Climate and Tectonics over Different Time and Space Scales, edited by: Gallagher, K., Jones, S. J., and Wainwright, J., Geol. Soc. London Spec. Publ., 63–78, 2008.
Bechet, J., Duc, J., Jaboyedoff, M., Loye, A., and Mathys, N.: Ero-sion processes in black marl soils at the millimetre scale: prelim-inary insights from an analogous model, Hydrol. Earth Syst. Sci., 19, 1849–1855, doi:10.5194/hess-19-1849-2015, 2015. Besl, P. J. and McKay, N. D: A method for registration of 3-d
shapes, IEEE T. Pattern Anal., 14, 239–256, 1992.
Betts, H. D. and DeRose, R. C.: Digital elevation models as a tool for monitoring and measuring gully erosion, Journal of Applied Earth Observation and Geoinformation, 1, 91–100, 1999. Brochot, S. and Meunier, M.: Erosion en badlands dans les Alpes
du sud: synthèse, in: Compte-rendu de recherches no. 3, BVRE de Draix, Cemagref Editions, 141–174, 1995.
Chen, Y. and Medioni, G.: Object modeling by registration of mul-tiple range images. Image Vis. Comput., 10, 145–155, 1992. DeRose, R. C., Gomez, B., Marden, M., and Trustrum, N. A.: Gully
erosion in Mangatu Forest, New Zealand, estimated from digital elevation Models, Earth Surf. Proc. Land., 23, 1045–1053, 1998. Descroix, L. and Gautier, E.: Water erosion in the southern French Alps: climatic and human mechanisms, Catena, 50, 53–85, 2002. Descroix, L. and Mathys, N.: Processes, spatio-temporal factors and measurements of current erosion in the French southern Alps: A review, Earth Surf. Proc. Land., 28, 993–1011, 2003.
Descroix, L. and Olivry, J. C.: Spatial and temporal factors of ero-sion by water of black marl in the badlands of the French South-ern Alps, Hydrolog. Sci. J., 47, 227–242, 2002.
J. Bechet et al.: Detection of seasonal cycles of erosion processes 797
Esteves, M., Descroix, L., Mathys, N., and Lapetite, J. M.: Soil hy-draulic properties in a marly gully catchment (Draix, France), Catena, 63, 282–298, 2005.
Grotzinger, J., Jordan, T. H., Press, F., and Siever, R.: Understanding Earth, 6th, Freeman and Company, New York, 579 pp., 2007. Gutiérrez, M.: Climatic Geomorphology, Elsevier, Amsterdam,
760 pp., 2005.
Innovmetric Software Inc.: Polyworks, version 9.1.8., available at: http://www.innovmetric.com (last access: 1 October 2016), 2010.
Jaboyedoff, M., Metzger, R., Oppikofer, T., Couture, R., Derron, M.-H., Locat, J., and Turmel, D.: New insight techniques to ana-lyze rock-slope relief using DEM and 3D-imaging cloud points: COLTOP-3D software, in: Rock mechanics: Meeting Society’s Challenges and demands (Vol. 1), edited by: Eberhardt, E., Stead, D., and Morrison, T., Taylor & Francis, 61–68, 2007.
Jaboyedoff, M., Oppikofer, T., Abellán, A., Derron, M.-H., Loye, A., Metzger, R., and Pedrazzini, A.: Use of LIDAR in landslide investigations: a review, Nat. Hazards, 61, 5–28, doi:10.1007/s11069-010-9634-2, 2012.
Jacome, A.: MNT à très haute résolution spatiale pour la représen-tation 3D des ravines d’érosion de montagne, Thèse de Doctorat, Université Montpellier II, Sciences et Techniques du Languedoc, 2009.
Kromer, R., Abellán, A., Hutchinson, J., Lato, M., Edwards, T., and Jaboyedoff, M.: A 4D filtering and calibration tech-nique for small-scale point cloud change detection with a Terrestrial Laser Scanner, Remote Sens., 7, 13029–13052, doi:10.3390/rs71013029, 2015.
Légier, A.: Mouvement de terrain et évolution récente du relief dans la région de Barcelonnette (Alpes-de-Haute-Provence), PhD the-sis, Grenoble I University, 163 pp., 1977.
Lopez Saez, J., Corona, C., Stoffel, M., Rovéra, G., Astrade, L., and Berger, F.: Mapping of erosion rates in marly badlands based on a coupling of anatomical changes in exposed roots with slope maps derived from LiDAR data, Earth Surf. Proc. Land., doi:10.1002/esp.2141, 2011.
Malet, J.-P., Auzet, A. V., Maquaire, O., Ambroise, B., Descroix, L., Esteves, M., Vandervaere, J.-P., and Truchet, E.: Soil surface characteristics influence on infiltration in black marls: applica-tion to the Super-Sauze earthflow (southern Alps, France), Earth Surf. Proc. Land., 28, 547–564, 2003.
Maquaire, O., Ritzenthaler, A., Fabre, D., Thiery, Y., Truchet, E., Malet, J.-P., and Monnet, J.: Caractérisation des profils de forma-tions superficielles par pénétrométrie dynamique à énergie vari-able: application aux marnes noires de Draix (Alpes-de-Haute-Provence, France), Comptes-Rendus Geosciences, 334, 835– 841, 2002.
Maquaire, O., Malet, J.-P., Remaître, A., Locat, J., Klotz, S., and Guillon, J.: Instability conditions of marly hillslopes: towards landsliding or gullying? The case of the Barcelonnette Basin, South East France, Eng. Geol., 70, 109–130, 2003.
Mathys, N.: Analyse et modélisation à différentes échelles de mécanismes d’érosion et de transport de matériaux solides. Cas des petits bassins versants de montagne sur marne (Draix, Alpes-de-Hautes Provence), PhD Thesis, Institut National Poly-technique de Grenoble, 2006.
Mathys, N., Brochot, S., and Meunier, M.: L’érosion des terres noires dans les Alpes du Sud: contribution à l’estimation des
valeurs annuelles moyennes (bassins versants expérimentaux de Draix, Alpes-de-Haute-Provence, France), CEMAGREF, Greno-ble, 1996.
Mathys, N., Brochot, S., and Lacheny, B.: Genèse des crues et éro-sion dans les petits bassins versant de montagne: observations et résultats obtenus sur les bassins versants expérimentaux de Draix (Alpes-de-Haute-Provence), Association Forêt Méditerranéenne, XXI, 182–190, 2000.
Mathys, N., Brochot, S., Meunier, M., and Richard, D.: Erosion quantification in the small marly experimental catchment of Draix (Alpes Alpes-de de-Haute Haute-Provence, France). Cal-ibration of the ETC rainfall-runoff-erosion model, Catena, 50, 527–548, 2003.
Mathys, N., Klotz, S., Esteves, M., Descroix, L., and Lapetite, J.-M.: Runoff and erosion in the Black Marls of the French Alps: observations and measurements at the plot scale, Catena, 63, 261–281, 2005.
Meentemeyer, R. K. and Moody, A.: Automated mapping of con-formity between topographic and geological surfaces, Comput-ers and Geoscience, 26, 815–829, 2000.
Meunier, M. and Mathys, N.: Panorama synthétiques des mesures d’érosion effectuées sur trois bassins du site expérimental de Draix (Alpes-de de-Haute Haute-Provence, France), CEMA-GREF, Grenoble, 1995.
Olivier, J. E.: Les fortes crues d’août 1997 à Draix: d’un printemps sec à des records de charges solides, Les bassins versants ex-périmentaux de Draix laboratoire d’étude de l’érosion en mon-tagne – actes du séminaire, Draix Le Brusquet Digne, 22–24 oc-tobre 1997, Cemagref Editions, Antony, 53–63, 1999.
Olivry, J.-C. and Hoorelbeck, J.: Erodibilité des terres noires de la vallée du Buëch (France, Alpes du Sud), Cahier ORSTOM Série Pédologie, 25, 95–110, ISSN: 0029-7259, 1989.
Oostwoud Wijdenes, D. J. and Erzinger, P.: Erosion and sedi-ment transport on steep marly hillslopes, Draix, Haute-Provence, France: an early experimental field study, Catena, 33, 179–200, 1998.
Perroy, R. L., Bookhagen, B., Asner, G. P., and Chadwick, O. A.: Comparison of gully erosion estimates using airborne and ground-based LiDAR on Santa Cruz Island, California, Geomor-phology, 118, 288–300, 2010.
Phan, T. S. H. and Antoine, A.: Mineralogical and geotechni-cal characterization of the “Black Lands” of the South-East of France, having in view road applications. Proceedings of the VI-Ith International Congress of the Intenational Association of Eng. Geol., Lisboa, vol. 2. Balkema, Rotterdam, 961–966, 1994. Puech, C., Thommeret, N., Kaiser, B., Bailly, J.-S., Jacome, A., Rey,
F., and Mathys N.: MNT à très haute résolution dans les modelés fortement disséqués : des données aux tests d’application, Géo-morphologie 2/2009, 2009.
Raclot, D., Puech, C., Mathys, N., Roux, B., Jacome, A., Asseline, J., and Bailly, J.-S.: Photographies aériennes prises par drone et modèle numérique de terrain : apports pour l’observatoire sur l’érosion, Géomorphologie, 2005, 7–20, 2005.
Richard, D.: les Les bassins versants experimentaux expérimentaux de Draix (04) : éetude de l’érosion et du transport solide torren-tielle à partir de mesures in situ, CEMAGREF, Grenoble, 218– 228, 1997.
Rovera, G. and Robert, Y.: Conditions climatiques hivernales et processus d’érosion périglaciaires dans les badlands marneux de Draix, GEographie Physique et Quaternaire, 59, 31–48, 2005. Schürch, P., Densmore, A. L., Rosser, N. J., Lim, M., and McArdell,
B. W.: Detection of surface change in complex topography using terrestrial laser scanning: application to the Illgraben debris-flow channel, Earth Surf. Proc. Land., 36, 1847–1859, 2011. Shan, J. and Toth, K.: Topographic laser ranging and scanning:
prin-ciples and processing, CRC Press, Taylor & Francis Group, LLC, UK, 2008.
Shepard, D.: A Two-Dimensional Interpolation Function for Irreg-ularly Spaced Data, Proceedings of 23rd ACM National Confer-ence, New York, 1968, 517–523, doi:10.1145/800186.810616, 1968.
Travelletti, J., Sailhac, P., Malet, J.-P., Grandjean, G., and Ponton, J.: Hydrological response of weathered clay-shale slopes: water in-filtration monitoring with time-lapse electrical resistivity tomog-raphy, Hydrol. Process., 26, 2106–2119, doi:10.1002/hyp.7983, 2012.
Yamakoshi, T., Mathys, N., and Klotz, S.: Time-lapse video obser-vation of erosion processes on the black marls badlands in the Southern Alps, France, Earth Surf. Proc. Land., 34, 314–318, 2009.
Yamakoshi, T., Mathys, N., and Klotz, S.: Visual observation of erosion processes on the Black Marl badlands in the southern Alps, France, in: Weathering as a Predisposing Factor to Slope Movements, edited by: Calcaterra, D. and Parise, M., Geological Society, London, Eng. Geol. Special Publications, 23, 201–212, 2010.