HAL Id: hal-00316252
https://hal.archives-ouvertes.fr/hal-00316252
Submitted on 1 Jan 1996
HAL is a multi-disciplinary open access
archive for the deposit and dissemination of sci-entific research documents, whether they are pub-lished or not. The documents may come from teaching and research institutions in France or abroad, or from public or private research centers.
L’archive ouverte pluridisciplinaire HAL, est destinée au dépôt et à la diffusion de documents scientifiques de niveau recherche, publiés ou non, émanant des établissements d’enseignement et de recherche français ou étrangers, des laboratoires publics ou privés.
A localised co-rotating auroral absorption event
observed near noon using imaging riometer and EISCAT
P. N. Collis, J. K. Hargreaves, G. P. White
To cite this version:
P. N. Collis, J. K. Hargreaves, G. P. White. A localised co-rotating auroral absorption event observed near noon using imaging riometer and EISCAT. Annales Geophysicae, European Geosciences Union, 1996, 14 (12), pp.1305-1316. �hal-00316252�
Correspondence to: P. N. Collis
Ann. Geophysicae 14, 1305—1316 (1996) ( EGS — Springer-Verlag 1996
A localised co-rotating auroral absorption event observed near noon
using imaging riometer and EISCAT
P. N. Collis1,2, J. K. Hargreaves1, G. P. White1
1 Engineering Dept., SECAMS, University of Lancaster, Bailrigg, Lancaster LA1 4YR, UK 2 On leave from EISCAT, Box 812, S-981 28 Kiruna, Sweden
Received: 8 March 1996/Revised: 30 May 1996/Accepted: 30 May 1996
Abstract. An isolated region of energetic electron precipi-tation observed near local noon in the auroral zone has been investigated using imaging riometer (IRIS) and inco-herent-scatter radar (EISCAT) techniques. IRIS revealed that the absorption event was essentially co-rotating with the Earth for about 2 h. The spatial and temporal vari-ations in D-region electron density seen by EISCAT were able to be interpreted within a proper context when com-pared with the IRIS data. EISCAT detected significant increases in electron density at altitudes as low as 65 km as the event drifted through the radar beam. The altitude distribution of incremental radio absorption revealed that more than half of the absorption occurred below 75 km, with a maximum of 67 km. The energy spectrum of the precipitating electrons was highly uniform throughout the event, and could be described analytically by the sum of three exponential distributions with characteristic ener-gies of 6, 70 and 250 keV. A profile of effective recombina-tion coefficient that resulted in self-consistent agreement between observed electron desities and those inferred from an inversion procedure has been deduced. The observa-tions suggest a co-rotating magnetospheric source region on closed dayside field lines. However, a mechanism is required that can sustain such hard precipitation for the relatively long duration of the event.
1 Introduction
Observations of the high-latitude D region using the EIS-CAT incoherent-scatter radar facility have been gathered for more than a decade now. Some of the earliest experi-ments pioneered the measurement of backscattered spectra from the mesosphere (Kofman et al., 1984). This
technique is now routinely applied, in a more refined form, in one of EISCAT’s common programmes, CP-6 (T. Turunen, 1986), with which a data base of synoptic obser-vations has been accumulated since 1990. All six of the present common programmes also provide a monitor of D-region electron density from power profile measure-ments. The sensitivity and height resolution of the applied pulse schemes vary from programme to programme, but are generally adequate for detailed D-region studies (Collis et al., 1986a). Special programmes devoting an even higher proportion of the radar duty cycle to probing the D region have also been developed and valuable data obtained (e.g. Ranta et al., 1985; Devlin et al., 1986).
Most of the early EISCAT D-region studies (as well as countless other auroral investigations) have included riometer observations as a qualitative indicator of geo-physical activity. Several of the EISCAT studies have compared the radio absorption observed by wide-beam riometers with that calculated from the radar measure-ments of D-region electron density. In many cases the observed and predicted values have been close (Ranta
et al., 1985; Hargreaves and Devlin, 1990). Some examples,
however, predict radio absorption from the EISCAT measurements to be greater than observed by riometer. This has lead to the assumption that the structure seen by the radar sometimes only fills part of the riometer antenna beam (Collis et al., 1986a; Burns et al., 1990). The radar beam is of the order of 1 km wide at D-region heights, whereas a standard riometer antenna subtends almost 100 km.
The radar allows narrow-beam observations with time resolutions of a few seconds and altitude resolutions of the order of 1 km. However, any interpretation of the measurements is subject to differentiating between tem-poral variations of a structure within the beam, and the movement of a feature through the beam — the classical spatial/temporal ambiguity of single-beam-radar experi-ments. A new instrument that provides information to help resolve this ambiguity, by mapping the extent of regions of energetic particle precipitation and their dy-namical development, has recently been installed in
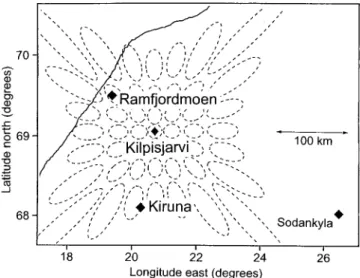
north-Fig. 1. Locations of the EISCAT sites and of the IRIS at Kilpisja¨rvi ( filled diamonds). The broken lines indicate the 3-dB projections of the individual IRIS beams at 90-km altitude. The heavy oblique line represents the Norwegian coastline
ern Scandinavia. This is a 49-beam imaging riometer (IRIS), located at Kilpisja¨rvi, Finland, some 83 km from the EISCAT transmitter site (Hargreaves et al., 1996). The IRIS beam pattern encompasses the EISCAT location, thereby offering the opportunity of direct comparisons between the two data sets.
We anticipate a range of studies using joint EISCAT and IRIS data (Collis and Hargreaves, 1996). These are likely to include significant contributions to (a) geophysi-cal investigations based on, for example, rocket, satellite or ground-based campaigns, where the radar data will be able to be set firmly within the context of the spatial distributions of energetic particle precipitation, (b) synop-tic studies relating radio absorption to D-region electron density, by virtue of the narrow IRIS beam widths, and (c) detailed case-studies based principally on EISCAT and IRIS data alone.
In the present paper we introduce the first of our case-studies. This was a relatively weak, featureless day-time absorption event as measured by broad-beam riometer, but which turned out to have many interesting characteristics when studied with IRIS and EISCAT data together.
2 The EISCAT radar system and the Kilpisja¨rvi IRIS General descriptions of the EISCAT facility have been given by Folkestad et al. (1983), Baron (1984) and Rish-beth and van Eyken (1993), to which we refer readers for technical information. The EISCAT transmitters are located at Ramfjordmoen, near Tromsø, Norway (69.59°N, 19.23°E) at an L value of 6.2. Receivers are sited at Ramfjordmoen itself, and for the UHF system also at Kiruna in Sweden (67.86°N, 20.43°E, L"5.4) and Sodan-kyla¨ in Finland (67.36°N, 26.63°E, L"5.05). Geomag-netic data from observatories close to the EISCAT sites have also been used in this work.
The Kilpisja¨rvi IRIS (an acronym for Imaging Riometer for Ionospheric Studies) measures the absorp-tion of cosmic radio noise at 38.2 MHz in 49 beam direc-tions. These form an approximately square 7]7 array of side &240 km, centred on Kilpisja¨rvi (Hargreaves et al., 1996). Details of the implementation of the method have been described by Detrick and Rosenberg (1990). The beam pattern is shown in relation to the locations of the EISCAT sites in Fig. 1. The central axes of the array are aligned along the geographic N-S and E-W directions. Individual beams are identified in this paper by a pair of numbers (r, c), where r is the row number relative to the central (zenith-pointing) beam, positive north, and c is the column number relative to the central beam, positive east. The central beam is thus (0, 0) and r and c fall in the range !3 to #3 for the 49-beam array. For example, the beam in the extreme south-west corner is (!3,!3) and the central one in the eastmost column is (0, 3). The geo-graphic co-ordinates of Kilpisja¨rvi are 69.05°N, 20.79°E at an L value of 5.9, though the meridional extent of the array’s field of view reaches about $0.4 L from Kilpis-ja¨rvi. Within this area, the data can be used to form images of the horizontal extent of radio absorption, and
hence of the regions of energetic particle precipitation. The basic time resolution of 1 s allows the dynamics of the absorption regions to be mapped in considerable detail if necessary, but in practice some time averaging is normally applied.
3 Observations
The event studied here occurred near local noon on 1 March 1995 (local time is one hour later than Univer-sal Time, UT, in Scandinavia; local magnetic noon is &0930 UT). The geomagnetic conditions were consider-ably disturbed on a global scale for the interval 09—12 UT (Kp"6!); the local K values were rather less than this, however, being 4 at both Kiruna and Sodankyla¨. Geomagnetic data from high-latitude stations in the mid-night sector were inspected for this interval (not shown here). These indicated typical auroral substorm activity, with deviations of the order of 500—600 nT in the horizon-tal component. The preceding 72 h were also disturbed throughout, before which there had been a sequence of very quiet days.
Measurements of radio absorption from both the broad-beam riometer at Kilpisja¨rvi and the (1, !2) IRIS beam (i.e. the one closest to the D-region intersection of the field-aligned EISCAT radar beam) for the whole of 1 March are displayed in Fig. 2. These show features that may be considered characteristic of the diurnal variation of auroral absorption on disturbed days: relatively slow varying events in the morning sector (though with addi-tional rapid variations on this day), an absence of activity in the afternoon sector, and more dynamic variations in the evening and midnight sectors. (Exceptions to this general pattern can always be found, of course.)
The EISCAT UHF radar was operating experiment CP-1 throughout 1 March. CP-1 makes continuous measurements along the geomagnetic-field direction from
Fig. 2a–f. Overview of geophysical activity on 1 March 1995. From top to bottom are displayed: a electron density at 68-km altitude measured by EISCAT, b radio absorption from IRIS beam (1,!2), c radio absorption from the broad-beam riometer at Kilpisja¨rvi, d geomagnetic H component from Tromsø, e northward compo-nent of ion drift velocity at 278-km altitude measured by EISCAT, f eastward component of ion drift velocity at 278-km altitude meas-ured by EISCAT
Tromsø. The interesting properties of CP-1 for this study are electron density measurements above 62-km altitude with 3-km resolution, and continuous electric-field esti-mates from tristatic data. The basic time resolution is 5 s,
though some averaging is normally performed, especially for the electric-field determinations. Standard ionospheric parameters are also available for the E region and lower F region from an alternating code pulse scheme, and for the F region from a long-pulse modulation. We examined the E-region and F-region scalar quantities from EISCAT to see whether any particular features were observed that would aid interpretation of the conditions surrounding the absorption event. However, none were found, and we will confine our interest in the EISCAT data to D-region electron densities and F-region vector ion velocities.
A survey plot of the electron density at an altitude of 68 km is included in Fig. 2. Electrons need to have energies of more than 150 keV to reach this altitude. The electron-density data in Fig. 2 indicate that there were several brief, hard intensifications in the morning sector, though these are not considered unusual. Most striking is the period between 1200 and 1230 UT, when the elec-tron densities at 68 km reached their highest values for this day. The riometer data show a smoothly varying absorption event with a maximum value of about 1.5 dB at this time. This is the event we shall investigate in detail here.
Also included in Fig. 2 are the horizontal ion drift velocity components measured by EISCAT. We will pres-ent the results from the period of the absorption evpres-ent itself in more detail later. However, we note in passing that there is no apparent correlation between ‘activity’ as mea-sured by radio absorption and ion drift velocity. In other words, the occurrence of energetic particle precipitation appears to have no relation to the convection electric-field intensity, at least on this day.
The IRIS data from all 49 beams are displayed for the noon-time event in Fig. 3. These values of radio absorp-tion constitute the raw informaabsorp-tion from which two-di-mensional absorption images can be constructed (see e.g. Figs. 6 and 7 later). Some preprocessing has already been performed to obtain the absorption values. The observed radio-noise power levels are referred to the estimated quiet-day values in order to calculate the absorption, and some time averaging of the basic 1-s data has been em-ployed. Figure 3 also serves to illustrate the overall quality of the data from IRIS. This is generally good, especially with longer integration times such as the 30 s used here. However, F-region irregularities occasionally cause scin-tillations when either of the radio sources Cygnus-A or Cassiopeia-A traverses one of the IRIS beams. Scintilla-tions, amounting to $0.3 dB at most, can be seen in the (!1,!2) and (!1, 0) beams in Fig. 3 (also apparent between 15 and 19 UT in Fig. 2b). These effects are pre-dictable and well known, and affected data can be rejected before further analysis.
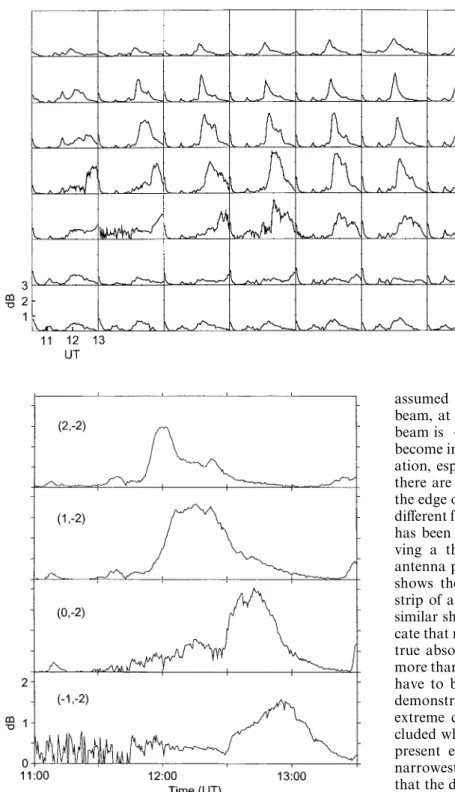
A more detailed view of the absorption event as seen by four of the IRIS beams at the EISCAT longitude is shown in Fig. 4. A clear north-to-south motion is apparent. Complete images of the event (Fig. 5a) show that it was spatially confined, particularly in the N-S direction with a half-width considerably less than 100 km. The images also reveal a gradual equatorward and westward motion relative to Kilpisja¨rvi. However, the time-span of the images covers more than 2 h, during which time the Earth
Fig. 3. Radio absorption observed by all 49 beams of the IRIS array on 1 March 1995. The sense of the panel layout is looking down on the ionosphere with N at the top and E to the right. The top left panel is thus the NW-corner beam of the array, i.e. beam (3,!3) in the notation used in the text. Each panel displays the absorption between 1030 and 1300 UT on the same scale as indicated for the (!3, !3) beam
Fig. 4. Radio absorption (30-s averages) measured by four of the IRIS beams at the longitude of EISCAT. The beams are, from top to bottom, (2,!2), (1,!2), (0,!2) and (!1, !2), see text for defini-tions. The separation between adjacent beams is about 30 km in the N-S direction at 90-km altitude. Noise in the initial part of the (!1,!2) panel, as well as the increased noise level in the (0,!2) panel relative to the two panels, is due to scintillation effects (see text)
c
Fig. 5. a Colour images of radio absorption observed by IRIS on 1 March 1995. Each image is a projection to 90-km altitude, looking down on the ionosphere, and approximately 240 km in N-S (vertical) and E-W (horizontal) dimension. The images are 2-min averages every 2 min, starting at 1120 UT at the top left, with time increasing from left to right and then down the page. b Contour plot of D-region and lower E-region electron density measured by the EISCAT UHF radar on 1 March 1995. Each profile is a 1-min average
rotated by 30° of longitude. Thus the absorption event was effectively co-rotating with the Earth.
In forming images of the horizontal distribution of radio absorption, the observations from the 49 beams are
assumed to be spot measurements at the centre of each beam, at a fixed height. The width of the zenithal (0, 0) beam is &20 km to the 3-dB points. The oblique beams become increasingly larger than this with decreasing elev-ation, especially in the radial direction (Fig. 1). Thus, if there are spatial gradients in absorption, for example at the edge of a feature, the response of IRIS may be slightly different from the real distribution of absorption. A model has been developed to investigate this effect, by convol-ving a theoretical distribution of absorption with the antenna patterns of the individual beams. The Appendix shows the results of modelling a latitudinally confined strip of absorption with a Gaussian cross-section, i.e. of similar shape to the present event. The calculations indi-cate that most of the beams will record at least 90% of the true absorption if the width of the absorption region is more than 25 km. For two further beams this width would have to be 50 and 70 km, respectively. The results also demonstrate quantitatively the poor performance of the extreme corner beams, which are anyway routinely ex-cluded when forming images from the data. Thus for the present event on 1 March, which was imaged by the narrowest IRIS beams near the zenith, the implication is that the derived spatial distribution of absorption should be accurate at the 90% level if the width was 25 km or more.
The location of the EISCAT beam at 90-km altitude is approximately midway between the centre and the top-left
Fig. 6a, b. Contour plots of radio absorption from IRIS. The loca-tion of the EISCAT beam at 90-km altitude is marked'. The area displayed is slightly larger than for the images in Fig. 4 due to the different interpolation algorithm. The axes show distances N and E of Kilpisja¨rvi, but need to be reduced by a factor of 0.78 for this event (see text). The results are 2-min averages starting at a 1204 UT and b 1240 UT
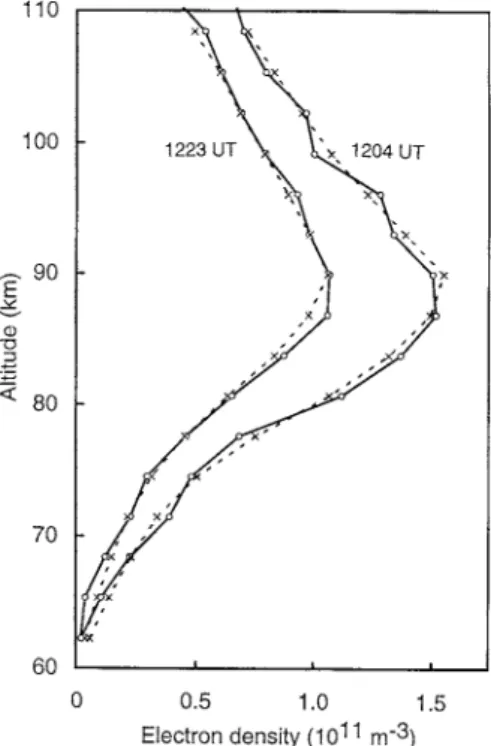
Fig. 7a–d. Individual electron density profiles (1-min averages) from EISCAT for a 1120 UT, b 1204 UT, c 1223 UT and d 1259 UT. Profiles a and d represent the undisturbed background ionosphere before and after the precipitation event, respectively, while b and c are during the event
(north-west) corner in the images in Fig. 5a (marked in Fig. 6). The radar thus captured a time-slice through the western edge of this feature, between 1200 and 1230 UT. Two contour plots of the absorption observed by IRIS are shown in Fig. 6, where the location of the EISCAT beam at 90-km altitude is also marked. The first of these, from 1204 UT, was when EISCAT recorded the largest D-re-gion electron densities during the event. The second, from 1240 UT, was when the feature had become weaker,
and was located equatorward of EISCAT and Kilpisja¨rvi. We will later show results from EISCAT that indicate that the majority of the absorption in this event occurred closer to 70-km altitude than the (commonly assumed) 90-km level. The distances in Figs. 5a and 6 should there-fore be scaled from the origin by a factor 7/9.
The electron densities measured by the radar during this event are displayed in Fig. 5b. We mentioned earlier, in connection with the electron density time-series in Fig. 2, that this event was significantly harder (in terms of precipitating electron energy spectra) than any other on this day. At the peak of the event, an electron density in excess of 1010 m~3 was registered to 65-km altitude. It is rare that radar experiments detect any signal at these heights during electron precipitation events. We attribute this ionisation to energetic electrons because no evidence of energetic protons was seen by particle detectors on GOES-7 at geostationary orbit (data made available by Space Environment Laboratory, NOAA, Boulder, USA). Sample profiles of electron density from before, during and after the event are shown in Fig. 7. The values before (1120 UT) and after (1259 UT) the event are essentially the same and represent the undisturbed ionosphere resulting from photoionisation. The profile at 1204 UT has the largest densities seen by the radar during this event, just after the structure entered the beam. The profile at 1223 UT is just before the structure left the beam. Note that these two profiles are very similar in shape, indicating that the energy spectrum of the precipitating electrons remained constant through the event, with just the num-ber fluxes changing.
Fig. 8. Electron density due to particle precipitation alone ( full lines with circles) for 1204 and 1223 UT. The method of removing the photoionised component is described in the text. Also included are the modelled profiles (broken lines with crosses)
The observed movement of the absorption feature will be investigated in the analysis section below, where the EISCAT F-region ion-velocity measurements will be in-troduced in more detail. First, we will begin by consider-ing the nature of the D-region disturbance itself.
4 Analysis
4.1 Electron densities and effective recombination coefficients
For the event in question, ionisation produced by precipi-tating electrons was evident only below about 115-km altitude (Fig. 7), indicating the virtual absence of particles with energies less than a few keV. We have investigated the ionospheric effects and the implied energy spectra of the precipitating electrons using the ZABMOD method of inverting the observed electron-density profile described by Hargreaves and Devlin (1990).
For daytime events, a necessary first step in the inver-sion process is to remove the photoionised component from the observed electron densities. As the production rates due to the photoionisation and particles are additive, we need to work with the squares of the electron densities, i.e. the electron densities due to particles alone at any height are given by (N2T!N2ph)0.5, where NT is the total electron density and Nph is the component due to photo-ionisation. For the present isolated event, this could be achieved by using one of the quiet profiles obtained when the event was not in the radar beam. This resulted in profiles of particle-produced densities at 1204 and
1223 UT as shown in Fig. 8. These values were then used as inputs to the inversion routine. The routine converges iteratively towards an electron flux-energy spectrum that produces an electron density profile matching the ob-served one to within a predefined tolerance (typically several per cent). Model values are required for several parameters used by the algorithm and the results depend upon the choice of these.
The most poorly known quantity used by ZABMOD is the profile of effective recombination coefficient (a%&&). This is a useful parameter for studies of ionisation balance in the lower ionosphere, but is only a quantitative indicator of the underlying ion chemistry. Consider the general charge continuity equation for a plasma:
dNe/dt"q!¸!¹, (1)
where dNe/dt is the time rate of change of electron density,
q is the ion pair production rate, ¸ is electron loss rate by
recombination and ¹ represents transport losses. For the D region, we neglect ¹ due to ion-neutral collisions. With the implicit assumption that the ionosphere consists of one positive and one negative ion species, or can be described by single ionisable species, Eq. 1 becomes (Banks and Kockarts, 1973):
dNe/dt"q/(1#j)!(a$#ja*)N2e!Nedj/(1#j)dt, (2)
where j is the number density ratio of negative ions to electrons,a$ is the ion-electron recombination coefficient and a* is the ion-ion recombination coefficient. For dy-namic conditions the dNe/dt term needs to be retained, but for steady-state conditions, such as the event in ques-tion, dNe/dt"0 and we obtain:
q"(1#j) (a$#ja*)N2e"a%&&N2e. (3) This shows the relation of a%&& to the bulk ionospheric parameters. In the limiting case of negligible negative ion densities (which is probably never attained in reality in the lower D region),a%&& is just a$. More rigorous treatment, involving detailed ion-chemical models (Burns et al., 1991; E. Turunen, 1993, 1996), is outside the scope of the present study. However, the experimental approach used here allows limits to be set on a%&& that could be used as boundary conditions in model studies.
The effective recombination coefficient at a given height is quite variable, but a standard approach is to use an average model representative of the prevailing condi-tions. Gledhill (1986) deduced analyticala%&& profiles from a consideration of available values reported in the litera-ture, classified according to the type of geophysical event and separated by day and night. Unfortunately, for the present purposes, there were not enough results for day-time auroral events (i.e. of the type in this case-study) to allow the derivation of a representative profile. The cat-egory of conditions resembling most closely those of the present event, for which Gledhill (1986) presented an ana-lytical profile, is the collection for daytime polar-cap absorption, sudden phase anomalies, solar proton events and solar flares. For these he deduced a%&&" 0.501 exp(!0.165 h), where h is the altitude in km, ap-plying over the altitude range 50—90 km (Fig. 9). The number of values at higher altitudes did not allow
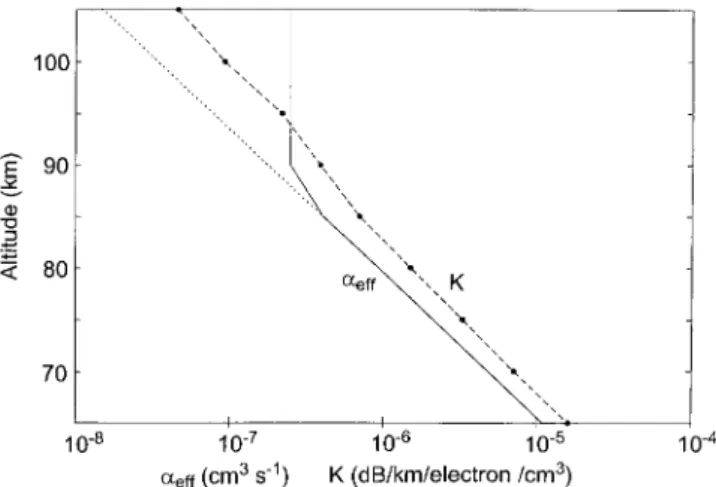
Fig. 9. Profiles of effective recombination coefficient,a%&&, ( full line) and specific absorption, K, (broken line with filled circles) used in this study. The dotted line is the extension of the Gledhill (1986) a%&& profile to higher altitudes mentioned in the text
a significant fit to the data. Moreover, the spread of reported results was large (at least two to three orders of magnitude) at any height over the valid altitude range.
The inversion algorithm presently accommodates the altitude range 65—110 km. We initially applied the above analytical expression fora%&& over this whole height-range. The observed steep decrease in electron density above 90 km (Fig. 8) could not be reproduced, indicating that the extrapolateda%&& coefficients there were too small. In a sec-ond attempt the analytical values were used only for the valid range, 65—90 km, and the value at 90 km was as-sumed to apply at higher altitudes also. The resultant ‘‘modelled’’ electron density profile (i.e. the values pre-dicted from the electron flux-energy spectrum resulting from the inversion of the observed electron density profile) matched the observations well at all heights, except near the peak at 85—95-km altitude (where they were too large). The a%&& profile was then adjusted to use the analytical curve only up to 85 km, and to be constant above that height. An inversion using that profile produced densities at the peak that were smaller than the observed ones. This suggests that the most realistica%&& profile should follow the analytical curve up to some height between 85 and 90 km, and to be constant at higher altitudes. Figure 9 displays thea%&& profile that we finally arrived at (i.e. that which produced a good fit to the observed densities at all heights). The resultant electron density profiles are shown, together with the observed values, in Fig. 8.
The empirical profile of effective recombination coeffi-cient resulting from our analysis is strictly valid only for the conditions of the event in question. This quantity is expected to depend on a number of factors affecting the ion chemistry, for example the neutral atmosphere density and temperature, the solar zenith angle, and perhaps the ion production rate (suggesting thata%&& may even vary during a single event). The ionosphere was sunlit for the present event, implying rather small number densities of negative ions (they are easily photodissociated) and a%&& should approximate a$ as mentioned earlier. At night however, more negative ions are expected, thereby
increasing a%&&. Similar studies of further events will be useful for the investigation of possible variations of a%&& and the implications for ion chemistry.
The close agreement of the observed and modelled electron densities indicates that ZABMOD is at least self-consistent. However, it should be remembered that some of the atmospheric model parameters could produce effects that tend to cancel each other in the inversion procedure, e.g. too-high neutral densities will increase the electron density, while too-higha%&& will decrease it. Thus the results cannot be said to validate the model assump-tions, but they are not inconsistent with the models being a good representation of the true conditions.
4.2 Flux-energy spectra of precipitating electrons
The electron density profiles during the passage of this event through the radar beam did not change much in overall shape (though the absolute values did change with time). As the characteristics of the absorption structure observed by IRIS were rather uniform both before and after it passed through the radar beam, it seems reason-able to speculate that the density profiles were relatively uniform in shape for a considerable time. The implication that the energy spectral distribution of the precipitating electrons was rather constant is borne out by the results of the inversion procedure (Fig. 10) for the two electron density profiles considered earlier.
The spectra in Fig. 10 have been fitted with the sum of three exponential distributions:
dJ/dE"C[2 · 105 exp(!E/6)#105 exp(!E/70)
#2.5 · 103 exp(!E/250)],
where E is the energy in keV and C is a constant (equal to unity for the 1223-UT spectrum and 1.9 for 1204 UT). This distribution, indicated by the broken lines in Fig. 10, is an almost exact fit for 1223 UT, but the 1204-UT spectrum shows slightly more irregular variation with energy. The characteristic energies (E0) of 6, 70 and 250 keV can be contrasted with the results of a similar inversion procedure on morning-sector absorption events by Hargreaves and Devlin (1990). In that study, a max-imum value of 22 keV was reported for E0, though typical values were significantly smaller than this. Collis et al. (1986b) presented a synthesis of trapped electron spectra at synchronous orbit from five morning-sector events. Those results were well described by an exponential distri-bution with E0&30—35 keV, but also equally well by a power law varying as E~3.7 for energies '60 keV. Satellite data were also presented for another morning-sector event by Collis and Korth (1985). A basic power-law distribution (E~2.74) was again found for the trapped electrons, but with a superposed drifting component at the time of the absorption event itself.
The distributions for the present event follow neither a single exponential nor a power law; they are much harder than for other reported morning-sector events such as those mentioned above. This latter observation is consistent with the findings of Collis et al. (1984), who
Fig. 10. Electron energy spectra inferred from EISCAT D-region electron density profiles. The full lines with circles represent the results from the two profiles shown in Fig. 8. Analytical fits corres-ponding to the three-component exponential distribution men-tioned in the text are shown by broken lines with crosses
Fig. 11. Profile of incremental absorption for 1204 UT
Fig. 12. Radio absorption calculated from EISCAT electron densit-ies (centre panel) and that observed by IRIS beam (2,!2) (top panel) and beam (1,!2) (lower panel). The centres of the two IRIS beams are separated by 30 km in the N-S direction at 90-km altitude and the radar beam was approximately midway between them.
predicted that spectra during noon-time absorption events would indeed be harder than for the morning sector.
4.3 Radio absorption
The total radio absorption expected from a measured electron density profile can be obtained by calculating incremental products of electron density with a profile of specific absorption. This results in a profile of incremental absorption, which provides the total absorption when integrated over height. Figure 9 shows the specific absorp-tion profile used for the 1 March calculaabsorp-tions. For the 1204-UT electron density profile we obtained a total ab-sorption of 2.5 dB. This is to be compared with the max-imum value of &1.8 dB observed in the (1,!2) IRIS beam close to EISCAT.
The profile of incremental absorption for the peak of the event is shown in Fig. 11. This is weighted very much to the lower altitudes, with a maximum at 67 km and 50% of the total absorption occurring below 73 km. In con-trast, morning-sector events typically have maxima in the 80—90-km-altitude region (Hargreaves and Devlin, 1990). A comparision of the radio absorption predicted from the EISCAT electron density measurements with that observed in two nearby IRIS beams is shown in Fig. 12. The longitude of the field-aligned EISCAT D-region measurements coincides with column !2 of the IRIS array. In latitude, however, the radar beam falls about midway between IRIS beams (2,!2) and (1,!2). Figure 12 shows the results for these two beams on either side of the EISCAT values. The equatorward motion is again clear (cf. Fig. 4), but the absorption calculated from the EISCAT densities shows more temporal variation than the IRIS results. Thus, although the main absorption feature was spatially confined, particularly in latitude, the
EISCAT measurements suggest the additional presence of variations with a scale size significantly smaller than an IRIS beam (&20 km). Such variations would be smoothed out by the spatial integration of the IRIS measurements. The geometry of this experiment was not well suited for a detailed comparison of calculated and observed absorp-tion because the radar beam was not co-located with any particular IRIS beam. Future studies of the spatial sizes of
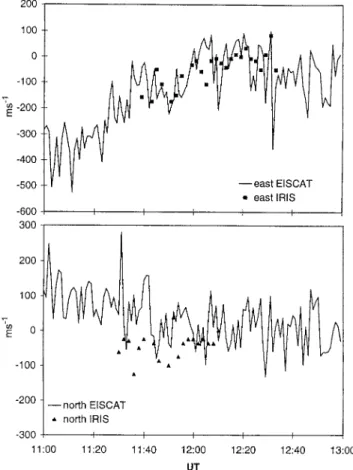
Fig. 13. Zonal and meridional components of F-region ion drifts from EISCAT ( full lines) and drifts of the absorption event from IRIS (symbols)
precipitation regions using EISCAT and IRIS should ob-viously use co-located observations.
4.4 Motion and co-rotation of the absorption event
Although the absorption region drifted slowly equator-wards and westequator-wards with respect to Kilpisja¨rvi, the fact that it underwent relatively little displacement while re-maining within the IRIS field of view for more than 2 h indicates that it was actually co-rotating with the Earth. We consider first the motion with respect to the Earth and compare this with the information on elec-trodynamics available from the radar, i.e. F-region ion vector velocities (equivalent to ionospheric electric field). Figure 2 demonstrated that absorption events on 1 March tended to occur during periods of weak ionospheric con-vection. The noon-time event was no exception, with absorption being detected by IRIS as the F-region ion velocities fell from a few hundred m s~1 to approximately zero (electric fields from &20 mV m~1 down to zero).
Figure 13 displays the meridional and zonal compo-nents of motion of the absorption event, determined from the location of the absorption peak every 2 min, and F-region ion drifts estimated from 1-min averages. The point-to-point variations in the EISCAT results are prob-ably due to statistical noise, though the long-term trends are clear. The F-region drifts had significant west and north components some 30 min before the absorption event appeared, but declined to approximately zero over the subsequent hour. The westward movement of the absorption structure closely matched the westward con-vection velocity. The meridional components did not agree, however, and even showed a tendency to be oppo-site in direction (though the speeds were relatively small, &100 m s~1 or less).
The similar trends of the EISCAT F-region drifts and the motion of the precipitation region (with a change of sign for the meridional component) have no obvious causal relation. We are certainly not suggesting that the D-region density enhancement was being driven at iono-spheric heights by the convection electric field. Neither can the movement be explained by gradient-curvature drift of a trapped electron population in the magneto-sphere. Such motion would be eastward, energy depen-dent and extremely rapid for the energies present in this event; the observations are the antithesis of such a mecha-nism.
That the major component of motion of the absorption event was co-rotation, over a period of 2 h or so, is remarkable. Observations with the IRIS at South Pole station (L"13.2) revealed a somewhat similar character-stic for morning-sector events (Hargreaves et al., 1994). Several cases were found in which the peaks of several consecutive events, over periods of 4—5 h, appeared at a favoured longitude that drifted slowly and systemati-cally with time. It was tentatively suggested that co-rotat-ing cold plasma enhancements near the magnetopause, with precipitation generated by wave-particle interac-tions, could account for the observations. Whether this explanation could also be applied to the present (single,
long-lasting) event, with a rather constant, particularly hard, electron energy distribution, remains speculative.
The source of the energetic electrons must be scattering into the loss cone on closed field lines well above the ionosphere. Assuming that the source region is far out in the magnetosphere, and possibly near the equatorial plane, it is probably quite close to the dayside mag-netopause. The noon-time period implies that the local field line would be at or near its closest approach to the subsolar point, especially as we expect a compressed day-side magnetopause in view of the prevailing disturbed conditions. On the other hand, the event may be related in some way with the substorm activity on the rightside of the Earth mentioned earlier. It is not our aim to examine the detailed magnetospheric implications of this event. Spacecraft observations, including modelling the config-uration of the magnetosphere (Tsyganenko, 1995), would provide important information for future investigations of similar events.
5 Conclusions
1. A long-lived ('2 h), localised (few tens of km in lati-tudinal extent but more extended in longitude) radio ab-sorption feature has been observed near local noon (post magnetic noon) by the 49-beam imaging riometer at
Fig. 14a–c. Ratio of apparent-to-true zenithal absorption for an E-W absorption strip observed with selected beams of a 49-beam IRIS. The strip is of Gaussian form in the N-S direction and its maximum absorption is 3 dB in each case. (the results would be slightly different for other maximum values); the 90% level is in-dicated. a Beams to the east; b beams to the north; c beams to the north-east
Kilpsja¨rvi. Simultaneously, the EISCAT UHF radar monitored the time and height variation of D-region elec-tron density as the absorption event passed through the radar beam. These two techniques revealed two major characteristics of the event; that it was co-rotating with the Earth (from IRIS) and that the precipitating electrons were unusually hard (from EISCAT).
2. The inferred spectra of the precipitating electrons could be approximated by the sum of three exponential distributions, the high-energy tail of which had a charac-teristic energy of 250 keV. The shape of the electron den-sity profiles (and hence of the electron energy spectra) was rather uniform with time, though small-scale variations in number fluxes were apparent. This would suggest a rather invariant source mechanism for the precipitation of the electrons from the magnetosphere.
3. Furthermore, as the precipitation region was co-rotating, the source region must have been almost station-ary with respect to the closed field lines above Kilpisja¨rvi. These characteristics are consistent with the presence of a cold plasma region that precipitates trapped electrons as they drift into it. As the source was relatively long lived and probably quite close to the dayside magnetopause, spacecraft observations would be a valuable input to similar studies in future.
4. The radar detected rather more temporal variabil-ity, in terms of radio absorption predicted from the ob-served electron densities, than was evident in the IRIS measurements (Fig. 12). This implies that features nar-rower than the individual IRIS beams (&20 km) may have been present.
5. A profile of effective recombination coefficent (a%&&) was determined that predicted, self-consistently, the ob-served D-region electron densities using an inversion pro-cedure. Thisa%&& profile followed a Gledhill (1986) daytime curve below 85 km but with constant values above 90 km. The height of maximum radio absorption (67 km) was much lower than is normally found, and 50% of the total radio absorption occurred below 73-km altitude. The large electron-neutral collision frequencies (i.e. specific absorption) at these low altitudes make the results parti-cularly sensitive to the accuracy of the electron density measurements and to the atmospheric models employed in the calculations.
Appendix. Response of a 49-beam IRIS to a spatially limited absorption structure
When using multiple beams that emanate from a single site, the shape and size of each beam as it intersects the ionosphere will depend on the zenith angle of the beam. Because of this variation in beam shape and size, it is important to estimate how each beam would respond to an absorption event of a particular spatial extent. It would be expected that if an absorption structure was spatially large enough to fill a particular beam, then the absorption measured by the IRIS system would be close to the peak value of the event. However, if the structure was more localised, the beam would not record the full intensity of the change in signal power. As a result, the IRIS response to the event would be less than the true peak absorption value. In order to quantify this effect, the responses of the IRIS beams were modelled mathematically using Gaussian strip absorption structures of varying widths.
The following calculations were performed for each of the 49 beams:
f First, the power response of a beam in a particular direction (defined by the spherical co-ordinates / and h) was calculated from the polar response diagram for the IRIS system.
f A Gaussian strip absorption structure was simulated using the equation
A"A0 exp(!(y!y0)2/2p2), (A1) where A0 is the peak absorption value (dB), y0 is the distance (km) of the peak of the absorption strip from the centre of the IRIS array, y is the distance (km) from y0 and p is the half-width of the event (km) at A0e~0.5 (+61%).
f The strip was oriented east-west at 90-km altitude and y0 waschosen so that the absorption strip was centred on the estimated point of maximum response of the beam. A peak absorption value of 3 dB was used in the modelling as this represents an event of moderate intensity.
f Using the above model, the IRIS power response after absorption was calculated for the beam in the direction (/, h).
f Power responses before absorption (P) and after absorption (Pa)were then integrated for/"0—2n and h"0—n/2, to give the total power responses over the whole sky.
f The apparent absorption as measured by IRIS is then given by: A!11(dB)"10 ·log10(P/Pa). (A2) f The absorption was corrected to an apparent zenithal value using
the zenith angle of the beam.
The beams are symmetrical about the central N-S and E-W axes of the IRIS array. The results have therefore been plotted only for the beams is one quadrant of the array. Figure 14 shows the apparent zenithal absorption as a function of p for selected beams, illustrating the degree to which IRIS may distort the magnitude (and hence the shape) of absorption events of varying spatial sizes. Figure 14a shows that the response of beams (0, 0), (0, 1) and (0, 2) is acceptable (to 90% of A0) until the width of the structure drops below aboutp"20 km. For beam (0, 3) the limit is aboutp"25 km. Figure 14b shows that as the beams elongate in the N—S direction, they respond less to the absorption structure, which is oriented E-W. Hence, the responses of beams (2, 0) and (3, 0) fall to 90% of A0 at around 40 km and 70 km, respectively. The effect is even more marked in Fig. 14c as the beams elon-gate in the SE-NW direction. The response of the corner beam (3, 3) is seriously depressed unless the absorption is virtually uniform.
In summary, the response of most beams is depressed by no more than about 10% for Gaussian strips havingp525 km (equivalent to about 60-km full width at half the maximum absorption). Results indicating absorption features smaller than these should be treated with caution. The response of the corner beams ($3,$3) is likely to be significantly depressed in most auroral absorption events. Acknowledgements. The imaging riometer facility at Kilpisja¨rvi is funded by the United Kingdom Particle Physics and Astronomy Research Council (PPARC). Sodankyla¨ Geophysical Observatory, Finland (H. Ranta and A. Ranta) provides operational support for IRIS, and K. Ranta oversees the day-to-day running of the instru-ment. W. G. Howarth (University of Lancaster) assisted with data analysis. The code specifying the beam patterns was kindly made available by D. L. Detrick of the University of Maryland. EISCAT is supported by SA (Finland), CNRS (France), MPG (Germany), NFR (Norway), NFR (Sweden) and PPARC (UK).
Topical Editor D. Alcayde´ thanks P. Stauning and T. J. Rosen-berg for their help in evaluating this paper.
References
Banks, P. M., and G. Kockarts, Aeronomy, Academic Press, New York, 1973.
Baron, M., The EISCAT facility, J. Atmos. ¹err. Phys., 46, 469—472, 1984.
Burns, C. J., W. G. Howarth, and J. K. Hargreaves, High-resolution incoherent scatter radar measurements during electron precipita-tion events, J. Atmos. ¹err. Phys., 52, 205—218, 1990.
Burns, C. J., E. Turunen, H. Matveinen, H. Ranta, and J. K. Hargreaves, Chemical modelling of the quiet summer D- and E-regions using EISCAT electron density profiles, J. Atmos. ¹err. Phys., 53, 115—134, 1991.
Collis, P. N., and J. K. Hargreaves, Co-ordinated studies using imaging riometer and incoherent scatter radar, J. Atmos. ¹err. Phys., in press, 1996.
Collis, P. N., and A. Korth, GEOS-2 observations of energetic electrons in the morning sector during auroral radio absorption events, J. Atmos. ¹err. Phys., 47, 327—339, 1985.
Collis, P. N., J. K. Hargreaves, and A. Korth, Auroral radio absorp-tion as an indicator of magnetospheric electrons and of condi-tions in the disturbed auroral D-region, J. Atmos. ¹err. Phys., 46, 21—38, 1984.
Collis, P. N., S. C. Kirkwood, and C. M. Hall, D-region signatures of substorm growth phase and onset observed by EISCAT, J. Atmos. ¹err. Phys., 48, 807—816, 1986a.
Collis, P. N., J. K. Hargreaves, A. Brekke, and A. Korth, Experi-mental determination of effective recombination rates in the disturbed high-latitude lower ionosphere, Ann. Geophysicae, 4, A, 3, 211—218, 1986b.
Detrick, D. L., and T. J. Rosenberg, A phased array radiowave imager for studies of cosmic noise absorption, Radio Sci., 25, 325—338, 1990.
Devlin, T., J. K. Hargreaves, and P. N. Collis, EISCAT observations of the ionospheric D-region during auroral absorption events, J. Atmos. ¹err. Phys., 48, 795—805, 1986.
Folkestad, K., T. Hagfors, and S. Westerlund, EISCAT: an updated description of technical characteristics and operational capabili-ties, Radio Sci. 18, 867—879, 1983.
Gledhill, J. A., The effective recombination coefficient of electrons in the ionosphere between 50 and 150 km, Radio Sci., 21, 399—408, 1986.
Hargreaves, J. K., and T. Devlin, Morning sector electron precipita-tion events observed by incoherent scatter radar, J. Atmos. ¹err. Phys., 52, 193—203, 1990.
Hargreaves, J. K., T. J. Rosenberg, and D. L. Detrick, Dynamics of auroral precipitation in the morning sector observed with the imaging riometer at South Pole station: evidence of co-rotating precipitation regions, J. Atmos. ¹err. Phys., 56, 783—793, 1994.
Hargreaves, J. K., S. Browne, H. Ranta, A. Ranta, T. J. Rosenberg, and D. L. Detrick, A study of substorm-associated nightside spike events in auroral absorption using imaging riometers at South Pole and Kilpisja¨rvi, J. Atmos. ¹err. Phys., 58, in press, 1996.
Kofman, W., F. Bertin, J. Ro¨ttger, A. Cremieux, and P. J. S. Williams, The EISCAT mesospheric measurements during the CAMP campaign, J. Atmos. ¹err. Phys., 46, 565—575, 1984. Ranta, A., H. Ranta, T. Turunen, J. Sile´n, and P. Stauning,
High-resolution observations of D-region by EISCAT and their com-parison with riometer measurements, Planet. Space Sci., 33, 583—589, 1985.
Rishbeth, H., and A. P. van Eyken, EISCAT: early history and the first ten years of operation, J. Atmos. ¹err. Phys., 55, 525—542, 1993.
Tsyganenko, N. A., Modeling the Earth’s magnetospheric magnetic field confined within a realistic magnetopause, J. Geophys. Res., 100, 5599—5612, 1995.
Turunen, E., EISCAT incoherent scatter radar observations and model studies of day-to-twilight variations in the D-region dur-ing the PCA event of August, 1989, J. Atmos. ¹err. Phys., 55, 767—781, 1993.
Turunen, E., Incoherent scatter radar contributions to high-latitude D-region aeronomy, J. Atmos. ¹err. Phys., 58, 707—725, 1996. Turunen, T., GEN-SYSTEM — a new experimental philosophy for
EISCAT radars, J. Atmos. ¹err. Phys., 48, 777, 1986.