HAL Id: hal-00106998
https://hal.archives-ouvertes.fr/hal-00106998
Submitted on 17 Oct 2006HAL is a multi-disciplinary open access archive for the deposit and dissemination of sci-entific research documents, whether they are pub-lished or not. The documents may come from teaching and research institutions in France or abroad, or from public or private research centers.
L’archive ouverte pluridisciplinaire HAL, est destinée au dépôt et à la diffusion de documents scientifiques de niveau recherche, publiés ou non, émanant des établissements d’enseignement et de recherche français ou étrangers, des laboratoires publics ou privés.
Influence of pH on the interlayer cationic composition
and hydration state of Ca-montmorillonite: analytical
chemistry, chemical modelling and XRD profile
modelling study.
Eric Ferrage, Christophe Tournassat, Emmanuel Rinnert, Bruno Lanson
To cite this version:
Eric Ferrage, Christophe Tournassat, Emmanuel Rinnert, Bruno Lanson. Influence of pH on the inter-layer cationic composition and hydration state of Ca-montmorillonite: analytical chemistry, chemical modelling and XRD profile modelling study.. Geochimica et Cosmochimica Acta, Elsevier, 2005, 69, pp.2797-2812. �10.1016/j.gca.2004.12.008�. �hal-00106998�
Influence of pH on the interlayer cationic composition and hydration state
of Ca-montmorillonite: analytical chemistry, chemical modelling and XRD
profile modelling study
Revised Version n°2
ERIC FERRAGE,1,2,* CHRISTOPHE TOURNASSAT,2,3 EMMANUEL RINNERT2,4 and BRUNO LANSON1
1 Environmental Geochemistry Group, LGIT, University of Grenoble-I P.O. Box 53, 38041 Grenoble, France.
2 ANDRA, Parc de la Croix Blanche, 1/7 rue Jean Monnet, 92298 Châtenay-Malabry Cedex, France
3 BRGM, 3 avenue Claude Guillemin, 45060 Orléans Cedex 2, France
4 Laboratoire de Chimie Physique et Microbiologie pour l’Environnement,UMR 7564 CNRS-Université Henri Poincaré, 405 rue de Vandoeuvre,54600 Villers-Lès-Nancy, France
* Corresponding author: Eric Ferrage Fax: +33 (0)4 7682 8101; Tel: +33 (0)4 7682 8018;
E-mail: [email protected];
Keywords : smectite, hydration state, XRD modelling, pH, chemical modelling, interlayer protons
ABSTRACT
The hydration state of a <2 µm fraction of Ca-saturated SWy-2 montmorillonite was characterised after rapid equilibration (3 hours) under pH-controlled conditions (0.1-12.6 pH range). The solution composition was monitored together with the interlayer composition and X-ray diffraction (XRD) patterns were recorded on oriented preparations. Experimental XRD patterns were then fitted using a trial-and-error procedure to quantify the relative proportions of layers with different hydration states.
The montmorillonite is mostly bi-hydrated in basic and near-neutral conditions whereas it is mostly mono-hydrated at low pH. The transition from the bi-hydrated to the mono-hydrated state occurs through very heterogeneous structures. However, the proportion of the different layer types determined from XRD profile modelling and that derived from chemical modelling using Phreeqc2 code strictly coincide. This correlation shows that the hydration modification is induced by a H3O+-for-Ca2+ exchange at low pH, the two species being distributed in different interlayers. This layer-by-layer exchange process occurs randomly in the layer stack.
Under alkaline conditions, results from XRD profile modelling and from near infrared diffuse reflectance spectroscopy (NIR-DRS) clearly demonstrate that there is no CaOH+-for-Ca2+ exchange at high pH. The apparent increase in Ca sorption in smectite interlayers with increasing pH is thus probably related to the precipitation of Calcium-Silicate-Hydrate (CSH) phases, which also accounts for the decrease in Si concentration under high-pH conditions. This precipitation is thermodynamically favoured.
1. INTRODUCTION
1 2
One of the possible multi-barrier storage concepts developed in France for 3
intermediate-level long-lived radioactive wastes (ILLW wastes) consists of vitrified waste 4
placed in containers and overpacks, encased in exogenous materials (near-field engineered 5
barrier) and ultimately buried in a clay-rich geological formation (far-field barrier). Bentonite, 6
a clay material mostly constituted of smectite, is considered a promising material as an 7
engineered barrier in the context of nuclear waste disposal. The potential of smectite stems 8
from its mechanical self-healing ability, its low hydraulic conductivity and its high sorption 9
capacities, the combination of which is assumed to help prevent or delay radionuclide 10
migration. However, the initial properties of smectite could be altered significantly by 11
storage-induced perturbations. For example, the use of concrete for waste overpacks or the 12
oxidation of pyrite, which is often present as an accessory mineral in the relevant geological 13
environments, can lead to a wide pH range for solutions saturating the clay-barriers. 14
Substitutions in either tetrahedral or octahedral sheets of the smectite structure 15
induce a permanent negative layer charge that is balanced by the presence of hydrated cations 16
in the interlayer space. The interlayer cation composition of smectite has been studied for 17
many decades as a function of the composition of the solution in contact with clay surfaces 18
(Vanselow, 1932a; Sposito, 1981 and references therein), and the thermodynamics of cation 19
exchange have been developed specifically to model these interlayer cation compositions 20
(Vanselow, 1932a; Sposito, 1977, 1981, 1984; Elprince et al., 1980; Shainberg et al., 1980; 21
Shu-Yuan and Sposito, 1981; Sposito et al., 1981, 1983a, 1983b, 1999; Fletcher and Sposito, 22
1989; Delville, 1991; Appelo and Postma, 2000). Smectite cation exchange affinities have 23
been established for a wide range of cations including protons, which possibly replace 24
interlayer cations under acidic conditions (Fletcher and Sposito, 1989 and reference therein). 25
For the most common interlayer cations, hydration of homoionic smectites has been 26
extensively studied and it has been shown, most often from the variation of 00ℓ basal 27
reflection d-spacings, that smectite incorporates H2O molecules in its interlayers. As a 28
consequence, with increasing relative humidity the smectite structure “swells” in different 29
steps corresponding to the intercalation of 0, 1, 2 or 3 layers of H2O molecules 30
(Nagelschmidt, 1936; Bradley et al., 1937; Mooney et al., 1952; Norrish, 1954; Walker, 31
1956). From these early studies, it is now accepted that the hydration ability of 2:1 32
phyllosilicates is controlled by factors such as the nature of the interlayer cation and the 33
amount of layer charge and its location (octahedral vs. tetrahedral). These observations have 34
led to different models in which crystalline swelling is controlled by the balance between the 35
repulsive forces between adjacent 2:1 layers and the attractive forces between hydrated 36
interlayer cations and the negatively charged surface of 2:1 layers (Norrish, 1954; Van 37
Olphen, 1965; Kittrick, 1969a, 1969b; Laird, 1996, 1999). The few studies devoted to the 38
hydration of bi-ionic smectites (Glaeser and Méring, 1954; Levy and Francis, 1975), and 39
(Iwasaki and Watanabe, 1988) on (Na, Ca)-smectites and (Mamy and Gaultier, 1979) on (K, 40
Ca)-smectites) have shown that interlayer cations tend to distribute in distinct interlayers 41
leading to a “demixed” state. 42
The present work aims at characterising the hydration state of an initially Ca-43
saturated montmorillonite as a function of pH in order to better predict smectite reactivity 44
under disturbed chemical conditions, such as those likely to occur in the vicinity of a nuclear 45
waste disposal. For this purpose, the combination of chemical modelling and XRD profile 46
modelling were used to follow the exchange of Ca2+ cations by protons under acidic 47
conditions. Specific X-ray diffraction modelling techniques based on a trial-and-error 48
approach were used to refine the early descriptions of smectite hydration by taking into 49
account the possible coexistence in the smectite structure of different layer types, each 50
exhibiting a specific hydration state (Bérend et al., 1995; Cases et al., 1997; Cuadros, 1997; 51
Ferrage et al., 2005a, 2005b). In particular, the likely mutual exclusion of calcium and protons 52
in smectite interlayers and the expected hydration contrast between such calcium- and proton-53
saturated smectite layers was used to follow the H3O+-for-Ca2+ exchange supposed to occur at 54
low pH. The same techniques were also used to assess the possible presence of cation – 55
hydroxide ions pairs under alkaline conditions proposed by Tournassat et al. (2004a, 2004b) 56
and Charlet and Tournassat (2005) on the basis of cation exchange experiments and chemical 57
modelling. 58
59
--- The following section to be typed in smaller characters --- 60
61
2. MATERIALS AND METHODS
62 63
2.1 Clay material preparation
64 65
The smectite used for this study was the SWy-2 montmorillonite reference from the 66
Source Clays Repository of The Clay Minerals Society 67
(http://www.agry.purdue.edu/cjohnston/sourceclays/index.html) with structural formula 68
(Stucki et al., 1984): [(Al3.01 Fe0.43 Mg0.56)(Si7.97 Al0.03)O20(OH)4] M+0.72. Naturally, this 69
montmorillonite is mostly Na-saturated, and exhibits a low octahedral charge deficit and 70
extremely limited tetrahedral substitutions (Mermut and Lagaly, 2001). 71
Size fractionation was performed by centrifugation to obtain a suspension of the 72
<2 µm size fraction. An ion-exchange process was then carried out on this clay separate at 73
room temperature with 1 mol.L-1 aqueous saline solution of CaCl2. The SWy-2 suspension 74
was shaken mechanically in this saline solution for 24h before separation of the solid fraction 75
by centrifugation and addition of fresh saline solution. This step was repeated three times to 76
ensure complete cation exchange. Excess salts were then washed by four 24h cycles, 77
including sedimentation, removal of the supernatant and re-suspension in deionised water 78
(milli-Q/18.2 MΩ cm-1). The clay content of the final Ca-SWy-2 suspension was found to be 79
~37g of clay per kg of suspension using the weighing method given by Sposito et al. (1981) 80
and revised by Tournassat et al. (2004a). 81
82
2.2 Sample preparation
83 84
Centrifugation tubes were precisely weighed (mtube in g) with a Mettler Toledo
85
AG285 balance. A ~3mL aliquot of the Ca-SWy-2 suspension was introduced into each 86
50 mL centrifuge tube with a calibrated micropipette (Vsusp, clay content ρ). Variable volumes
87
of Ca(OH)2 or HCl were then added to reach the desired pH after addition of deionised water 88
to obtain a 40 mL total volume (Vtot). The tubes were shaken for three hours. A 15mL
89
suspension aliquot was then collected from each tube, precisely weighed (VXRD) and used for
90
X-ray diffraction (XRD) data collection (see below). The remaining suspension was 91
centrifuged to separate the solution from the clay slurry. 92
An aliquot of supernatant fluid from each tube was further filtered (0.20 µm) before 93
measuring the pH with a pH-microelectrode (Mettler Toledo, InLab 423). Another aliquot 94
was filtered for Na, Ca, Si, Al, Mg and Fe concentration measurements (Csolelt, where elt
95
represents Ca, Si, etc.) using a Perkin-Elmer Optima 3300 DV inductively coupled plasma 96
atomic emission spectrometer (ICP-AES). Si, Al, Mg and Fe concentrations were measured 97
on a third supernatant aliquot obtained without prior filtration to give the mass of suspended 98
solids in the supernatant as explained in Tournassat et al. (2004a) (mcorrection). On the other
99
hand, the centrifuge tubes containing the clay slurry were weighed precisely (mcentrif) and 30
mL (VAmm) of 1 M ammonium acetate were added to each tube, each tube being precisely
101
weighed after ammonium acetate addition (mAmm) and shaken for 24h. NH4+ cations are meant 102
to replace Ca2+ cations in the smectite interlayer (e.g. Sposito et al., 1981, 1983a, 1983b) and 103
the subsequent measurement of Ca2+ concentration in the supernatant solution leads to the 104
Calcium Cation Exchange Capacity (Ca-CEC). Since some solution remained in the clay 105
slurry (Vslurry) before the addition of ammonium acetate, the volume of supernatant was equal
106
to the volume of added ammonium acetate plus this volume of solution in the slurry 107
(VAmm+slurry). Furthermore, the amount of Ca2+ present in the remaining slurry solution (CsolCa
108
× Vslurry) must be subtracted from the amount of Ca in the supernatant (CAmmCa × VAmm+slurry).
109
Hence, Ca-CEC is given by the following formula (in eq.kg-1, i.e. in mol of charge per kg of 110 clay): 111 correction tot XRD tot susp tot XRD tot susp tube centrif Ca sol slurry Amm Ca Amm m V V V V V V V V m m C V C CEC Ca − × − × × − × − − × − × × = − + ρ ρ 2 , (1) 112 with Amm tot XRD tot susp tube Amm slurry Amm d V V V V m m V × − × − − = + ρ (2) 113
where volumes (V) are in L, concentrations (C) in mol.L-1, clay content (ρ) in g.L-1 and 114
masses (m) in g. The density of all solutions was assumed to be equal to 1.0, except for the 115
density of the 1 M ammonium solution (dAmm = 1.077).
116 117
2.3 Chemical composition modelling
118 119
The chemical modelling used in this study was performed using the Phreeqc2 code 120
(Parkhurst and Appelo, 1999), since this versatile computer code is amenable to the various 121
conventions used to describe cation exchange and surface complexation. The model used for 122
cation exchange was similar to that developed by Tournassat et al. (2004a) and only the main 123
concepts and parameters are described to simplify understanding. Cation exchange capacity of 124
montmorillonite originates both from the presence of a permanent negative charge (σ0) in the 125
clay lattice resulting from octahedral and tetrahedral substitutions and from the presence of 126
broken bonds at the edges of clay platelets, which induces a pH-dependent charge (σH). By 127
combining a cation-exchange model based on the Vanselow convention (Vanselow, 1932a; 128
Sposito, 1981) with the pH-dependent charge model developed by Tournassat et al. (2004b) 129
for clay minerals, the evolution of the Ca-CEC value can be modelled as a function of pH. 130
Key parameters are cation exchange selectivity coefficients (Kint - Table 1), clay permanent
131
charge (σ0), structural formula and edge surface area. The latter parameter was considered to 132
be equal to that determined for the fine fraction of the commercial Wyoming bentonite MX80 133
montmorillonite (8.5 m2.g-1, Tournassat et al., 2003). From the adjustment to Ca-CEC data, 134
the σ0 value was taken to be 0.94 mol of charge (molc) per kg of clay. This value is similar, 135
within error, to the 1.0 molc.kg-1 value calculated from the structural formula. In the model 136
used, a decrease of Ca-CEC was interpreted either as a decrease of σH (typically from pH 4 to 137
10 in the present study) or as resulting from H+ sorption in the interlayer. 138
139
2.4 X-ray diffraction analysis and profile modelling
140 141
For XRD analysis, suspension aliquots were poured through a Millipore filter 142
(0.4µm) and the clay cake was then laid down on a previously weighed glass slide. The 143
resulting oriented preparations were then dried at room temperature and the mass of smectite 144
on the glass slide was precisely determined. XRD patterns were then recorded using a Bruker 145
D5000 diffractometer equipped with an Ansyco rh-plus 2250 humidity control device coupled 146
to an Anton Paar TTK450 chamber. Data collection was performed at 40% relative humidity 147
(RH) after an homogenisation period of 15 min before the measurement. Experimental 148
measurement parameters were 6s counting time per 0.04°2θ step. The divergence slit, the two 149
Soller slits, the antiscatter slit and the resolution slit were 0.5°, 2.3°, 2.3°, 0.5° and 0.06°, 150
respectively. For each sample, XRD patterns were collected over a time span not exceeding 151
one day after glass slide preparation. 152
The algorithms developed initially by Sakharov and Drits (1973), Drits and Sakharov 153
(1976) and more recently by Drits et al. (1997a) and Sakharov et al. (1999) were used to fit 154
experimental XRD profiles over the 2–50° 2θ CuKα range using a trial-and-error approach. 155
Instrumental and experimental factors such as horizontal and vertical beam divergences, 156
goniometer radius, length and thickness of the oriented slides were measured and introduced 157
without further adjustment. The mass absorption coefficient (µ*) was set to 45 cm2.g-1, as 158
recommended by Moore and Reynolds (1997) for clay minerals, whereas the parameter 159
characterising the preferred orientation of the sample (σ*) was considered as a variable 160
parameter. The z-coordinates for all atoms within the 2:1 layer framework were set as 161
proposed by Moore and Reynolds (1997). The z-coordinates of interlayer species for 162
dehydrated (0W) and mono-hydrated (1W) smectite layers were also set as proposed by 163
Moore and Reynolds (1997), in contrast to those for bi-hydrated (2W) layers, since a more 164
realistic description of the interlayer structure is obtained by assuming a unique plane of H2O 165
molecules on either side of the central interlayer cation (Ferrage et al., 2005a). The distance 166
along the c* axis from the interlayer cation plane and the H2O molecule plane is ~1.2 Å. 167
Additional variable parameters include the coherent scattering domain size (CSDS) 168
along the c*-axis, which was characterised by a maximum CSDS, set at 45 layers, and a mean 169
CSDS value (N – Drits et al., 1997b), which was adjusted. In addition, because of the weak 170
bonding between adjacent smectite layers, layer thickness is probably scattered about its 171
average value. This cumulative deviation from strict periodicity, described by Guinier (1964) 172
as a disorder of the second type and detailed later by Drits and Tchoubar (1990), can be 173
considered as strains and was accounted for by introducing a deviation parameter (σz). The 174
overall fit quality was assessed using the Rp parameter (Howard and Preston, 1989). This un-175
weighted parameter was preferred because it is mainly influenced by misfits on the most 176
intense diffraction maxima such as the 001 reflection, which contains essential information on 177
the proportions of the different layer types and on their respective layer thickness 178
The fitting procedure described in detail by Ferrage et al. (2005a) was used for all 179
experimental XRD profiles of exchanged Ca-SWy. Briefly, a main structure, periodic when 180
possible, was used to reproduce as much as possible of the experimental XRD pattern. If 181
necessary, additional contributions to the diffracted intensity were introduced to account for 182
the lack of fit between calculated and experimental patterns. These extra contributions were 183
systematically related to mixed-layered structures (MLS) containing two or three components, 184
randomly interstratified. Up to four structures were necessary to reproduce experimental 185
patterns, because of the very heterogeneous structures observed. However, layers with the 186
same hydration state present in the different MLS contributing to the diffracted intensity were 187
assumed to have identical properties to reduce the number of adjustable parameters. 188
Specifically for a given sample, each given layer type (0W, 1W or 2W layers) was provided 189
with a unique chemical composition, a unique layer thickness, and a unique set of atomic 190
coordinates for all contributions. Similarly, identical values of the σ*, N and σz parameters 191
were used at a given pH value for all MLSs, even though these parameters were nevertheless 192
allowed to vary as a function of pH. The relative proportions of the different MLSs and that of 193
the different layer types in these MLSs were also considered as variable parameters during the 194
fitting procedure. 195
The fitting strategy is illustrated in Figure 1 for the XRD pattern obtained for Ca-196
Swy-2 equilibrated in deionised water (pH = 6.41). Qualitatively, the experimental pattern 197
exhibits well-defined diffraction maxima forming a rational series with a d001 value 198
characteristic of a bi-hydrated state (~15.20 Å). However, a significant asymmetry is visible 199
on the high-angle side of the 001 and 003 reflections and on both sides of the 005 reflection 200
(arrows in Figure 1a) as demonstrated by the difference plot between the experimental pattern 201
and that calculated for the contribution of pure bi-hydrated smectite (100% of 2W layers). 202
According to the Méring principle (Méring, 1949), the residual maximum on the high-angle 203
side of the 001 reflection can be attributed to a MLS containing layers with a lower layer 204
thickness in addition to 2W layers. Accordingly, a satisfactory fit (Rp = 1.45%) was obtained 205
when a second contribution (S2 – S1:S2 = 87:13), resulting from the random 206
interstratification of 2W, 1W and 0W layers (60%, 30% and 10%, respectively – Figs. 1b, c), 207
was added to the initial contribution (S1), as schematised by the pictogram shown in Figure 208
1d. In this pictogram, the relative proportions of the two MLSs contributing to the diffracted 209
intensity are represented along the vertical axis by their respective surface areas whereas the 210
proportions of the different layer types in each structure are represented on the horizontal axis. 211
Overall, this sample contains 95% of 2W layers, 4% of 1W layers and 1% of 0W layers. 212
One may note that the calculated XRD patterns are not plotted over the low angle 213
region (2θ angles lower than 5°) because the shape of the computed “background” over this 214
angular range is not consistent with that of experimental patterns. The origin of this 215
discrepancy is discussed by Ferrage et al. (2005a) using the recent theoretical developments 216
made by Plançon (2002). These new insights into the real structure of clay aggregates may 217
make it possible to reproduce experimental patterns over this angular range but they would 218
not bring into question the results reported in the present manuscript. 219
2.5. Near Infrared Diffuse Reflectance analysis
221 222
Near infrared diffuse reflectance (NIR-DR) spectra were recorded using a Perkin-223
Elmer 2000 FTIR spectrometer equipped with a deuterated triglycine sulphate (DTGS) 224
detector, a tungsten-halogen source and a quartz beam-splitter. The optical device used is 225
based on the Harrick© equipment. Diffuse reflectance spectra were recorded from 4000 to 226
8000 cm-1 with a spectral resolution of 8 cm-1 and obtained from the addition of 50 individual 227
scans. Samples were placed into a Harrick© cell in which the temperature and pressure were 228
controlled from 25-100°C and from 10-4-105 Pa, respectively. Sample temperature was 229
measured to an accuracy greater than 0.1°C using a Pt resistance. The spectra of hydrated 230
samples equilibrated at room humidity (40 ± 5%) were recorded first. The samples were 231
subsequently out-gassed at 60°C for 16 hours under a residual pressure of 5.10-3 Pa by using a 232
two-stage pump comprising a scroll pump and a turbomolecular pump. Two complementary 233
gauges (Pirani and ionisation types) were used to measure the pressure from 10-4 Pa to room 234
pressure. Spectra were then recorded at a sample temperature of 25°C under a residual 235
pressure of 5.10-4 Pa. The diffuse reflectance, R, is defined as: 236
( )
( )
σ σ D D S I I R 0 log − = (3) 237 where D SI is the collected diffused irradiance of the sample, ID
0 the collected diffused
238
irradiance of the reference and σ the wavenumber. The reference was taken at 24.8°C from a 239
potassium bromide ground powder subsequently dried under a residual pressure of 5.10-3 Pa. 240
For clay samples, the spectral domain presented in this study can be split into two 241
regions. From 4550 to 5500 cm-1, only H2O molecules can be observed from the combinations 242
of stretching and bending modes. From 6500 to 7500 cm-1, overtones of stretching modes of 243
all hydroxyl groups, both from interlayer H2O molecules and from the silicate framework, are 244
visible (Burneau et al., 1990; Madejova et al., 2000b). As fundamental stretching modes of 245
hydroxyl groups have been reported previously over the 3370-3670 cm-1 range (Madejova et 246
al., 2000a; Vantelon et al., 2001; Bishop et al., 2002), the frequency range calculated for the 247
first stretching overtone extends from 6575-7175 cm-1, assuming a 82.5 cm-1 anharmonicity 248
coefficient for OH groups (Burneau and Carteret, 2000). 249
250
--- End of the section to be typed in smaller characters --- 251
252
3. RESULTS
253 254
3.1. Cation concentrations in solution and in the clay interlayer
255 256
Concentrations of Ca, Al, Fe and Mg cations in solution are plotted as a function of 257
pH in Figure 2. As observed in earlier studies (Baeyens and Bradbury, 1997; Tournassat et al., 258
2004a), the concentrations of Al, Fe and Mg in solution increase under low pH conditions as a 259
result of clay dissolution and/or desorption processes. In addition, below a pH value of about 260
3, Ca concentration in solution dramatically increases as the pH decreases, although no Ca is 261
added. At the same time, the apparent amount of Ca sorbed in the clay interlayer decreases 262
(Fig. 3), whereas no other cation, such as Na, Al, Fe or Mg, appears to be sorbed in the 263
interlayer from NH4+ exchange experiment results. With decreasing pH, Ca2+ is thus certainly 264
replaced by protons in the smectite interlayer as previously hypothesized (Gilbert and 265
Laudelout, 1965; Fletcher and Sposito, 1989; Bradbury and Baeyens, 1997; Tournassat et al., 266
2004b). 267
Under high pH conditions (pH > 12), the addition of Ca(OH)2 to the clay suspension 268
leads both to an increase in the Ca concentration in solution and to an increase in the apparent 269
Ca2+ sorption on smectite (Figs. 2a, 3). From these observations, and specifically from the 270
concomitant increase in OH- sorption, Tournassat et al. (2004a, 2004b) have hypothesized the 271
sorption of CaOH+ ion pairs in the smectite interlayers, as observed for CaCl+ when ionic 272
strength is high (Sposito et al., 1983a, 1983b; Tournassat et al., 2004b; Ferrage et al., 2005c). 273
However, the concentration of Si in solution decreases simulatenously with the apparent 274
increase of Ca2+ sorption on smectite (Fig. 3). This correlation possibly indicates the 275
precipitation of a tobermorite-like Ca-Si phase at high pH (Claret et al., 2002; Tournassat et 276
al., 2004a, 2004b) as discussed below. This hypothesis is also supported by the steady 277
evolution of solution chemistry reported by Tournassat et al. (2004a) when working in a Na+ 278
ionic medium rather than in a Ca2+ one. However, sorption of CaOH+ ion pairs cannot be 279
differentiated from the precipitation of a Ca-Si phase on the sole basis of analytical chemistry 280
experiments. As a consequence, modelling of XRD experiments was carried out in order to 281
characterise the clay structural changes associated with the observed chemical evolutions, and 282
to assess the various hypotheses arising from chemical modelling. 283
284
3.2. Solid characterisation under acidic conditions
285
The qualitative observation of the 001 reflection recorded at a constant RH value 286
(40%) for samples equilibrated at different pH values shows a dramatic modification of the 287
smectite hydration state with decreasing pH (Fig. 4a), most probably resulting from the 288
modification of the smectite interlayer composition. Near neutral pH, smectite is mainly bi-289
hydrated (d001 ~ 15.2 Å), whereas at low pH values (e.g. 0.14) the presence of protons in the 290
smectite interlayer leads to the shift of the 001 reflection towards lower d001 (~12.6 Å), which 291
are characteristic of 1W smectites. When decreasing the pH from near neutral condition (pH = 292
6.41), the steady decrease of the 001 reflection intensity and the increase of the asymmetry on 293
its high-angle side are consistent with the continuous incorporation of 1W layers. Extremely 294
heterogeneous structures, most probably corresponding to the interstratification of 2W and 295
1W layers, are observed at intermediate pH values (e.g. 1.41), whereas at lower pH values, the 296
steady increase in the 12.6 Å peak intensity and its sharpening are indicative of a 297
homogeneous 1W state. 298
In the modelling of these experimental XRD patterns, it was assumed that the 1W 299
and 2W layers correspond to smectite layers saturated with protons and Ca2+ cations, 300
respectively. This hypothesis is strongly supported by the overwhelming presence of 2W 301
layers in low-charge montmorillonite equilibrated at 40% RH (Ferrage et al., 2005a). In 302
addition, for layers saturated by protons, it was assumed that the layer charge compensation 303
was achieved by H3O+ cations, as the difference between H3O+ or H+ cations could not be 304
differentiated from the presence of an additional H2O molecule on the mid-plane of the H+ -305
saturated interlayer. Finally, because X-ray diffraction is only sensitive to the electronic 306
density, a simple calculation of the scattering factor for θ = 0 weighted to the cation valency 307
(η index) shows that it is not possible to differentiate, from the diffracted intensity, between 308
interlayers saturated by Ca2+ or H3O+ cations. Ca2+ cations contain 18e- and therefore η = 9e -309
per charge unit (c.u.) whereas for H3O+ ions η = 10 e-/c.u. This calculation shows that the 310
systematic presence of protons as interlayer cations in 1W, which was initially assumed, will 311
not significantly impact the proportion of the different layer types derived from XRD profile 312
modelling. 313
The calculated profiles are compared to the experimental patterns in Figure 5 and the 314
relative contributions to the diffracted intensity as a function of pH are schematised in Figure 315
6 together with the composition of the associated MLSs. The relative contributions of the 316
different MLSs to the diffracted intensity and their evolution as a function of pH are 317
illustrated in Figure 7 for characteristic XRD patterns. Additional structural parameters, such 318
as the layer thickness of the different layer types, their content of H2O molecules, the number 319
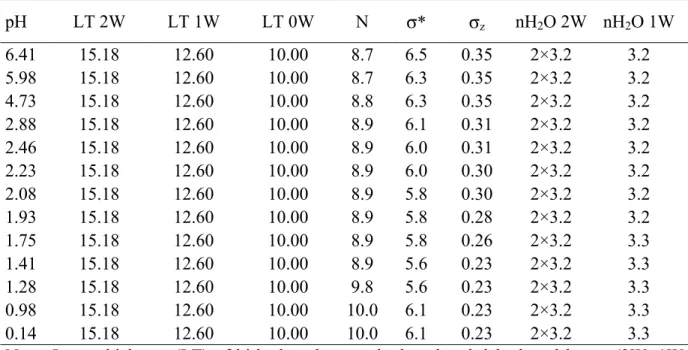
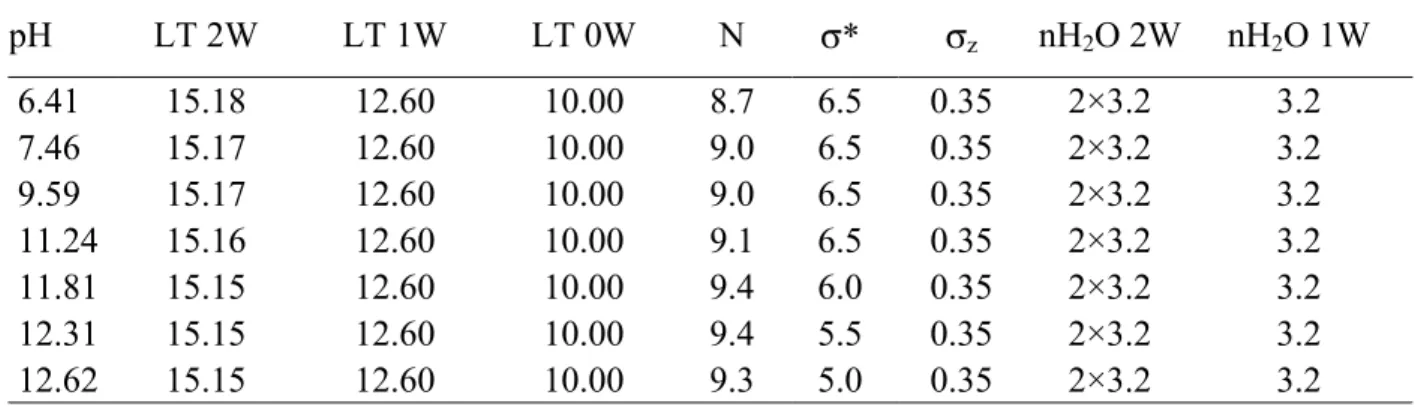
N of layers building up CSDs, σ* and σz are listed in Table 2. 320
A similar model was found for pH values of 6.41 and 5.98. This model, which is 321
described in the method section, includes both a periodic structure containing only 2W layers 322
and a MLS containing the three layers types (2W:1W:0W ratio 60:30:10 – Figs. 1, 5, 6). The 323
relative abundance of the MLS increases slightly at the expense of the periodic one as pH 324
decreases (Fig. 6). Structure models obtained for the pH values down to 2.88 are quite similar 325
to the previous one, differing only in the presence of a small amount (~2%) of 1W layers in 326
the former periodic structure (Fig. 6). Again, the relative contribution of the most 327
homogeneous structure decreases with decreasing pH. For pH values between 2.46 and 1.93, 328
all attempts to reproduce experimental XRD patterns with two contributions were 329
unsuccessful. As the asymmetry on the high angle side of the 001 reflection becomes more 330
pronounced (Figs. 5, 7) it was necessary to introduce a third contribution. As compared to the 331
previous two contributions, this additional MLS must incorporate a noticeable amount of 1W 332
layers to account for the observed asymmetry. The optimum composition determined for this 333
additional MLS was a 2W:1W:0W ratio of 30:60:10 (Figs. 5, 6). In addition, the composition 334
of the mostly bi-hydrated structure was modified to increase the content of 1W layers up to 335
5% for these pH values between 2.46 and 1.93. The contributions of the different MLS to the 336
XRD pattern recorded for sample pH = 1.93 are illustrated in Figure 7a, in which it is possible 337
to observe the contribution of the additional MLS as a broad modulation at ~14°2θ. 338
When lowering the pH value to 1.75, it was again necessary to consider an additional 339
contribution to the diffracted intensity in order to satisfactorily fit the experimental XRD 340
pattern (Figs. 5, 6, 7b). In Figure 7b, the maximum at ~14°2θ now appears as a better-defined 341
peak as compared to Figure 7a, the position of this well-defined maximum indicating that this 342
additional MLS is essentially mono-hydrated. The additional presence of this new MLS 343
(1W:0W ratio 99:1) allows a satisfactory fit to the experimental XRD profile. In Figure 7b, 344
one may also note the presence on the high-angle side of the 001 reflection of broad 345
modulations whose positions are consistent with those of the various MLSs contributing to 346
the calculated intensity. The very heterogeneous structure observed at pH 1.41 (Figs. 6, 7c) 347
was modelled using the same four MLSs as those reported for the previous sample. The 348
composition of these four structures was kept constant for the two samples (pH 1.75 and 349
1.41), the fit of the experimental profile being achieved by varying the relative proportions of 350
the various MLSs (Figs. 5, 6, 7c). A similar model was used to fit the experimental XRD 351
pattern recorded at pH 1.28 (Figs. 5, 6, 7d). In this model, variation of the relative proportion 352
of the different MLSs accounts for most of the profile modification in addition to a limited 353
decrease of the 2W layer content in one of the MLSs. As for the sample at pH = 1.75, 354
modulations, now observed on the low-angle side of the 001 reflection, allow the composition 355
of the different contributions (Fig. 7d) to be defined. On XRD patterns recorded at pH values 356
of 0.98 and 0.14, the 001 reflection appears sharper and more symmetrical, thus allowing a 357
satisfactory fit with only two contributing MLSs (Figs. 5, 6, 7e). The first MLS accounts for 358
most of the diffracted intensity and corresponds to an almost periodic 1W structure, whereas a 359
second MLS (2W:1W:0W ratio 30:40:30) enables the “tails” of the 001 reflection to be fitted 360
(Figs. 6, 7e). With decreasing pH, the content of 2W layers slightly decreases in the latter 361
MLS (Fig. 6). 362
While fitting all the XRD patterns collected under acidic conditions, special attention 363
was paid to keep layer thickness constant for all three layer types (2W, 1W, and 0W – Table 364
2). In addition, for a given sample, the layer and crystal parameters were kept identical for all 365
the MLS, and only the composition and the relative proportions of the different MLSs was 366
allowed to vary. Most structural parameters were found constant with pH, except for the size 367
of CSDs and σz, which decrease with decreasing pH, whereas the water content slightly 368
increases in 1W layers (Table 2). The relative proportions of the different layer types are 369
plotted in Figure 8 as a function of pH to highlight the change in hydration state induced by 370
the progressive exchange of H3O+ for interlayer cations as pH decreases. 371
372
3.3. Solid characterisation under basic conditions
373 374
No significant change in the 001 reflection profile is observed over the basic pH 375
range (Fig. 4b), except for a limited shift of the position from 15.20 Å for near neutral pH 376
conditions to 15.15 Å at pH = 12.62. The extremely similar XRD profiles observed over the 377
whole angular domain (Figs. 4b, 9) are indicative of a constant hydration state over the whole 378
basic pH range. This is confirmed by the comparison between the experimental and calculated 379
XRD patterns (Fig. 9) and by the structure models reported in Figure 10 and further detailed 380
in Table 3. A model similar to that obtained in near neutral conditions (Fig. 1) was used to 381
reproduce the experimental patterns. This model consists of two structures, the first one 382
containing exclusively (6.41-9.59 pH range) or mostly (11.24-12.62 pH range) 2W layers, 383
whereas the three layer types are present in the second MLS (Fig. 10). The relative 384
proportions of the two structures (Fig. 10) and that of the different layer types (Fig. 8) are 385
about constant over the basic pH range. Most structural parameters were also found to be 386
constant over the basic pH range since only a limited increase in the number of layers in the 387
CSDs and a slight decrease of the layer thickness for 2W layers were observed with 388
increasing pH (Table 3). 389
390 391
4. DISCUSSION
391 392
4.1. H3O+-for-Ca2+ exchange at low pH
393
4.1.1. H3O+-for-Ca2+ exchange. XRD vs. chemical modelling
394 395
Under acidic conditions, a dramatic change in the hydration state is observed as pH 396
decreases from the position of the 001 reflection, which shifts from 15.2 Å (2W layers) under 397
near-neutral conditions to 12.6 Å (1W layers) under low pH conditions. As Ca-saturated low-398
charge montmorillonite is predominantly bi-hydrated at 40% RH, this modification may be 399
linked to the progressive exchange of protons for interlayer Ca2+ that can be deduced from the 400
chemical data (Fig. 3). This data can be simulated with the model given by Tournassat et al. 401
(2004a, 2004b) to deduce the interlayer chemical composition as a function of pH (Fig. 11). 402
The cation exchange reaction selectivity coefficients (Kint) reported by Tournassat et al.
403
(2004a) were used (Table 1), whereas the structural CEC was adjusted to a consistent 0.94 404
eq.kg-1 value; no other parameter was fitted. Interlayer composition modelling confirms that 405
Na, Al, Fe or Mg do not sorb in the interlayer to a significant extent (data not shown). This 406
chemical modelling rather implies the sorption in the interlayer of several species such as 407
Ca2+ or H+, but also CaCl+ ion pairs. The incorporation of the latter ion pairs at high ionic 408
strength has been demonstrated by Ferrage et al. (2005c) from the resulting modification of 409
XRD reflection intensity distribution and of the layer thickness value. In the present study, no 410
significant change in the reflection relative intensities is observed and the layer thickness 411
value determined for 2W layers is remarkably constant over the whole low-pH range (Fig. 5 - 412
Table 2). However, the XRD modelling approach is not sensitive enough to detect the low 413
amount of sorbed CaCl+ species modelled (Fig. 11). 414
The consistency between the XRD modelling and chemical modelling results can be 415
assessed by calculating the hydration state of the sample from the latter results while 416
assuming a fixed hydration state for each interlayer cation. At near-neutral pH (pH = 6.41), 417
interlayers are purely Ca2+-saturated and the hydration state of the sample (2W:1W:0W ratio 418
95:4:1) determined at this pH may be attributed to Ca2+-saturated layers. At extremely low pH 419
(0.14), the 2W:1W:0W ratio is 6:84:10. However, even at this low pH value, a small 420
proportion of Ca2+ cations are still sorbed in the smectite interlayer (0.004 mol.kg-1 at pH = 421
0.14), and the 2W present at this low pH value could possibly be related to remaining Ca2+ -422
saturated layers. H3O+-saturated layers were thus assumed to be either 1W or 0W in a 89:11 423
ratio similar to the 84:10 ratio determined from XRD profile modelling. Using these two 424
hydration states for Ca2+- and H3O+-saturated layers it is possible to calculate from the 425
chemical modelling results the proportion of the different layer types as a function of pH (Fig. 426
12). The excellent agreement found with the data derived from XRD profile modelling 427
confirms that H3O+ and Ca2+ cations do not coexist in a single interlayer, since this 428
coexistence would induce a significant and strong discrepancy, particularly in the transition 429
region. This segregation of the different cations in different interlayers corresponds to the 430
“demixed state” previously described in heteroionic smectites. 431
Based on water adsorption isotherms, Glaeser and Méring (1954) first suspected the 432
presence of a demixed state in (Na, Ca)-smectites. They demonstrated that Na+ and Ca2+ 433
cations tend to be distributed in different interlayers but the demixing was interpreted as being 434
incomplete for RH values lower than 75%. These results were confirmed by Levy and Francis 435
(1975) using XRD, and Mamy and Gaultier (1979) reported a similar behaviour in (K, Ca)-436
smectite. More recently, Iwasaki and Watanabe (1988) were able to refine the distribution of 437
Na+ and Ca2+ cations in smectite and smectite-illite MLSs. Assuming that layers with L.Tck. 438
of ~15.0 Å and ~12.5 Å were Ca- and Na-saturated, respectively, these authors consistently 439
demonstrated that Na+ and Ca2+ cations are distributed in different layers leading to the 440
occurrence of segregated domains. 441
442
4.1.2. Mechanism of H3O+-for-Ca2+ exchange
443 444
In the observed H3O+-for-Ca2+ exchange, H3O+ cations replace Ca2+ cations in a layer by layer 445
process, but there is no information on the influence of a given interlayer content on the 446
exchange probability in the next interlayer. The presence of almost periodic 2W and 1W 447
structures systematically suggests a significant segregation in the layer stacking during the 448
exchange process but there is no information directly available on the evolution of the 449
segregation during the process. However, the occurrence probabilities of every layer pair can 450
be calculated from the structure models obtained (Fig. 6 – Drits and Tchoubar, 1990), and it is 451
especially relevant to follow the segregation of Ca-saturated 2W layers by using the 452
segregation index Sg(2W) defined by Cesari et al. (1965) and more recently by Drits and 453 Tchoubar (1990): 454 2W 2W -2W W -1 P -1 -1 Sg(2W)= , (4) 455
where W2W < P2W-2W ≤ 1, W2W being the relative abundance of 2W layers in the sample and 456
P2W-2W the probability for a 2W layer to follow a 2W layer in the layer stacks. Sg(2W) ranges 457
from 1 for a physical mixture and 0 for a random distribution of layers. To account for the n 458
structures contributing to the diffracted intensity W2W is expressed as: 459 ] W [Ab.MLS W n 1 i i 2W i 2W
∑
= × = (5) 460where Ab.MLSi is the relative contribution of the structure MLSi, and i 2W
W the relative 461
proportion of 2W layers in this structure. For the global sample P2W-2W is calculated as: 462
2W 2W -2W 2W -2W W W P = (6) 463
where W2W-2W is the relative abundance of layer pairs constituted of two 2W layers. Taking 464
into account the n structures contributing to the diffracted intensity, this term is calculated as: 465 ] W [Ab.MLS W n 1 i i 2W 2W i 2W -2W
∑
= − × = (7) 466In the present study, layer stacking is random in all MLS contributing to the diffracted 467
intensity and equation 4 can thus be transformed to: 468
∑
∑
∑
= = = × × × = n 1 i i 2W i n 1 i i 2W i n 1 i 2 i 2W i ] W [Ab.MLS -1 ] W [Ab.MLS / ] ) W ( [Ab.MLS -1 -1 Sg(2W) , (8) 469Note that equation 8 is valid only if all MLS contributing to the diffracted intensity are 470
randomly interstratified. As a function of pH, the calculated Sg(2W) value ranges from 0.2 to 471
0.4 whatever the W2W value (Fig. 13). This Sg(2W) value corresponds to a limited degree of 472
segregation, and its stability, within error, throughout the whole pH range, including the 473
H3O+-for-Ca2+ exchange zone, indicates that this cation exchange occurs randomly within the 474
crystals with no influence of the interlayer cation present in the adjacent interlayers. 475
476 477
4.1.3. XRD characterisation of the resulting solid
478 479
The XRD profile modelling approach used in the present study allowed all of the 480
experimental patterns to be reproduced satisfactorily, but it led in a few cases to extremely 481
heterogeneous structures, as up to four contributions were sometimes necessary to fit XRD 482
profiles. However, in order to reduce the number of adjustable parameters associated with 483
these additional contributions, all layers were assumed to have strictly identical properties 484
(layer thickness, σz, and H2O content) in all contributions for a given sample. In addition, the 485
size of the CSDs (N) and the preferred orientation parameter (σ*) were also identical for the 486
different MLSs contributing to a given XRD pattern. At each pH value, adjustable parameters 487
were thus limited to the composition of the different MLSs, and to their relative proportions. 488
Moreover, when four MLSs were used to fit the experimental XRD patterns (pH = 1.75, 1.48 489
and 1.28 – Fig. 6), these parameters were found to be consistent from one pH value to the 490
next. Two of these four contributions correspond to essentially bi- or mono-hydrated smectite 491
whereas the other two, which account for the heterogeneous layer stacks resulting from the 492
ongoing exchange process, have approximately constant compositions. 493
The decrease in interlayer thickness fluctuation (σz parameter) from 0.35 Å for near 494
neutral conditions to 0.23 Å (Table 2) for acidic conditions is associated with the hydration 495
state modification from an essentially bi-hydrated state to an essentially mono-hydrated state. 496
This correlation is consistent with the observations of Ferrage et al. (2005a) on a 497
montmorillonite SWy-1 sample saturated with various monovalent and divalent cations. 498
Indeed, these authors noted that the σz parameter is significantly higher (0.25-0.50 Å) when 499
the sample is dominated by 2W layers than when 0W or 1W layers prevail (0.15-0.25 Å). 500
They attributed the higher σz values determined for 2W layers to their higher layer thickness, 501
which implies in turn weaker electrostatic interactions between the negatively charged layer 502
and the interlayer cations. As a consequence, the respective positions of two adjacent 2:1 503
layers are weakly constrained and the resulting variation of layer thickness from one 504
interlayer to the adjacent one is enlarged. This phenomenon is likely to occur also for 1W 505
layers, but the lower layer thickness values and the different location of H2O molecules 506
considerably reduce the screening of electrostatic interactions between the 2:1 layer and the 507
interlayer cations. 508
In addition, Ferrage et al. (2005a) have observed higher σz values at the transition 509
between two individual hydration states, possibly as a result of the coexistence, within a 510
single interlayer, of different hydration states resulting in a high degree of fluctuation in the 511
interlayer thickness. On the contrary, in the present study, the σz values steadily decrease with 512
decreasing pH even over the H3O+-for-Ca2+ exchange zone characterised by heterogeneous 513
structures. Such an even decrease is indicative of the homogeneous hydration state of each 514
interlayer, that is of the mutual exclusion of Ca2+ and H3O+ cations in a single interlayer, 515
again suggesting a layer-by-layer exchange process leading to a "demixed" state (Glaeser and 516
Méring, 1954; Levy and Francis, 1975; Mamy and Gaultier, 1979; Iwasaki and Watanabe, 517
1988). This is also consistent with the constant layer thickness values determined for both 1W 518
and 2W layers throughout the low-pH range (Table 2). 519
In addition, the number of layers in the CSDS also increases from ~8.7 under neutral 520
conditions to ~10.0 under acidic conditions. This steady increase with the transition from a bi-521
hydrated state to a mono-hydrated state is consistent with the decreasing N values determined 522
by Ferrage et al. (2005a, 2005b) for smectite XRD at high RH values when 2W layers prevail, 523
in agreement with Mystkowski et al. (2000). This evolution can possibly be related to the 524
breakdown of crystals resulting from the swelling of specific interlayers, which statistically 525
decreases the crystallite thickness with increasing RH. 526
527
4.2. Assessment of the presence of CaOH+ ion pairs in the alkaline pH range
528 529
The possibility of interlayer CaOH+ ion pairs compensating the octahedral charge 530
under alkaline conditions has been evoked on the basis of cation exchange experiments and 531
chemical modelling to model the apparent increase of sorbed Ca2+ at high pH values (Fig. 3 – 532
Charlet and Tournassat, 2004; Tournassat et al., 2004a, 2004b). However, Ferrage et al. 533
(2005c) has shown that the presence of CaCl+ ion pairs similarly evoked for samples 534
equilibrated with saline solutions (Sposito et al., 1983a 1983b; Tournassat et al., 2004b) 535
induces significant modification of the experimental XRD patterns. These modifications 536
affect (i) the intensity ratio between the reflections, as a result of the increase in the electronic 537
density in the interlayer, (ii) the homogeneity of layer thickness (lower σz values), and (iii) the 538
hydration properties of exchanged smectite, in particular by lowering the relative humidity 539
value necessary for the bi- to mono-hydrated transition. In addition, the presence of CaCl+ ion 540
pairs may be assessed using NIR-DR spectroscopy from its influence on interlayer H2O 541
vibration bands. The methodology developed by Ferrage et al. (2005c) to assess the presence 542
of CaCl+ ion pairs in the interlayer of montmorillonite, was applied in the present study to 543
asses the possible presence of CaOH+ ion pairs under high pH conditions. 544
545
4.2.1. XRD characterisation of the solid
546 547
Under alkaline conditions, no significant modification of the experimental XRD 548
patterns is observed as a function of pH and the resulting structure models are similar over the 549
whole pH range investigated (pH 6.41-12.62). However, it was not possible to keep the layer 550
thickness of 2W layers constant and a very limited variation was observed (from 15.17 to 551
15.15 Å), whereas other structural parameters (σ*, σz, N or water content) were found to be 552
constant over the whole pH range (Table 3). If CaOH+ ion pairs were sorbed in the smectite 553
interlayers at high pH values, relative reflection intensities in the high-angle region would be 554
significantly affected, even though the electron density is lower for CaOH+ ion pairs (28e -555
/c.u.) than for CaCl+ ion pairs (36 e-/c.u.). The impact of CaOH+ ion pairs on XRD profiles is 556
illustrated in Figure 14, which shows two patterns calculated for the sample at pH = 12.62. 557
The first pattern (solid line) is calculated assuming only Ca2+ as the interlayer cation, whereas 558
the second pattern (grey line) is calculated with CaOH+ ion pairs as compensating species, all 559
other structure parameters being kept constant. The presence of CaOH+ ion pairs is clearly 560
demonstrated by the increase in the 002 and 003 reflection intensity. On the contrary, all 561
experimental profiles displayed in Figure 9 are similar, and the presence of interlayer CaOH+ 562
ion pairs may be dismissed. 563
564
4.2.2. NIR-DR spectroscopy characterisation of the solid
565 566
NIR-DR spectroscopy was used as an independent, complementary technique to 567
investigate the possibility of CaOH+ sorption in montmorillonite interlayer under high-pH 568
conditions. This technique allows the amount of water and its local interaction with interlayer 569
species to be studied. In addition, the high sensitivity of infrared spectroscopy for hydroxyls 570
should allow the detection of partial CaOH+-for-Ca2+ exchange, especially in the hydroxyl 571
band region. In their study, Ferrage et al. (2005c) showed that when the octahedral charge is 572
compensated by CaCl+ ion pairs instead of Ca2+ cations, the main modifications to NIR-DR 573
spectra are: (i) for hydrated samples (40% RH), an increased amount of H2O induced by the 574
increased amount of interlayer cationic species and (ii) for out-gassed samples, a shift of H2O 575
vibration bands induced by the perturbation of the H2O-Ca2+ interaction by Cl- anions. On the 576
contrary, the NIR-DR spectra recorded at 0% and ~40% RH for samples obtained at pH 6.41 577
and 12.62 (Figs. 15, and 16, respectively) are almost identical to each other, whatever the data 578
collection conditions. In the spectral domain of combinations of H2O molecules (4550-5500 579
cm-1), the band at 5240-5250 cm-1 can be assigned to H2O molecules perturbed by interlayer 580
cations. At 0% RH, this band is still visible, indicating the presence of H2O molecules despite 581
the out-gassing conditions (Fig. 15). The residual difference between the spectra recorded for 582
samples obtained at pH 6.41 and 12.62 (Fig. 15c) reveals a slightly higher amount of H2O 583
molecules in the sample at pH = 6.41. This difference, which probably results from not 584
strictly identical out-gassing conditions and H2O desorption kinetics for the two experiments, 585
again pleads against the presence of CaOH+ ion pairs in the smectite interlayer under high-pH 586
conditions. In the spectral domain of overtones (6500-7500 cm-1), similar bands are observed 587
for the two samples at 6910 and 7090 cm-1. 588
As observed under out-gassed conditions, the two spectra recorded at 40% RH for 589
the same samples are similar (Fig. 16), whereas several modifications between the two sets of 590
spectra result from the presence of H2O molecules. At 40% RH, a shoulder located at 591
~5130 cm-1 is observed for the two samples in the region of combinations (Fig. 16a,b) and the 592
band observed at 5240 cm-1 under out-gassed conditions is shifted to 5250 cm-1. These two 593
bands account for the presence of H2O molecules weakly adsorbed on interlayer cations and 594
H-bonded vibrations. Overtones of H2O molecules and hydroxyl stretching are also shifted by 595
the presence of water and are observed at 6830 and 7080 cm-1 for the two hydrated samples. 596
As for spectra recorded under out-gassed conditions, the difference between the two spectra 597
(Fig. 16c) reveals that the amount of H2O is again slightly higher in the sample prepared at 598
pH = 6.41 as compared to the one obtained under high-pH conditions. This difference most 599
probably results from slightly different experimental conditions rather than from a contrasting 600
interlayer composition, again pleading against the presence of CaOH+ ion pairs in the smectite 601
interlayer under high-pH conditions. 602
603
4.2.3. Implications on the modelling of the analytical chemistry results for the alkaline pH
604
range
605 606
As discussed above, XRD and NIR-DR spectroscopy results consistently show that 607
CaOH+ ion pairs do not enter smectite interlayers at high pH in a calcium cation background. 608
Hence, the analytical chemistry results need to be modelled without the contribution of such 609
ion pairs and the modelling results from Tournassat et al. (2004b), accounting for the sorption 610
of CaOH+ pairs, must be re-examined. 611
Ca-CEC, the apparent CEC in a Ca2+ cation background (in eq.kg-1 or molc.kg-1), is 612
given by the following equation: 613
Ca-CEC ⇔ 2 × Casorbed (9)
614
where Casorbed is the amount of Ca sorbed on clay surfaces in mol.kg-1. If one assumes that 615
CaOH+ is the only compensating species in smectite interlayers at high pH, the reaction taking 616
place during the Ca-CEC measurement experiment is: 617
XCaOH + NH4+ ⇔ XNH4 + Ca2+ + OH- (10)
618
where X- represents one mole of the exchanger phase. Then, Casorbed = 2 [Ca2+]1/ρ, where 619
[Ca2+]1 is the concentration of Ca2+ released in solution by reaction 10 and determined 620
experimentally (Sposito et al., 1981, 1983a). The presence of CaOH+ in exchange position 621
thus leads to an apparent increase in the Ca-CEC as each Ca in solution is converted to two 622
structural charges in the calculation, even though one CaOH+ equilibrates only one structural 623
charge (Sposito et al., 1983a, 1983b). 624
CaOH+ exchange also leads to the net consumption of one OH- per sorbed CaOH+, 625
leading to a one-to-one correlation between the change of apparent surface charge 626
(disappearance of OH- in eq.kg-1) and that of Ca-CEC (in eq.kg-1 – reaction 11 – Tournassat et 627
al., 2004a, 2004b): 628
X2Ca + 2 OH- ⇔ 2 XCaOH (11)
629
Hence, reaction 11 could explain almost perfectly the increase in Ca-CEC as a 630
function of pH in the present study and the Ca2+-CEC vs. "sorbed” OH- stoichiometry 631
observed in the study of Tournassat et al. (2004a, 2004b). This assumption is in contradiction 632
with the experimental evidence deduced from XRD and NIR-DR spectroscopy results. 633
As precipitation of a Ca-Si phase can be an alternative explanation for the apparent 634
increase in Ca sorption and for the decrease in Si concentration occurring under high-pH 635
conditions, the saturation index of many Calcium-Silicate-Hydrate (CSH – HATCHES, 1998) 636
were calculated as a function of pH for the solution composition reported in the present study 637
and in that of Tournassat et al. (2004a). Among the results listed in Table 4, it is possible to 638
note that both CSH 0.8 and CSH 1.1 (HATCHES, 1998) are oversaturated with respect to the 639
chemical conditions prevailing in solution. Since CSH 0.8 is closer from its equilibrium ion 640
activity product than CSH 1.1, the former phase is more likely to precipitate, as described in 641
the following reaction: 642
0.8 Ca2+ + SiO2 + 1.4 H2O + 1.6 OH- ⇔ Ca0.8SiO5H4.4 (12) 643
The precipitate would remain in the clay slurry during the centrifugation step before 644
addition of NH4+. This addition desorbs Ca2+ from the interlayer and also induces the 645
dissolution of the CSH 0.8 phase as a result of the pH decrease resulting from the dilution of 646
the alkaline solution in contact with the clay slurry. In turn, this dissolution leads to the 647
release of Ca2+ in solution and to the observed apparent increase in the Ca-CEC. Since 648
reaction 12 leads to a one-to-one correlation between the change of apparent surface charge 649
and that of Ca-CEC (disappearance of 1.6 molc of OH- and 0.8 × 2 = 1.6 molc of Ca2+), it may 650
equally account for the observed Ca2+-CEC vs. "sorbed” OH- stoichiometry. 651
652
5. CONCLUSIONS
653 654
The present study focuses on the modification to the hydration state occurring in Ca-655
SWy-2 montmorillonite as a function of pH. Under acidic conditions, a transition from bi-656
hydrated to mono-hydrated state was observed, occurring as the result of a H3O+-for-Ca2+ 657
exchange in the smectite interlayer. XRD profile modelling was successfully applied to 658
determine the proportion of the different layer types in the reacted samples, even for 659
extremely heterogeneous hydration states. The proportion of layers obtained was consistent 660
with that derived from chemical modelling, confirming the latter results and demonstrate the 661
ability of these two independent methods to accurately characterise chemical/structural 662
modifications in smectite interlayers. In addition, the exchange between Ca2+ cations and 663
H3O+ ions has been shown to occur as a layer-by-layer process, taking place randomly in the 664
layer stack. 665
Under high-pH conditions, the possible presence of CaOH+ ion pairs in the smectite 666
interlayer is proven to be false from results obtained both by XRD profile modelling and by 667
NIR-DR spectroscopy. As a consequence, the apparent increase in Ca sorption and the 668
decrease in Si concentration occurring under high-pH conditions probably result most likely 669
from the precipitation of a CSH phase, which is thermodynamically favoured. 670
671
Acknowledgements – The results presented in the present article were collected during a Ph.D.
672
thesis granted by ANDRA (French National Agency for Nuclear Waste Disposal). ANDRA is 673
thanked for its permission to publish this manuscript, and the authors acknowledge its 674
financial support. The French Geological Survey (BRGM) is acknowledged for its editorial 675
financial support. EF is grateful to Pr. Boris A. Sakharov for fruitful discussions during XRD 676
profile modelling. The manuscript was improved by the constructive reviews of two 677
anonymous reviewers and AE Garrison Sposito, and by the remarks of Emmanuel Jacquot on 678
an early version of the manuscript. 679
REFERENCES
680 681
Appelo, C.A.J. and Postma, D. (2000) Geochemistry, Groundwater and Pollution, Rotterdam 682
press, 536pp. 683
Baeyens, B. and Bradbury, M.H. (1997) A mechanistic description of Ni and Zn sorption on 684
Na-montmorillonite. Part I: Titration and sorption measurements. J. Contam. Hydrol. 685
27, 199-222. 686
Bérend, I., Cases, J.M., François, M., Uriot, J.P., Michot, L.J., Masion, A. and Thomas, F. 687
(1995) Mechanism of adsorption and desorption of water vapour by homoionic 688
montmorillonites: 2. the Li+, Na+, K+, Rb+ and Cs+ exchanged forms. Clays Clay 689
Miner. 43, 324-336.
690
Bishop, J., Murad, E. and Dyar, M.D. (2002) The influence of octahedral and tetrahedral 691
cation substitution on the structure of smectites and serpentines as observed through 692
infrared spectroscopy. Clay Miner. 37, 361-628. 693
Bradbury, M.H. and Baeyens, B. (1997) A mechanistic description of Ni and Zn sorption on 694
Na-montmorillonite. Part II: modeling. J. Contam. Hydrol. 27, 223-248. 695
Bradley, W.F., Grim, R.E. and Clark, G.F. (1937) A study of the behavior of montmorillonite 696
on wetting. Z. Kristallogr. 97, 260-270. 697
Burneau, A., Barrès, O., Gallas, J.P. and Lavalley, J.C. (1990) Comparative study of the 698
surface hydroxyl groups of fumed and precipitated silicas. 2. Characterization by 699
infrared spectroscopy of the interaction with water. Langmuir 6, 1364-1372. 700
Burneau, A. and Carteret, C. (2000) Near infrared and ab initio study of the vibrational modes 701
of isolated silanol on silica. Phys. Chem. Chem. Phys. 2, 3217-3226. 702
Cases, J.M., Bérend, I., François, M., Serekova, Uriot, J.P., Michot, L.J. and Thomas, F. 703
(1997) Mechanism of adsorption and desorption of water vapour by homoionic 704
montmorillonite: 3. the Mg2+, Ca2+, Sr2+ and Ba2+ exchanged forms. Clays Clay 705
Miner. 45, 8-22.
706
Cesari, M., Morelli, G.L. and Favretto, L. (1965) The determination of the type of stacking in 707
mixed-layer clay minerals. Acta Cryst. 18, 189-196. 708
Charlet, L. and Tournassat, C. (2005) Fe(II)-Na(I)-Ca(II) cation exchange on montmorillonite 709
in chloride medium; evidence for preferential clay adsorption of chloride – metal ion 710
pairs in seawater. Aquat. Geochem. (in press). 711
Claret, F., Bauer, A., Schafer, T., Griffault, L. and Lanson, B. (2002) Experimental 712
Investigation of the interaction of clays with high-pH solutions: a case study from the 713
Callovo-Oxfordian formation, Meuse-Haute Marne underground laboratory (France). 714
Clays Clay Miner. 50, 633-646.
715
Cuadros, J. (1997) Interlayer cation effects on the hydration state of smectite. Am. J. Sci. 297, 716
829-841. 717
Delville, A. (1991) Modeling the clay-water interface. Langmuir 7, 547-555. 718
Drits, V.A. and Sakharov, B.A. (1976) X-Ray structure analysis of mixed-layer minerals. 719
Dokl. Akad. Nauk SSSR, Moscow, 256 pp. 720
Drits, V.A. and Tchoubar, C. (1990) X-ray diffraction by disordered lamellar structures: 721
Theory and applications to microdivided silicates and carbons. Springer-Verlag,
722
Berlin, 371 pp. 723
Drits, V.A., Sakharov, B.A., Lindgreen, H. and Salyn, A. (1997a) Sequential structure 724
transformation of illite-smectite-vermiculite during diagenesis of Upper Jurassic shales 725
from the North Sea and Denmark. Clay Miner. 32, 351-371. 726
Drits, V.A., Srodon, J. and Eberl, D.D. (1997b) XRD measurement of mean crystallite 727
thickness of illite and illite/smectite: reappraisal of the kubler index and the scherrer 728
equation. Clays Clay Miner. 45, 461-475. 729
Elprince, A.M., Vanselow, A.P. and Sposito, G. (1980) Heterovalent, ternary cation exchange 730
equilibria: NH4+-Ba2+-La3+ exchange on montmorillonite. Soil Sci. Soc. Am. J. 44, 731
964-969. 732
Ferrage, E., Lanson, B., Sakharov, B.A. and Drits, V.A. (2005a) Investigation of smectite 733
hydration properties by modeling of X-ray diffraction profiles. Part 1. Montmorillonite 734
hydration properties. Amer. Mineral., (accepted). 735
Ferrage, E., Lanson, B., Sakharov, B.A., Jacquot, E., Geoffroy, N. and Drits, V.A. (2005b) 736
Investigation of smectite hydration properties by modeling of X-ray diffraction 737
profiles. Part 2. Influence of layer charge and charge location, (in preparation). 738
Ferrage, E., Tournassat, C., Rinnert, E., Charlet, L. and Lanson, B. (2005c) Experimental 739
evidence for calcium-chloride ion pairs in the interlayer of montmorillonite. A XRD 740
profile modelling approach. Clays Clay Miner. (accepted). 741
Fletcher, P. and Sposito, G. (1989) The chemical modeling of clay/electrolyte interactions for 742
montmorillonite. Clay Miner. 24, 375-391. 743
Gilbert, M. and Laudelout, H. (1965) Exchange properties of hydrogen ions in clays. Soil Sci. 744
100, 157. 745
Glaeser, R. and Méring, J. (1954) Isothermes d'hydratation des montmorillonites bi-ioniques 746
(Ca, Na). Clay Mineral. Bull. 2, 188-193. 747
Guinier, A. (1964) Théorie et technique de la radiocristallographie. Dunod, Paris, 740 pp. 748
HATCHES (1998) Harwell/Nirex thermodynamic database for chemical equilibrium studies. 749
Howard, S.A. and Preston, K.D. (1989) Profile fitting of powder diffraction patterns. Pp. 217-750
275 in: Modern Powder Diffraction (D.L. Bish and J.E. Post, editors). Reviews in 751
Mineralogy 20, Mineralogical Society of America, Wahington D.C. 752
Iwasaki, T. and Watanabe, T. (1988) Distribution of Ca and Na ions in dioctahedral smectites 753
and interstratified dioctahedral mica/smectites. Clays Clay Miner. 36, 73-82. 754