HAL Id: hal-00304753
https://hal.archives-ouvertes.fr/hal-00304753
Submitted on 1 Jan 2003HAL is a multi-disciplinary open access archive for the deposit and dissemination of sci-entific research documents, whether they are pub-lished or not. The documents may come from teaching and research institutions in France or abroad, or from public or private research centers.
L’archive ouverte pluridisciplinaire HAL, est destinée au dépôt et à la diffusion de documents scientifiques de niveau recherche, publiés ou non, émanant des établissements d’enseignement et de recherche français ou étrangers, des laboratoires publics ou privés.
waterbalance components and hydraulic properties of
peat soils
K. Schwaerzel, H. P. Bohl
To cite this version:
K. Schwaerzel, H. P. Bohl. An easily installable groundwater lysimeter to determine waterbalance components and hydraulic properties of peat soils. Hydrology and Earth System Sciences Discussions, European Geosciences Union, 2003, 7 (1), pp.23-32. �hal-00304753�
An easily installable groundwater lysimeter to determine water balance components and hydraulic properties of peat soils Hydrology and Earth System Sciences, 7(1), 23–32 (2003) © EGU
An easily installable groundwater lysimeter to determine water
balance components and hydraulic properties of peat soils
Kai Schwaerzel
1and Heiko P. Bohl
21Institute of Ecology, Department of Soil Sciences and Soil protection, Technical University of Berlin, Salzufer 11-12, 10587 Berlin, Germany 2CSIROLand and Water, Davies Laboratory Townsville, PMB PO AitkenvaleQLD 4814, Australia
Email for corresponding author: [email protected]
Abstract
A simple method for the installation of groundwater lysimeters in peat soils was developed which reduces both time and financial effort significantly. The method was applied on several sites in the Rhinluch, a fen peat land 60 km northwest of Berlin, Germany. Over a two-year period, upward capillary flow and evapotranspiration rates under grassland with different groundwater levels were measured. The installation of tensiometers and TDR probes additionally allowed the in situ determination of the soil hydraulic properties (water retention and unsaturated hydraulic conductivity). The results of the measurements of the unsaturated hydraulic conductivity demonstrate that more than one single method has to be applied if the whole range of the conductivity function from saturation to highly unsaturated is to be covered. Measuring the unsaturated conductivity can be done only in the lab for an adequately wide range of soil moisture conditions.
Keywords: peat soils, soil hydraulic properties, evapotranspiration, capillary flow, root distribution, unsaturated zone
Introduction
Intensive grazing and/or grassland utilisation in the former GDR has triggered severe soil/peat degradation processes in the northeast German fens. As a result the landscape function has changed from a sink to a source of nutrients and organic components (in water and the gaseous phase), which is of major environmental concern.
Due to economic changes after German reunification where there was less demand for agricultural products, there was an opportunity to change the intensive grassland utilisation to a more environmentally friendly land use. Since peat degradation is driven by the level of groundwater, the primary goal for the development and conservation of the northeast German fens is to revise the water allocation scheme. To achieve this, the water demand of these soils for different groundwater levels and soil moisture conditions needs to be known.
The key parameter for this is the determination of evapotranspiration (ETact). From the technical point of view the water balance components like precipitation and runoff
can easily be measured, however the quantification of ETact on soils with shallow groundwater tables is not sufficiently solved (Ingram 1983). Micrometeorological and lysimeter studies of the measurement of evapotranspiration have been accomplished by several authors (Gilman, 1994; Campell and Williamson, 1997; Kelemen and Ingram, 1999). However, a detailed investigation of the unsaturated zone is not usually done in most wetland studies (Bradley and Gilvear, 2000). In contrast to mineral soils, knowledge of the unsaturated zone of wetlands and the soil hydraulic properties of peat is unsatisfactory. This lack of information is a limitation of existing models of water and solute transport in fen peats (Baird, 1997).
The objective of this study was to develop a new lysimeter to determine the water balance for studies of the unsaturated zone. These lysimeters should be easy to install with minimal technical and financial effort. Moreover, they should allow the in situ determination of the hydraulic properties (water retention and hydraulic conductivity).
Materials and methods
STUDY AREA
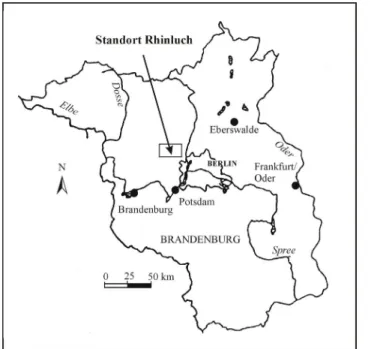
The study area, the Rhinluch, is about 60 km northwest of Berlin, Germany, in the Havelland basin, a fen area of about 87000 hectare (Fig. 1). The Rhinluch has been drained for more than 250 years and this was intensified in the seventies when a dense network of open ditches and subsurface perforated pipes was created. From the seventies until the collapse of the communist regime of the GDR, the utilisation was very intensive. To enable trafficability, the water table of the site was lowered to 100 cm below the surface during the growing period. The land use is now a more extensive hay crop.
The peat formation in the Rhinluch took place under the influence of paludification (swamp formation). The process of terrestrialisation was of minor importance. The average thickness of the peat is 120 cm. Glacifluvial sands (mostly fine sand) and limnic sediments such as detritus- or calcareous mud underly the peat (Zeitz, 1993). The upper peat layers are strongly decomposed and altered pedogenically because of the intensive land use and drainage. Humified (the German peat classification calls it ‘earthified’) and very humified (the German peat classification calls it ‘very earthified), peat soils can be found mostly on the surface. The characteristics of these topsoils are shown in Table 1.
The deeper layers are dominated by sedge- (Carex) and reed-peats (Phragmites) or a mixture of both (Table 2). Vegetation at the study site is dominated by reed canary-grass (Phalaris arundinacea).
The climatic characteristics of the region are an average annual temperature of 8.1°C, an average annual precipitation of 526 mm and an average annual grass evaporation of 600 mm. The Rhinluch is one of the low precipitation areas in Germany. The water balance (precipitation minus grass reference evaporation) for the summer months from April to October is negative (about –170 mm, 1993–1997).
Table 1. Definition of topsoil horizon of drained fen (AG Boden 1994), more details is given by Schwärzel et al., 2002.
nHm Strongly earthified horizon Topsoil horizon of intensive drained peatlands and with an intensive tillage action, strongly earthified; high degree of decomposition, when dry: very fine granular structure (dusty), high water repellency
nHv Earthified horizon Topsoil horizon of drained mires; poorly to moderately earthified by aerobe mineralization
and humification, crumb or fine subangular structure
nHa Aggregate horizon Subsoil-horizon, coarse to fine angular blocky structure caused by shrinkage and swelling
processes
nHt Shrinkage horizon Subsoil-horizon, vertical cracks and coarse prismatic structure caused by shrinkage
nHr Peat horizon Permanently below the ground –or perched water-Table and preserved in a reduced state
Table 2. Soil profile of the site (Follic Histosol)
Depth Horizon Kind of peat Degree of
(dm) decomposition (acc. to Post) 2.9 nHv Earthified peat 5.3 nHa Reed-Sedge-peat 6–7 7.5 nHt Reed-Sedge-peat 5 >7.5 nHr Reed-Sedge-peat 3
An easily installable groundwater lysimeter to determine water balance components and hydraulic properties of peat soils
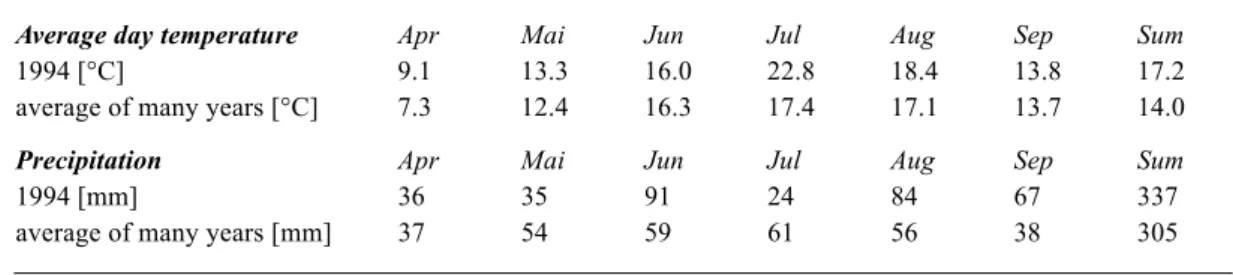
In Table 3, the monthly precipitation and average daily temperature of the measurement period are compared with the 30-year average (1951-1980) measured at the weather station Neuruppin (Meteorological Service of the GDR).
The growing season 1994 was clearly warmer and wetter than the long-term average. Despite the fact that the precipitation was above average, there was a drought from the beginning of July to the middle of August when exceptionally high temperatures were observed. The long-term average temperature was exceeded by 5.6 degrees Celsius in July.
Figure 2 provides a survey of the groundwater regime and the precipitation at the site during the growing season. Sixty days into the experiment, the water table was on average 35 cm below surface. A short-term rise in the groundwater level at the site was caused by the high precipitation at the end of June. In the subsequent drought period, the groundwater level at the site dropped within 40 days from 20 to 80 cm below the surface. Because of the high precipitation (approx. 100 mm) between 11th of August and 8th of September, the peat body was rewetted by the infiltrated water. Simultaneously, the water level in the ditch and also at the site increased considerably.
FIELD METHODS
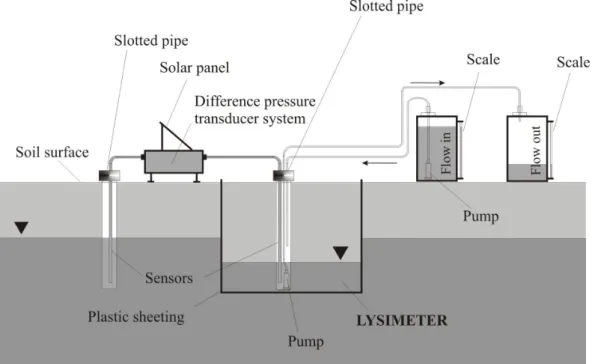
The water balance (in particular ETact and capillary rise) was determined using a groundwater lysimeter. In contrast to conventional lysimeters, these newly developed lysimeters were easy to install with minimal technical and financial effort. The basic principal was wrapping up an undisturbed soil monolith (a cube) in plastic sheeting under field conditions. The monolith volume was close to 1m3
(1m depth/ 0.9 m2 area). Two mm thick robust waterproof
plastic sheeting was used as wrapping material.
Figure 3 demonstrates schematically the three steps of the installation. Firstly, trenches were dug at two sides of the cube until the required depth was reached. The trenches were then connected via a tunnel at the base of the cube and the previously rolled up plastic sheeting was inserted (Fig. 3.1). The tunnel was successively enlarged horizontally, while simultaneously unrolling the plastic sheet until the complete base of the cube was covered. The gap between sheet and peat material was refilled with sand to support the monolith. Secondly, the trenches were backfilled using the original peat material, with the ends of the plastic sheet raised to above ground level (Fig. 3.2). Finally, trenches were dug at the remaining sides of the cube. The sheets
-120 -80 -40 0 120 150 180 210 240 270 Julian day Groundwater level [cm] 0 15 30 45 Precipitation [mm]
Groundwater level Precipitation
Table 3. The average day temperature and monthly precipitation of 1998 and of the average of many years (1951-1980) of the weather station Neuruppin (Meteorological Service of the GDR).
Average day temperature Apr Mai Jun Jul Aug Sep Sum
1994 [°C] 9.1 13.3 16.0 22.8 18.4 13.8 17.2
average of many years [°C] 7.3 12.4 16.3 17.4 17.1 13.7 14.0
Precipitation Apr Mai Jun Jul Aug Sep Sum
1994 [mm] 36 35 91 24 84 67 337
average of many years [mm] 37 54 59 61 56 38 305
were recovered and unrolled until all sides of the cube were covered and the trenches backfilled (Fig. 3.3). The end of the plastic sheeting was fixed to wooden slats, dug in outside of the lysimeter. The groundwater level of the site was approx. 50 cm below the surface during the installation of the lysimeter and thus it was necessary to dewater the trenches.
Additionally, fully automated tensiometer and TDR probes (Easy Test 1993) were installed (horizontal installation of two replicates at 10, 20, 30, 40, 50, 60, 70, 80 and 90 cm depth) for the determination of soil hydraulic properties (water retention and unsaturated hydraulic conductivity). The TDR readings were translated into water-content values. A third-order polynomial was fitted to the observed relationships between ε (dielectric constant) and Θ (water content) for peat soils at the site (standard error of calibration = 2.2 Vol. %):
Θ = 3.93 · 10–2 + 2.84 · 10–2 · ε – 4.19 · 10–4 · ε2
+ 2.77 · 10–6 · ε3 (1)
Groundwater level monitoring in both the lysimeter and the surrounding soil was carried out using slotted PVC pipes connected via a flexible tube to a differential pressure transducer (176PC28 HONEYWELL with a precision = 1 hPa) (Fig. 4). Following the measuring principle of Feddes (1971), the water level in the lysimeter was either adjusted to the surrounding groundwater level (reference level) or set to a fixed depth. Level/pressure differences recorded by the control unit either triggered the bilge pump in the lysimeter pipe or released a valve in a supply water container topping up the water level in the lysimeter. The volume of water added or removed was measured by recording the water level differences in the containers. The hysteresis of groundwater regulation amounts to maximal 2 cm. Fig. 3. Principle of lysimeter installation
Fig. 4. Experimental set up for the determination of capillary rise and evapotranspiration q = Groundwater level
An easily installable groundwater lysimeter to determine water balance components and hydraulic properties of peat soils
Evapotranspiration (ETact) was calculated using Eqn. (2):
[
]
dz
dt
t
dt
Q
P
dt
ET
act t2 t1 t2 t1 B 0 t2 t1∫
=
∫
+
−
∫∫
∂
∂
Θ
(2) Where P = Precipitation [mm]Q = Net flow in the lysimeter to hold the groundwater level inside to the surrounding groundwater level [mm]
Θ = Water content/ soil moisture [mm] t = Time (d)
z = depth (cm)
B = Bottom of the lysimeter (cm)
In soils influenced by groundwater, the soil moisture condition in the root zone is dependent on the water uptake of plants, on the precipitation/ irrigation and the upward capillary flow into the root zone. The amount of water available for plants in such soils is the sum of water stored in the root zone plus the amount of water delivered via upward capillary flow from below the root zone and the groundwater zone. The driving force for the capillary rise from the groundwater to the root zone is the hydraulic gradient. At a given gradient the rate of upward capillary flow is dependent on the unsaturated hydraulic conductivity. Thus, a steep drawdown should reduce the upward capillary flow and therewith the evapotranspiration.
When ETact and the soil moisture change of the root zone is known, the upward capillary flow q in the root zone can be calculated (Zr = depth of root zone):
dt
dz
t
dt
P
-
ET
dt
q
act t2 t1 t2 t1 Z 0 t2 t1 t2 t1 r∫
=
∫
∫
−
∫∫
∂
∂
Θ
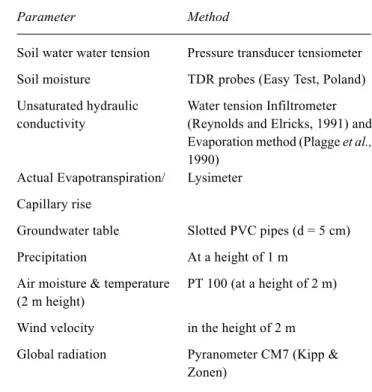
(3)Table 4 provides an overview of field parameters and applied methods.
LABORATORY METHODS
Each horizon was sampled to determine water retention as well as saturated and unsaturated hydraulic conductivity. The water retention curve was determined using 100 cm3
cores (four replications). The dewatering process (desorption) used ceramic plates connected to a hanging water column up to pF 2,0. From pF 2.2 a pressure apparatus (soil moisture) was used. In the course of establishing a water retention curve, the peat shrinkage after each pressure level was quantified by measurement with callipers. Schwärzel et al., 2002 showed that the shrinkage can be negligible under field conditions. The determination of the
unsaturated conductivity was carried out in three replications (237 and 550 cm3 cores) using an evaporation method
(Plagge et al., 1990).
Results and discussion
WATER RETENTION AND UNSATURATED HYDRAULIC CONDUCTIVITY
Soil hydraulic properties are important input parameters for water/solute transport models (Letts et al., 2000; Bradley and Gilvear, 2000; Wessolek et al., 2002). Conventionally, these parameters are either estimated (van Genuchten, 1980) or determined by laboratory methods. However, to achieve maximum accuracy in the model predictions, in situ measurements are highly desirable because laboratory and field measurements can differ significantly as shown by Royer and Vachaud (1975) for mineral soils. Very few data on in situ measurements of hydraulic properties of peat soils have been reported (Schouwenaars and Vink, 1992; Baird, 1997; Schlotzhauer and Price, 1999).
It is an additional advantage that the methodology presented allows in situ measurements of water retention and unsaturated hydraulic conductivity. To achieve this, the vegetation cover at one lysimeter was removed during the summer and equipped with roofing for rain protection. The lysimeter/monolith was fully saturated (groundwater level Table 4. Field parameters
Parameter Method
Soil water water tension Pressure transducer tensiometer
Soil moisture TDR probes (Easy Test, Poland)
Unsaturated hydraulic Water tension Infiltrometer
conductivity (Reynolds and Elricks, 1991) and
Evaporation method (Plagge et al., 1990)
Actual Evapotranspiration/ Lysimeter
Capillary rise
Groundwater table Slotted PVC pipes (d = 5 cm)
Precipitation At a height of 1 m
Air moisture & temperature PT 100 (at a height of 2 m) (2 m height)
Wind velocity in the height of 2 m
Global radiation Pyranometer CM7 (Kipp &
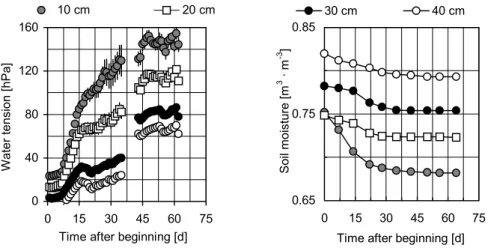
O) and the water level regulation was disabled by disconnecting the control unit (see Fig. 4). Consequently, the monolith underwent a drying cycle similar to an instantaneous evaporation experiment for the determination of unsaturated conductivity in the laboratory. An example of water tension and water content during one of the drying cycles is shown in Fig. 5.
It took about a week until a sharp increase in water tensions occurred. This indicates that the water evaporating from the top of the monolith was replaced from deeper layers. Hence, the hydraulic conductivity in the range of low saturation (low tension) had to be relatively high. The top layers then continued to dry out.
The evaporation rate decreased from 1.1 mm d–1 at the
beginning of the experiment to less than 0.35 mm d–1 after
35 days. In the later phases of the experiment (day 45-63) very small changes in water tension and water content were recorded, which showed that only negligible volumes of water were evaporating. At this stage, the top layer was air
dry with low conductivity, which was assumed to be the limiting factor for further evaporation.
Based on the data from Fig. 5, the unsaturated conductivity was calculated for the depths 10–20 cm and 20–30 cm (Fig. 6) which additionally includes data from a drying cycle determined with the same set-up (same site) in the summer of the following year. Since the conductivity curves showed good agreement between the years (Fig. 6), it is considered that reproducible, reliable results can be achieved with the method presented. A comparison of these conductivity values with conductivities determined with a tension-infiltrometer (Reynolds and Elricks, 1991) and an evaporation laboratory method (Plagge, 1991) showed relatively good agreement for the depth of 10 to 20 cm (Fig. 7).
Due to limited evaporation in the later stages of the experiment, only very small changes in water tension and water content were monitored in the deeper layers. The resultant hydraulic gradients were too small (within the error
0.65 0.75 0.85
0 15 30 45 60 75
Time after beginning [d]
Soil moisture [m 3 · m -3 ] 30 cm 40 cm 0 40 80 120 160 0 15 30 45 60 75
Time after beginning [d]
Water tension [hPa]
10 cm 20 cm
Fig. 5. Water tension and soil moisture during instantaneous evaporation of a lysimeter to determine water retention and unsaturated hydraulic conductivity (Lysimeter without vegetation)
10 to 20 cm Depth 1.E-03 1.E-02 1.E-01 1.E+00 1.E+01 1 10 100 1000
Water tension [hPa]
K [cm · d -1 ] 20 to 30 cm Depth 1.E-03 1.E-02 1.E-01 1.E+00 1.E+01 1 10 100 1000
Water tension [hPa]
K [cm · d
-1 ]
Fig. 6. Hydraulic conductivity (K) of a fen peat soil determined in 2 depths in 2 years (black circle first year, withe circle second year)
An easily installable groundwater lysimeter to determine water balance components and hydraulic properties of peat soils 1.E-6 1.E-4 1.E-2 1.E+0 1.E+2 1 10 100 1000
Water tension [hPa]
Hydraulic conductivity [cm d
-1 ]
Lab
Field: instantaneus Field: tensions-infiltrometer
Fig. 7. Hydraulic conductivity function for an earthified peat horizon determined with laboratory and field methods (dots: measured data; curve: Mualem-van Genuchten parameterisation (van Genuchten 1980))
of measurement) to calculate conductivity values.
In addition to the measurements, the parameterisations of the unsaturated hydraulic conductivity are presented. These were obtained by fitting the Mualem-van Genuchten model to the measured values (van Genuchten, 1980); here each data set was fitted separately. The results demonstrate that more than one method has to be applied if the whole range of the conductivity function from saturation to highly unsaturated is to be covered. It can be concluded from Fig. 7 that measuring the unsaturated conductivity can be done only in the lab for an adequately wide range of soil moisture conditions. Furthermore, at higher water tension, the fitted curves of the tension-infiltrometer and the lab measurements differ by more than two orders of magnitude. The parameterisation of conductivity values determined with the tension-infiltrometer leads to an increase in uncertainty of the hydraulic conductivity at drier soil conditions. This is
particularly significant with regard to modelling unsaturated processes within wetlands at deeper groundwater levels.
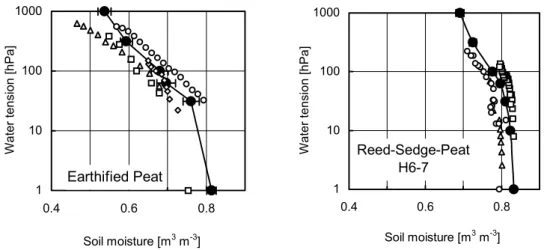
The water retention curves for two horizons established in the laboratory are compared with those obtained from field values from four lysimeters (Fig. 8). The field values were recorded in the first course of desorption in spring and early summer. The cases featured in Fig. 8 show only minor deviations between laboratory and field retention curves, an average of less than 4% vol. The field values basically follow the laboratory curves satisfactorily. Consequently, the TDR measurements are reliable. The reduction in volume of the organic substrate which isolates the TDR sensors from the soil matrix (Bradley and Gilvear, 2000) was not observed under field conditions. The findings show that the change in water storage and soil moisture can be predicted from the TDR measurements.
UPWARD CAPILLARY FLOW
Capillary flow rates as a function of grass reference evapotranspiration (Allen et al., 1994) for a lysimeter with a groundwater level of 40 cm are presented in Fig. 9. Interestingly, capillary rise rates determined with the lysimeter were mostly higher than evaporation rates calculated by the approach of Allen et al., 1994.
The highest rise rates were determined during periods of high evaporative demand and high levels of soil moisture. In some instances, the water volume transported via capillary rise was independent of the evaporative demand of the atmosphere, due to static flow regimes. The capillary rise was time delayed when a period of high potential evapotranspiration was followed by a period of low evaporation and vice versa. The capillary rise stopped during some rainfall events. In these cases, the plant water demand
Earthified Peat 1 10 100 1000 0.4 0.6 0.8 Soil moisture [m3 m-3]
Water tension [hPa] Reed-Sedge-Peat
H6-7 1 10 100 1000 0.4 0.6 0.8 Soil moisture [m3 m-3]
Water tension [hPa]
was supplied directly by precipitation infiltrating the root zone. Moreover, the weak relationship between capillary flow rate and grass reference evapotranspiration could be caused by small fluctuations in groundwater during the measurement interval.
EVAPOTRANSPIRATION
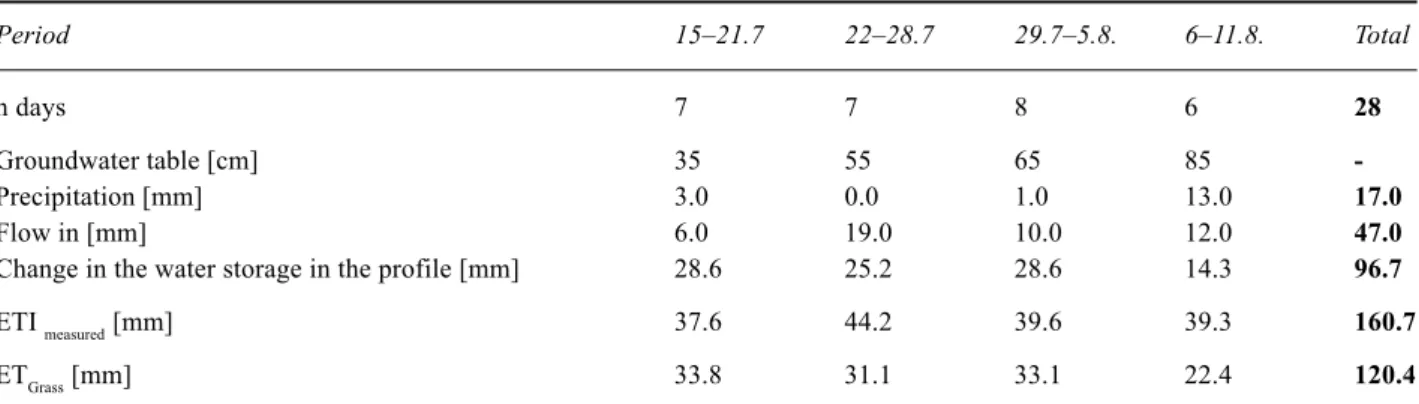
Table 5 lists amounts of precipitation, lysimeter net inflow and water taken from the soil water supply for a monitoring period of four weeks. During this period, the groundwater level in the lysimeter was continuously adjusted to the surrounding level. Table 5 also shows the measured evapotranspiration and additional values calculated using
the approach of Allen et al., 1994. These values are often much lower than those measured. This is surprising because this technique does not take into account the changing roughness of a crop/grassland during a vegetative period.
Over the total monitoring period, 161 mm was lost through evapotranspiration. During that time 47 mm was added to the lysimeter to adjust the water level to that of the surrounding groundwater table. Hence, about one-third of the water evaporated was groundwater, so that the water balance of the site was strongly negative during the monitoring period.
The groundwater level dropped from 35 cm to around 85 cm below surface. Water that was taken from the root zone could not be replaced due to a decrease in capillary rise. The monolith started to dry, water was delivered increasingly via upward capillary flow from the deeper layers of the profile to the root zone.
The vertical water flows could be separated into total vertical flow, capillary flow and flow through roots. The hydraulic gradients
z H
∂
∂ were calculated from the measured
water tensions.
The conductivity values related to the measured soil moisture were derived from the hydraulic conductivity functions, which were determined for the horizons by different methods (see above). The capillary flow q was then calculated using Darcy’s law:
( )
Hz K q ∂ ∂ ⋅ Θ − = (4)The total vertical flow was calculated by summing precipitation P, soil water content Θ changes at the different depths z (compartments) and lysimeter inflow/outflow Q. The water flow through the roots q Root at each depth was calculated as the difference between total vertical flow and capillary flow (Rijtema, 1965; Rose and Stern, 1967; Feddes, 1971; Ehlers, 1975; Strebel et al., 1975):
Groundwater depth: 40 cm 1:1-Line 0.0 2.0 4.0 6.0 0.0 2.0 4.0 6.0 Reference Evapotranspiration [mm d-1]
Upward capillary flow [mm d
-1 ]
Fig. 9. Upward capillary flow and grassland reference
evapotranspiration (Allen et al. 1994) for a lysimeter with constant water level of 40 cm (3 and 7 days monitoring intervals)
Table 5. Water balance components for a monitoring period of four weeks ETGrass = Grass reference Evapotranspiration after Allen et al., 1994
Period 15–21.7 22–28.7 29.7–5.8. 6–11.8. Total
n days 7 7 8 6 28
Groundwater table [cm] 35 55 65 85
-Precipitation [mm] 3.0 0.0 1.0 13.0 17.0
Flow in [mm] 6.0 19.0 10.0 12.0 47.0
Change in the water storage in the profile [mm] 28.6 25.2 28.6 14.3 96.7
ETI measured [mm] 37.6 44.2 39.6 39.3 160.7
An easily installable groundwater lysimeter to determine water balance components and hydraulic properties of peat soils
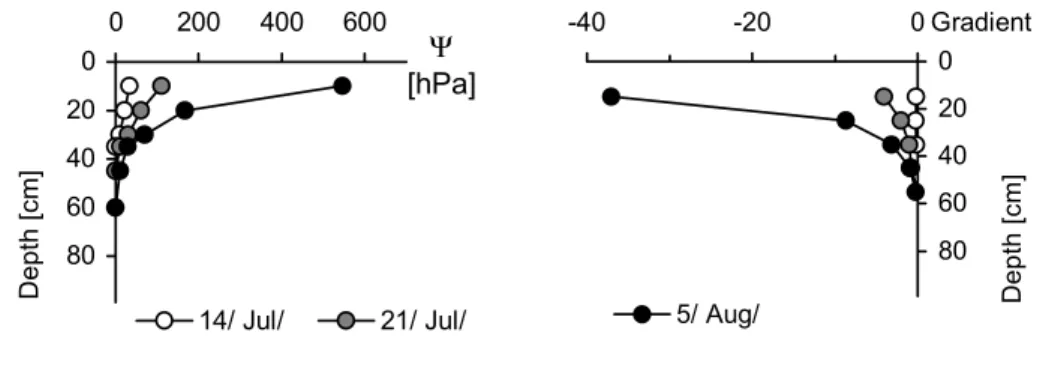
(5) Water tension distribution and related hydraulic gradients during a dry summer period (see Table 5) are presented in Fig. 10.
A sharp increase in water tension, observed within the first three weeks, resulted in increasing hydraulic gradients.
The vertical water flows (total flow, capillary flow and flow through the roots) are presented in Fig. 11. The average total flow (= evapotranspiration) over the period of four weeks was about 6 mm d–1. During this time, the water
uptake by the plant was restricted mainly to the upper 20 cm of the profile. At the beginning of the experiment (water level depth around 35 cm), the plant extracted preferentially from the top compartment (0-10), whereas in the later stages water was increasingly taken up from the depth 10 to 20 cm. 0 20 40 60 80 0 200 400 600 Ψ [hPa] Depth [cm] 14/ Jul/ 21/ Jul/ 0 20 40 60 80 -40 -20 0 Gradient Depth [cm] 5/ Aug/
Fig. 10. Water tension distribution and hydraulic gradients in the lysimeter during a dry summer period (vegetation: Phalaris arund.)
29.7. to 5.8. 0 20 40 60 80 0.0 4.0 [mm day-1] Depth [cm] 6.8. to 11.8. 0 20 40 60 80 0.0 4.0 [mm day-1] Depth [cm] 14.7. to 21.7. 0 20 40 60 80 0.0 4.0 [mm day-1] Depth [cm] q total q capillar q Root 22.7. to 28.7. 0 20 40 60 80 0.0 4.0 [mm day-1] Depth [cm]
Fig. 11. Vertical water flows (total flow, capillary flow and flow through the roots) on a weekly basis Lysimeter, Vegetation: Phalaris arund.,T = Groundwater level
∫
− 2 1 ) , ( t t dt t z q(
)
∫ ∫
∫
∫ ∫
∂ Θ ∂ + + = 0 2 1 2 1 0 2 1 z t t t t z t t Root dt dz t dt Q P dt dzq
The results show that the capillary flow drops successively as the water contents in the root zone are reduced. At soil moistures around the wilting point, no measurable capillary flow occurred. Hence, the evaporation at the bare soil surface was close to zero.
Knowledge of plant water uptake in depth and time allows spatial information about the root distribution to be derived. In the case presented (Fig. 11), it can be assumed that most of the root zone is located between 0 and 20 cm depth. This information is valuable if numeric models are to be applied for water balance/solute transport investigations.
Conclusions
The lysimeter method presented here enabled water balance components at different groundwater levels to be determined, as well as the soil hydraulic properties of fen peat soils. This information is important as input for, validation of, and development of water balance and solute transport models and, therefore, for the development of recommendations for environmentally friendly land use strategies for fen peat lands (Renger et al., 2002).
Acknowledgement
The German Research Association (Deutsche Forschungsgemeinschaft DFG) is thanked for the financial support of this work. This study was developed within the scope of the DFG research group “.
References
Allen, R.G., Smith, M. , Perrier, A. and Pereira, L.S., 1994. An update for definition of reference evapotranspiration. ICID
Bulletin 43, 1–34.
Baird, A.J., 1997. Field estimation of macropore functioning and surface hydraulic conductivity in a fen peat. Hydrol. Process.,
11, 287–295.
Bradley, C. and Gilvear, D.J., 2000. Saturated and unsaturated flow dynamics in a floodplain wetland. Hydrol. Process., 14, 2945–2958.
Campbell, D.I. and Williamson, J.L., 1997. Evaporation from a raised peat bog. J. Hydrol., 193, 142–160.
EASY TEST, 1993. Product information: Easy Test soil moisture/
salinity catalogue. Easy Test Ltd., Solarza 8b, 20-815 Lublin
56, PO Box 24, Poland.
Ehlers, W., 1975. Einfluss von Wassergehalt, Struktur und Wurzeldichte auf die Wasseraufnahmerate von Weizen auf Löß-Parabraunerde. Mitt. Dtsch. Bodenkdl. Ges., 22, 141–156.
Feddes, R.A., 1971. Water, heat and crop growth. Proefschrift. Wageningen, the Netherlands.
Gilman, K., 1994. Hydrology and wetland conservation. Wiley, Chichester, UK.
Ingram, H.A.P., 1983. Hydrology. In: Mires: Swamp, Bog, Fen
and Moor, general studies, A.J.P. Gore (Ed.). Elsevier,
Amsterdam, 67–158.
Letts, M.G., Roulet, N.T., Comer, N.T., Skarupa, M.R. and Verseghy, D.L., 2000. Parametrization of peatland hydraulic properties for the Canadian Land Surface Scheme.
Atmosphere-Ocean, 38, 141–160.
Kelemen, J. and Ingram, H.A.P., 1999. The use of large bottomless lysimeters in the determination of water balances for a raised mire. Hydrol. Process., 13, 101–111
Plagge, R., Renger, M. and Roth, C.H., 1990. A new labaratory method to quickly determine the unsaturated hydraulic conductivity of undisturbed soil cores within a wide range of textures. J. Plant Nutr. Soil Sci., 153, 39–45.
Renger, M., Wessolek, G., Schwärzel, K., Sauerbrey, R. and Siewert, C., 2002. Aspects of peat conserving and water management. J. Plant Nutr. Soil Sci., 165, 487–493.
Reynolds, W.D. and Elricks, V., 1991. Determination of hydraulic conductivity using a water tension infiltrometer. Soil Sci. Soc.
Amer. J., 55, 633–639.
Rijtema, P.E., 1965. An analysis of actual evapotranspiration. Agricultural research reports no 659, Wageningen, The Netherlands.
Royer, J.M. and Vachaud, G., 1975. Field determination of hysteresis in soil-water characteristics. Soil Sci. Soc. Amer. J.,
39, 221–223.
Rose, C.W. and Stern, W.R., 1967. Determination of withdrawal of water from soil by crop roots as a function of depth and time.
Austr. J. Soil Res., 5, 11–19.
Schlotzhauer, S.M. and Price, J.S., 1999. Soil water flow dynamics in a managed cutover peat field, Quebec: Field and laboratory investigations. Water Resour. Res., 35, 3675–3683.
Schouwenaars, J.M. and Vink, J.P.M., 1992. Hydrophysical properties of peat relicts in a former bog and perspectives for sphagnum regrowth. Int. Peat J., 4, 15–28.
Schwärzel, K., Renger, M., Sauerbrey, R. and Wessolek, V., 2002. Soil physical characteristics of peat soils. J. Plant Nutr. Soil
Sci., 165, 479–486.
Strebel, O., Renger, M. and Giesel, W., 1975. Bestimmung des Wasserentzuges aus dem Boden durch die Pflanzenwurzeln im Gelände als Funktion der Tiefe und der Zeit. .Z. Pfl. Bodenkd.,
136, 61–72.
Van Genuchten, M.Th., 1980. A closed-form equation for predicting the hydraulic conductivity of unsaturated soils. Soil
Sci. Soc. Amer. J., 44, 892–898.
Wessolek, G., Schwärzel, K., Renger, M., Sauerbrey, R. and Siewert, C., 2002. Soil hydrology and CO2 mineralization of peat soils. J. Plant Nutr. Soil Sci., 165, 494–500.
Zeitz, J., 1993. Zustandserfassung und Kartierung der Moorböden
im Niedermoorgebiet Oberes Rhinluch als Grundlage für die Planung von standortangepassten, umweltschonenden Nutzungsformen. MUNR Forschungsbericht, Germany.