HAL Id: hal-00317912
https://hal.archives-ouvertes.fr/hal-00317912
Submitted on 7 Mar 2006
HAL is a multi-disciplinary open access
archive for the deposit and dissemination of
sci-entific research documents, whether they are
pub-lished or not. The documents may come from
teaching and research institutions in France or
abroad, or from public or private research centers.
L’archive ouverte pluridisciplinaire HAL, est
destinée au dépôt et à la diffusion de documents
scientifiques de niveau recherche, publiés ou non,
émanant des établissements d’enseignement et de
recherche français ou étrangers, des laboratoires
publics ou privés.
Dust aerosols over India and adjacent continents
retrieved using METEOSAT infrared radiance Part I:
sources and regional distribution
S. Deepshikha, S. K. Satheesh, J. Srinivasan
To cite this version:
S. Deepshikha, S. K. Satheesh, J. Srinivasan. Dust aerosols over India and adjacent continents retrieved
using METEOSAT infrared radiance Part I: sources and regional distribution. Annales Geophysicae,
European Geosciences Union, 2006, 24 (1), pp.37-61. �hal-00317912�
Annales Geophysicae, 24, 37–61, 2006 SRef-ID: 1432-0576/ag/2006-24-37 © European Geosciences Union 2006
Annales
Geophysicae
Dust aerosols over India and adjacent continents retrieved using
METEOSAT infrared radiance
Part I: sources and regional distribution
S. Deepshikha, S. K. Satheesh, and J. Srinivasan
Centre for Atmospheric and Oceanic Sciences, Indian Institute of Science, Bangalore-560 012, India
Received: 20 January 2005 – Revised: 2 December 2005 – Accepted: 21 December 2005 – Published: 7 March 2006
Abstract. Mineral dust constitutes the single largest contrib-utor to continental aerosols. To accurately assess the impact of dust aerosols on climate, the spatial and temporal distribu-tion of dust radiative properties is essential. Regional char-acteristics of dust radiative properties, however, are poorly understood. The magnitude and even sign of dust radiative forcing is uncertain, as it depends on a number of parameters, such as vertical distribution of dust, cloud cover and albedo of the underlying surface. In this paper, infrared radiance (10.5–12.5 µm), acquired from the METEOSAT-5 satellite (∼5-km resolution), was used to retrieve regional character-istics of dust aerosols for all of 1999. The infrared radiance depression, due to the presence of dust in the atmosphere, has been used as an index of dust load, known as the Infrared Difference Dust Index (IDDI). There have been several stud-ies in the past carried out over the Sahara using IDDI as a measure of dust load. Over the Indian region, however, stud-ies on dust aerosols are sparse. Spatial and temporal vari-ability in dust loading and its regional distribution over var-ious arid and semiarid regions of India and adjacent conti-nents (0–35◦N; 30◦E–100◦E) (excluding Sahara) have been studied and the results are examined along with surface soil conditions (such as vegetation cover and soil moisture). The advantage of the IDDI method is that information on aerosol properties, such as chemical composition or microphysical properties, is not needed. A large day-to-day variation in IDDI was observed over the entire study region, with val-ues ranging from 4 to 22 K. It was observed that dust activ-ity starts by March over the Indian deserts, as well as over deserts of the Africa and Arabian regions. The IDDI reaches maximum during the period of May to August. Regional maps of IDDI, in conjunction with biomass burning episodes (using TERRA satellite fire pixel counts), suggest that large IDDI values observed during the winter months over North-ern India could be due to a possible deposition of black car-bon on larger dust aerosols. The IDDI values have been
Correspondence to: S. K. Satheesh (satheesh@caos.iisc.ernet.in)
compared with another year (i.e. 2003), with a large num-ber of dust storms reported by meteorological departments based on visibility data. During the dry season, the magni-tude of the monthly average IDDI during 2003 was slightly higher than that of 1999. The monthly mean IDDI was in the range from 4 to 9 K over the Indian deserts, as well as over the deserts of Africa and Arabia. The maximum IDDI during a month was in the range from 6 to 18 K. Large IDDI values were observed even over vegetated regions (such as the vegetated part of Africa and central India), attributed to the presence of transported dust from nearby deserts. Keywords. Atmospheric composition and structure (Aerosols and particles; Transmission and scattering of radiation) – History of Geophysics (Atmospheric sciences)
1 Introduction
Soil derived particles are among the largest aerosols with radii ranging from less than 0.1 µm to ∼100 µm (Prospero et al., 1983, 2002; Kaufman et al., 1995; Haywood and Boucher, 2000; Kaufman et al., 2002; Seinfeld et al., 2004). Large particles are present mainly in the source regions but particles in the radius range 0.1–5.0 µm (or even larger) are transported to long distances (∼5000 kms) in the marine at-mosphere (Junge, 1972; Kalu, 1979; Arimoto et al., 1995, 1997; Prospero, 2001, 2003; Satheesh and Srinivasan, 2002; Gong et al., 2003; Prospero and Lamb, 2003; Petit et al., 2005). For example, several investigations over the Atlantic Ocean have observed Saharan dust, even at remote locations in the Atlantic Ocean (Moulin et al., 1998; Prospero et al., 2002; Seinfeld et al., 2004). The measurements of aerosol size distribution and analysis of chemical composition of aerosols over Antarctica have found mineral particles with radii greater than 2 µm of Australian origin (Shaw, 1980; Shaw et al., 1998). Since composition of the soil varies locally, the mineral aerosols derived from soil exhibit high variability in their imaginary part of the refractive index that
38 S. Deepshikha et al.: Dust aerosols over India from METEOSAT infrared radiance – Part I
mainly determines the climate forcing by this type of aerosol (Zender et al., 2003; Ginoux et al., 2001, 2004; Seinfeld et al., 2004; Tegen et al., 2004). The efficiency with which aerosols are produced from deserts varies depending on the soil characteristics at the particular location (Gillette, 1979). By its omnipresence, the desert aerosol can have a sig-nificant impact on the atmospheric radiation (Sokolik et al., 1998; Arimoto, 2001; Tegen et al., 2004). Dust not only scatters but also absorbs solar radiation and also absorbs and emits long wave radiation (Haywood and Boucher, 2000; Satheesh and Ramanathan, 2000). The magnitude and even the sign of direct radiative forcing by dust is uncertain (IPCC, 2001; Seinfeld et al., 2004; Tegen et al., 2004). It depends on a number of parameters, such as the optical properties of dust, its vertical distribution, cloud cover and the albedo of the underlying surface (Heintzenberg et al., 1997; Liao and Seinfeld, 1998; Tanr´e et al., 2001, 2003). Dust aerosols are significant contributors to radiative warming below 500 mb due to short wave absorption (Chen et al., 1995; Mohalfi et al., 1998; Alpert et al., 1998; Miller and Tegen, 1999; Pros-pero, 2003; Prospero and Lamb, 2003). Typically, dust ap-proximately doubles the short wave radiation absorption un-der clear-sky conditions (Tegen and Miller, 1998; Tanr´e et al., 2003). Tegen and Fung (1994) have shown that dust from disturbed soil causes a net cooling at the surface, accompa-nied by an increase in atmospheric heating. Such radiative ef-fects are found to be most pronounced over the desert regions (Mohalfi et al., 1998; Haywood et al., 2001, 2003; Tanr´e et al., 2001; Zhang and Christopher, 2003).
2 Problems in quantification of dust
There are some difficulties involved in remote sensing (us-ing visible wavelengths) of dust over land (Kaufman et al., 1997). Continuous in-situ sampling of dust aerosol is not feasible over desert regions, due to logistical reasons, and hence the number of sites, which can be maintained is limited (Holben et al., 1998). Remote sensing using visible wave-lengths is complicated due to high and varying albedo over the desert, where high dust load is present. Recently, Hsu et al. (2004) has demonstrated that aerosol optical depths can be derived using MODIS data over bright surfaces. Martonchik et al. (2004) has compared MISR derived optical depths with those measured by AERONET sites over the deserts and found good agreement. Dust aerosols are, however, known to be non-spherical in shape. This can cause errors in the remote sensing of dust aerosols from visible wavelengths.
Recent investigations as part of Aerosol Characterization Experiment-Asia (ACE-Asia) have shown that the dust we observe may not be just dust, but it may be dust mixed with other aerosols (Seinfeld et al., 2004). Studies by Parungo et al. (1987) demonstrate that dust particles originating from China’s desert are coated by sulfates or soot after passing through polluted industrial regions downwind of the desert and in contrast, Saharan dust transported over the Atlantic Ocean is often coated by sea salt. Dust particles internally
mixed with soot, sulfates, nitrates or aqueous solutions can have drastically different properties from those at the dust source (Jacobson, 2001; Chandra et al., 2004; Deepshikha et al., 2005). The dust that is transported from East Asia to the Pacific does not absorb as much radiation as the dust from South Asia or the dust from the Sahara Desert (Sein-feld et al., 2004). There are dramatic regional differences in the chemical and optical properties of aerosols (Zender et al., 2003; Ginoux et al., 2004). Part of the complexity in es-timating dust radiative impact arises from the fact that dust sources and sinks are not uniformly distributed (Sokolik et al., 1998; Tegen et al., 2004). Consequently, the dust aerosol has a complex spatial and temporal pattern.
Recent experiments have shown that measurements of dust at various locations alone cannot provide information on its transport and consequent impact over other regions (Seinfeld et al., 2004). To accurately assess the impact of dust aerosols on climate, the spatial and temporal distribution of dust is essential. However, regional characteristics of soil dust pro-duction, and transport and removal processes are less under-stood. Retrieval methods using infrared wavelengths (a tech-nique used in this paper) have proved to be more suitable for studies on dust aerosols (Tanr´e and Legrand, 1991; Legrand et al., 2001; Leon and Legrand, 2003). Using NIMBUS data, Shenk and Curran (1974) have demonstrated that dust can be detected over arid regions using infrared radiance. Subse-quently, Legrand et al. (1983, 1985), using METEOSAT in-frared radiance data, studied dust aerosols over North Africa and Arabia. The studies carried out thereafter have demon-strated the potential of infrared radiance for quantitative es-timates of dust aerosols (Ackerman, 1989; Legrand et al., 1989, 1992, 1994, 2001; Tanr´e and Legrand, 1991; Leon and Legrand, 2003).
In this paper, infrared radiance (10.5-12.5 µm) from the METEOSAT-5 satellite (of European Space Agency – ESA –) has been used (∼5-km resolution) to retrieve dust aerosol characteristics. During the Indian Ocean Experiment (INDOEX), METEOSAT-5 was moved to 66◦E and pro-vided an excellent opportunity to study dust aerosols over India and adjacent continents. The principle behind the re-trieval technique is based on the fact that the presence of dust aerosols reduces the infrared radiance detected by the satel-lite. The radiance depression resulting from the presence of dust in the atmosphere has been used as an index of dust load and is called the Infrared Difference Dust Index (IDDI) (Tanr´e and Legrand, 1991; Legrand et al., 2001). The raw data from METEOSAT (in the form of radiance counts) is converted to InfraRed Brightness Temperature (IRBT), us-ing an inverse Plank Function. The IDDI images were cre-ated from IRBT images to study the regional characteristics of dust following Legrand et al. (2001). The variability of atmospheric dust loading over arid and semiarid regions of India and adjacent continents, such as regions of Africa (ex-cluding Sahara) and Arabia, has been studied.
S. Deepshikha et al.: Dust aerosols over India from METEOSAT infrared radiance – Part I 39
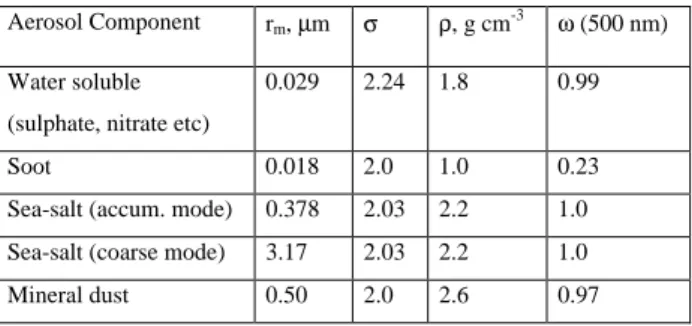
Table 1. Properties of various aerosol components.
Table-1. Properties of Various Aerosol Components
Aerosol Component rm, µm σ ρ, g cm-3 ω (500 nm)
Water soluble (sulphate, nitrate etc)
0.029 2.24 1.8 0.99
Soot 0.018 2.0 1.0 0.23 Sea-salt (accum. mode) 0.378 2.03 2.2 1.0
Sea-salt (coarse mode) 3.17 2.03 2.2 1.0 Mineral dust 0.50 2.0 2.6 0.97
3 Detection of dust using infrared radiance: data and analysis
As the dust aerosol load (often represented by dust optical depth) increases, there is a consequent reduction in short wave solar radiation reaching the surface. This is due to the combined effect of scattering and absorption. Similarly, there is a reduction in the Outgoing Long Wave radiation (OLW) at the top of the atmosphere (TOA) because of the absorp-tion due to dust. When the dust aerosol optical depth in-creases from zero to 1.0, the consequent reduction in OLR is around 30 W m−2(Satheesh et al., 2005). Here, the desert aerosol model described in Hess et al. (1998) and Kaufman et al. (2001) was used to estimate the radiative impact of dust to long wave radiation.
To examine the impact of dust aerosols and other aerosol species on infrared radiation, sensitivity analysis has been carried out. Here, a four-component aerosol system, consist-ing of mineral dust, sea salt, soot and sulphate, was consid-ered. The optical properties of different aerosol species are obtained from Hess et al. (1998) and Kaufman et al. (2001). The physical properties, such as mode radii (rm), standard
deviation (σ ) and density (ρ), and optical properties, such as single scattering albedo (ω) of the individual aerosol compo-nents, are shown in Table 1. We have shown in Fig. 1 the optical depth at 0.5 µm and 11 µm, due to various aerosol species. When the dust optical depth at 0.5 µm is 1.0, the dust optical depth in IR (at 11 µm) is around 0.33, which is higher than all other species. The second highest contribu-tor to infrared optical depth is sea salt, which has an optical depth of 0.06 at 11 µm, which is much lower compared to dust optical depth. Sulphate and soot have much lower opti-cal depths at 11 µm. This demonstrates that the mineral dust is the only aerosol species over land regions, which can in-fluence the infrared radiation significantly. Over ocean, sea salt (though the effect is an order of magnitude smaller than dust) also contributes to the reduction in OLR. Aerosol op-tical depths measured over India are typically in the range from 0.2 to 0.7, and the black carbon mass fraction is in the range of 10 to 15% (Moorthy et al., 2005). The black car-bon mass concentration during daytime is typically 2 µg m−3 over Southern India and 6 µg m−3over Northern India (Tri-pathi et al., 2005).
Fig. 1. Influence of various types of aerosols to infrared radiation,
demonstrating that dust aerosols are the most sensitive to infrared.
Mineral dust particles constitute the largest aerosols over land. Large dust particles (i.e. of the order of 0.1 to 10 µm in size) reduce IR radiance at the TOA, due to the combined effects of scattering and absorption (Legrand et al., 2001). Smaller particles (radius <0.1 µm) will have a lesser effect on the OLR. This means sub-micron particles are mostly transparent in the infrared (Maley, 1982).
The radiance depression (with respect to clear-sky IR radi-ance), resulting from the presence of mineral dust aerosols in the atmosphere, can be used as an index of dust aerosol load (Tanr´e and Legrand, 1991). Dust layer reduces the infrared radiance received by satellites (Tanr´e and Legrand, 1991). Different processes involved in lowering the infrared radi-ance, due to dust, are discussed in the literature (Tanr´e and Legrand, 1991; Brooks, 2000; Legrand et al., 2001; Leon and Legrand, 2003) and are briefly outlined here.
– (a) The dust layer reduces (by scattering and absorption) incoming solar radiation and cools the land surface, thus reduces OLR.
– (b) The dust layer absorbs part of the OLR.
– (c) Some of this IR radiation absorbed in the dust layer will be converted to kinetic energy as the layer is heated and part will be re-emitted in all the directions, with only a fraction escaping to space.
In the present study, satellite measured infrared (IR) ra-diance acquired from METEOSAT-5 in the 10.5 to 12.5 µm wavelength band (at ∼5-km resolution) was used to retrieve dust aerosol properties. The approach is based on Tanr´e and Legrand (1991) and Legrand et al. (1994, 2001).
An IRBT depression, caused by the presence of dust aerosols in the atmosphere, can be used as an index of dust load and is called IDDI (Tanr´e and Legrand, 1991).
The radiance depression at the TOA, due to the presence of a dust laye, is,
40 S. Deepshikha et al.: Dust aerosols over India from METEOSAT infrared radiance – Part I
S. Deepshikha et al.: Dust aerosols over India from METEOSAT infrared radiance – Part I 41
Fig. 3. Arch diagrams for a 3×3 pixel array of a 60×60 pixel box
from a Difference Image (DI) and their classification according to the cloud algorithm. A typical arch with its clear foot delimited (top panel) and the foot classified as fully clear (bottom panel).
Fig. 4. The number of points per bin of 1 K in width. The point at
which the number of points drastically decreases (to less than 50% of the average of the previous bins) was assigned as a clear foot.
where R↑t is the radiance leaving the TOA and R↑b is the ra-diance leaving the TOA without dust.
The IDDI images were created using radiometric counts (RC) from METEOSAT-5. Radiometric counts are first con-verted into radiance using the following relation:
Radiance = CalibrationCoefficient ∗ (Ca−Cs) , (2)
Fig. 5. Arch diagrams for a 3×3 pixel array of a 60×60 pixel box
from a Difference Image (DI) and their classification according to the cloud algorithm. An example of an arch without a clear foot classified as fully cloudy (top panel) and an arch classified as fully clear (bottom panel).
Fig. 6. A typical representation of the thresholds representing the
background dust condition, normal dust conditions and cloudy con-ditions. The boundary between the clear and cloudy conditions is also shown. In this situation cloud screening is difficult.
where Cais actual satellite count, Csis the space count and
42 S. Deepshikha et al.: Dust aerosols over India from METEOSAT infrared radiance – Part I
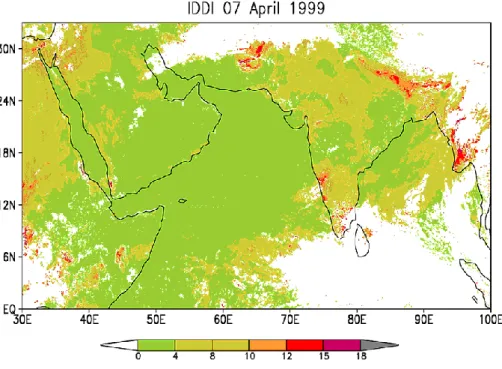
Fig. 7. The final IDDI image (in K) after cloud screening the difference image. This image represents the regional distribution of dust
aerosols.
S. Deepshikha et al.: Dust aerosols over India from METEOSAT infrared radiance – Part I 43
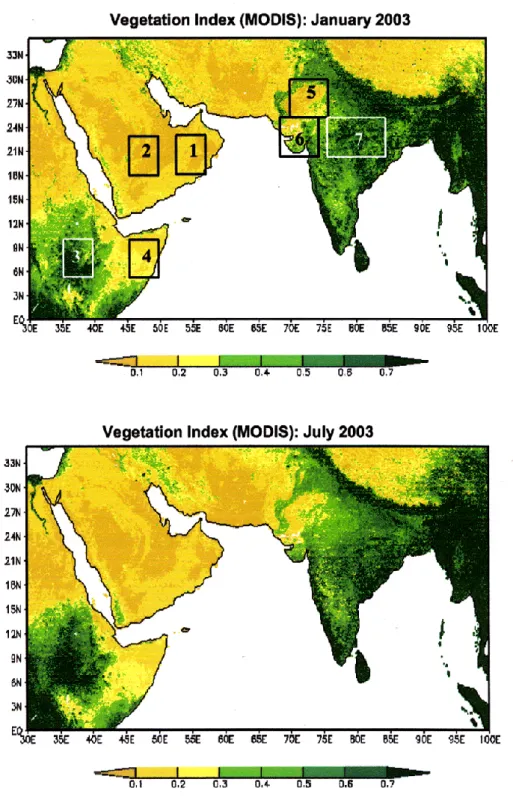
Fig. 9. Normalised Difference Vegetation Index (NDVI) maps of dry (January) and monsoon (July) months. The numbers inside the boxes
represent the various regions which are used in the text to identify regions.
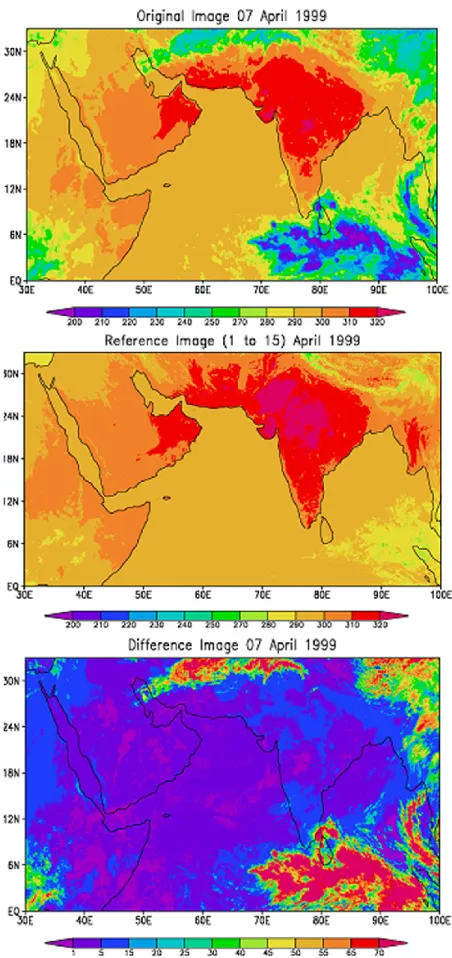
with the radiometric counts. Radiance data is converted into brightness temperature (IRBT) data, using an inverse Planck Function. This IRBT forms the original image (an example is shown in Fig. 2a). An “original image” contains all the ra-diative information about surface and atmosphere (Legrand et al., 2001).
The next step was to create a “reference image” represent-ing clear-sky conditions for consecutive, non-overlapprepresent-ing pe-riods, whose duration is short enough to eliminate the sea-sonal effects but long enough to ensure that the clear-sky or near clear-sky conditions exist for least one measurement, for each pixel (Legrand et al., 2001). The purpose of the
44 S. Deepshikha et al.: Dust aerosols over India from METEOSAT infrared radiance – Part I
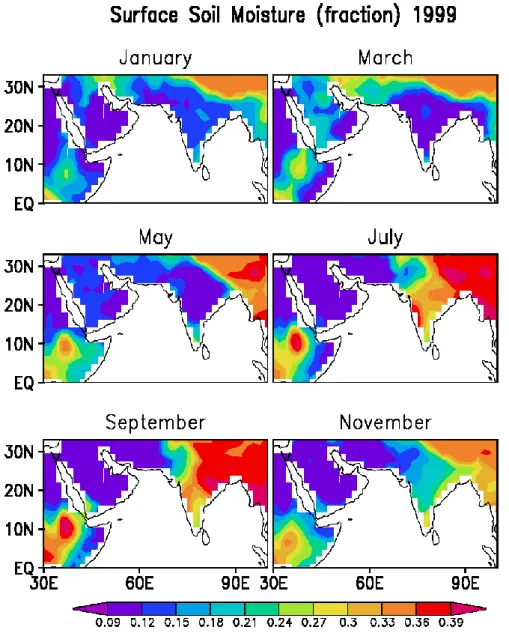
Fig. 10. The monthly average regional distribution of soil moisture during 1999 over India and adjacent continents for six representative
months.
“reference image” is to separate the land effect from the “original image”. A 15-day reference period is used here. For a given pixel, the maximum in the daily values of IRBT within a given reference period is assumed to represent the characteristics of the target pixel, as in cloud-free and dust free (background) conditions (Fig. 2b). Next, a “difference image”, exhibiting the clouds and dust patterns separated from the permanent surface features, was obtained by sub-tracting the individual day “original image” (or IRBT) from the “reference image” for that period. The “difference im-age” (Fig. 2c) shows only the variable atmospheric radia-tive effects related to both clouds and dust (Legrand et al., 2001). Difference values represent the reduction in IRBT due to dust aerosols, provided that cloudy pixels are identi-fied and screened.
Since the permanent surface patterns in the difference im-age are eliminated, clouds are observed over continental re-gions against a smooth, somewhat ocean-like, background (Legrand et al., 2001). This makes it easier to identify clouds in a “difference image” than in the “original image”. Cloudy pixels were screened using the spatial coherence method (Coackley and Bretherton, 1982). First, cloudy pixels were identified in the “difference image” by dividing the whole image into regions of 60×60 pixel boxes. The local mean and standard deviation of the surrounding 3×3 pixel window was estimated within the pixel box and plotted, as shown in Fig. 3a. If the box considered is partly cloudy, then the plot forms an “arch” with areas of high coherence, with a low standard deviation, and areas with low coherence, with high standard deviations. If we set threshold values for the mean and standard deviation, which define the cloud-free area, we
S. Deepshikha et al.: Dust aerosols over India from METEOSAT infrared radiance – Part I 45
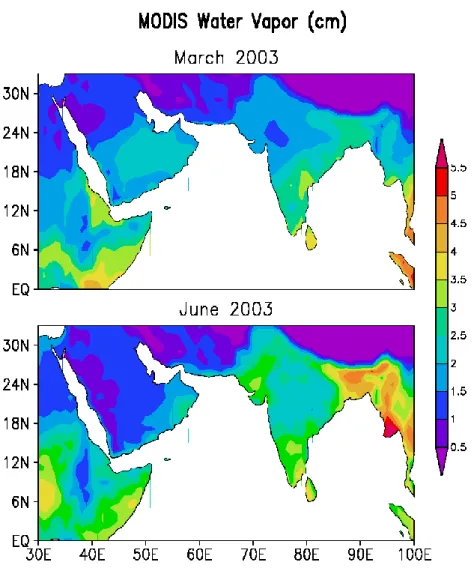
Fig. 11. Clear-sky column water vapour content derived from MODIS data using a near-infrared method.
can separate the clouds from the scene (Fig. 3b). In the “dif-ference image”, pixels, which lie outside the threshold of the mean and standard deviations, are identified as cloudy pixels and are masked. In order to find the thresholds, which define the clear-sky scene, we need to separate the clear foot of the arch in Fig. 3a. For this purpose, we have divided the x-axis of Fig. 3a into 1-K bins and estimated the number of points lying within each bin. For this purpose, we have arbitrarily assigned a threshold standard deviation of 5 K (please note that this is not the final threshold), which is much larger than the standard deviation expected for dust but lower than that expected for cloudy scenes. The bin at which the number of points drastically decreases (to less than 50% of the aver-age of previous bins) was assigned as the clear foot. In this example the clear foot was identified as 11 K (see Fig. 4).
The next step was to find the threshold for standard devi-ation, which defines clear-sky area. The threshold standard deviation is defined (in this study) as the standard deviation below which 90% of the points within the clear foot exist.
Typically the threshold standard deviation was in the range from 1 to 2 K. In this way, depending on the amount and type of clouds, threshold values (clear foot and threshold standard deviation) are different for different scenes.
In the case of completely cloudy scenes, the plot of local mean versus standard deviation does not have an arch struc-ture. An example is shown in Fig. 5 (top panel). Similarly, in the case of completely clear scenes, there will be usually only one foot with a very low standard deviation, as low as 2 K or even less (Fig. 5, bottom panel). These scenes can be identi-fied as completely clear-sky scenes. A typical representation of the thresholds (mean and standard deviation), represent-ing background dust condition, normal dust conditions and cloudy conditions, are shown in Fig. 6. Now the resulting image after cloud screening (an example is shown in Fig. 7) is an IDDI image, which represents the regional distribution of dust. Daily IDDI images were created after cloud screen-ing. Thus, four steps of data processing are involved in order to create IDDI images.
46 S. Deepshikha et al.: Dust aerosols over India from METEOSAT infrared radiance – Part I
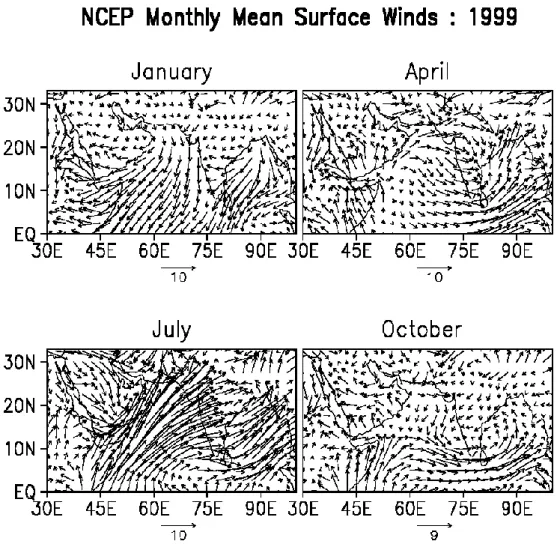
Fig. 12. The monthly regional distribution of surface winds during 1999 over India and adjacent continents for four representative months.
The length of the arrows represent the magnitude of wind speed and its direction represents wind direction.
The METEOSAT IR radiance data were analysed for all days during 1999. These results were compared with a year with a large number of dust storms reported by meteorologi-cal departments based on visibility data (i.e. 2003). The sea-sonal variation and regional distribution of dust aerosols over arid and semiarid regions of India and adjacent continents are studied. There have been studies in the past carried out over Sahara using IDDI. Over the Indian region, however, studies on dust are sparse. In addition to METEOSAT IR radiance, vegetation index, water vapour content and fire pixel count (a measure of biomass burning location) from MODIS (on board TERRA satellite) were also used. The NCEP/NCAR reanalysed surface soil moisture and surface winds were also used to support the results.
4 Results and discussion
It is necessary to consider the temporal and spatial scales over which dust is most likely to interact with the processes
which determine the regional climate, in order to identify the regions and seasons during which dust aerosols are present (Brooks and Legrand, 1999; Brooks, 2000; Legrand et al., 2001). It has been postulated that large dust loading over widespread areas in arid and semiarid zones might re-duce surface heating sufficiently to affect the dynamics of the regional circulation pattern (Brooks and Legrand, 1999; Brooks, 2000). Dust events are likely to have an impact on the thermal structure of the atmosphere (Tegen and Fung, 1994). Prolonged impact of atmospheric dust on the large-scale regional circulation would arise from generally ele-vated dust levels over periods longer than those associated with individual events (N’Tchayi et al., 1997; Brooks and Legrand, 1999). It is therefore important to examine varia-tions in dust loading on a monthly or seasonal scale.
S. Deepshikha et al.: Dust aerosols over India from METEOSAT infrared radiance – Part I 47
Table 2. Comparison of Monthly Mean IDDI (K).
Table-2. Comparison of Monthly Mean IDDI (K)
Saudi Arabia-I Saudi Arabia-II Rajasthan Month 1999 2003 1999 2003 1999 2003 Jan 4.0 ± 1.9 4.4 ± 2.3 4.3 ± 1.7 6.0 ± 2.1 6.1 ± 1.9 5.3 ± 2.2 Feb 4.6 ± 1.9 5.6 ± 3.4 5.5 ± 1.6 6.7 ± 1.8 6.2 ± 2.5 6.5 ± 3.8 Mar 5.5 ± 2.1 6.7 ± 3.6 6.6 ± 1.9 8.2 ± 2.7 6.4 ± 3.2 5.7 ± 2.5 Apr 4.9 ± 1.9 7.3 ± 3.9 5.5 ± 2.0 7.8 ± 2.4 4.1 ± 1.6 6.5 ± 3.2 May 5.0 ± 3.0 6.3 ± 2.8 6.1 ± 2.2 6.6 ± 2.5 8.7 ± 3.8 7.4 ± 3.5 Jun 4.5 ± 1.6 5.6 ± 2.6 4.3 ± 1.7 5.2 ± 1.9 7.3 ± 3.4 8.5 ± 3.1 Jul 5.3 ± 1.9 6.9 ± 2.6 4.5 ± 1.6 5.8 ± 1.8 8.6 ± 4.4 9.3 ± 3.5 Aug 4.1 ± 0.9 6.3 ± 3.7 3.9 ± 1.3 6.3 ± 2.6 6.4 ± 3.9 7.3 ± 2.7 Sep 5.1 ± 0.7 5.3 ± 1.5 3.8 ± 1.4 5.6 ± 1.6 5.7 ± 2.3 7.0 ± 2.8 Oct 5.0 ± 1.0 5.8 ± 2.6 3.5 ± 1.1 5.7 ± 1.8 4.4 ± 2.5 3.8 ± 2.1 Nov 3.7 ± 1.5 4.3 ± 1.9 3.7 ± 1.2 4.5 ± 1.6 3.5 ± 1.8 4.2 ± 2.3 Dec 2.5 ± 0.6 4.7 ± 2.5 2.7 ± 0.8 4.6 ± 1.8 3.8 ± 1.9 3.7 ± 2.6 Annual Average 4.5 ± 0.84 5.8 ± 1.0 4.6 ± 1.0 6.1 ± 1.1 5.9 ± 1.7 6.3 ± 1.8
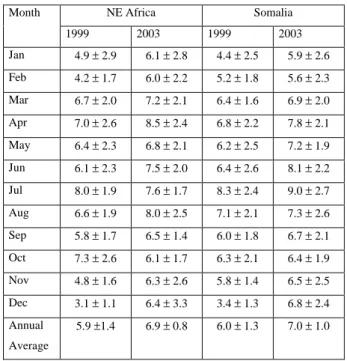
Table 3. Comparison of Monthly Mean IDDI (K).
Table-3. Comparison of Monthly Mean IDDI (K) NE Africa Somalia Month 1999 2003 1999 2003 Jan 4.9 ± 2.9 6.1 ± 2.8 4.4 ± 2.5 5.9 ± 2.6 Feb 4.2 ± 1.7 6.0 ± 2.2 5.2 ± 1.8 5.6 ± 2.3 Mar 6.7 ± 2.0 7.2 ± 2.1 6.4 ± 1.6 6.9 ± 2.0 Apr 7.0 ± 2.6 8.5 ± 2.4 6.8 ± 2.2 7.8 ± 2.1 May 6.4 ± 2.3 6.8 ± 2.1 6.2 ± 2.5 7.2 ± 1.9 Jun 6.1 ± 2.3 7.5 ± 2.0 6.4 ± 2.6 8.1 ± 2.2 Jul 8.0 ± 1.9 7.6 ± 1.7 8.3 ± 2.4 9.0 ± 2.7 Aug 6.6 ± 1.9 8.0 ± 2.5 7.1 ± 2.1 7.3 ± 2.6 Sep 5.8 ± 1.7 6.5 ± 1.4 6.0 ± 1.8 6.7 ± 2.1 Oct 7.3 ± 2.6 6.1 ± 1.7 6.3 ± 2.1 6.4 ± 1.9 Nov 4.8 ± 1.6 6.3 ± 2.6 5.8 ± 1.4 6.5 ± 2.5 Dec 3.1 ± 1.1 6.4 ± 3.3 3.4 ± 1.3 6.8 ± 2.4 Annual Average 5.9 ±1.4 6.9 ± 0.8 6.0 ± 1.3 7.0 ± 1.0
4.1 Surface soil condition, surface wind and atmospheric water vapour
The topography map of the study region is shown in Fig. 8, which provides information about altitude of various loca-tions within METEOSAT-5 window. Dust production de-pends on soil moisture, surface wind speed and surface soil conditions (e.g. existence of vegetation). For a given wind speed, the dust production rate at the surface depends on
soil moisture (in the absence of vegetation) (Gillettte, 1979; Jaenicke, 1980, 1993; Prospero et al., 1983, 2002). In semi-arid regions, however, vegetation cover may have a greater influence than soil moisture, since permanent seasonal veg-etation persists, which inhibits dust production even when the soil moisture becomes too low. Therefore, we show in Fig. 9, a normalised difference vegetation index (NDVI) de-rived from MODIS (on board TERRA satellite) data for both dry (January) and monsoon (July) months. The areas rep-resented in green (typically NDVI>0.3) are vegetated areas. We did not find any significant seasonal variation in vegeta-tion cover over the study area except in central India and the northeast African region. Over central India during January, more than 90% of the pixels had NDVI>0.3 while during June this was about 75%. The MODIS has provided NDVI data at a 1-km resolution. But year-round MODIS data is available from 2000 only. This is the reason we presented vegetation index maps for 2003 instead of 1999. The boxes shown in Fig. 9 (top panel) represent boundaries of regions considered for studying the temporal characteristics of dust (discussed later in Sect. 4.3) and are numbered from (1) to (7). The monthly regional distribution of soil moisture during 1999 over India and adjacent continents is shown in Fig. 10 (from NCEP/NCAR). Soil moisture is a measure of surface wetness. The Indian deserts are dry from December to May. After the onset of monsoon rainfall, soil moisture over these regions becomes higher (in June to November period). This seasonal pattern of soil moisture is more or less similar over central Africa, as well. The Arabian Desert, on the other hand, is dry during most of the year.
The regional distribution of clear-sky column water con-tent (from MODIS) is derived using a near-infrared method during both the dry and monsoon months (see Fig. 11).
48 S. Deepshikha et al.: Dust aerosols over India from METEOSAT infrared radiance – Part I
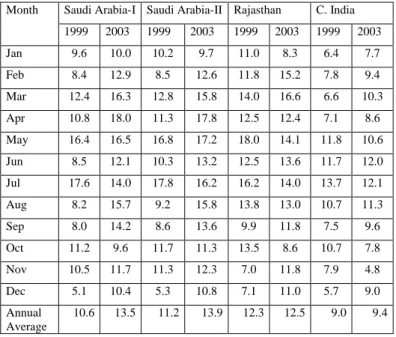
Table 4. Comparison of Daily Maximum IDDI (K).
Table-4. Comparison of Daily Maximum IDDI (K)
Saudi Arabia-I Saudi Arabia-II Rajasthan C. India Month 1999 2003 1999 2003 1999 2003 1999 2003 Jan 9.6 10.0 10.2 9.7 11.0 8.3 6.4 7.7 Feb 8.4 12.9 8.5 12.6 11.8 15.2 7.8 9.4 Mar 12.4 16.3 12.8 15.8 14.0 16.6 6.6 10.3 Apr 10.8 18.0 11.3 17.8 12.5 12.4 7.1 8.6 May 16.4 16.5 16.8 17.2 18.0 14.1 11.8 10.6 Jun 8.5 12.1 10.3 13.2 12.5 13.6 11.7 12.0 Jul 17.6 14.0 17.8 16.2 16.2 14.0 13.7 12.1 Aug 8.2 15.7 9.2 15.8 13.8 13.0 10.7 11.3 Sep 8.0 14.2 8.6 13.6 9.9 11.8 7.5 9.6 Oct 11.2 9.6 11.7 11.3 13.5 8.6 10.7 7.8 Nov 10.5 11.7 11.3 12.3 7.0 11.8 7.9 4.8 Dec 5.1 10.4 5.3 10.8 7.1 11.0 5.7 9.0 Annual Average 10.6 13.5 11.2 13.9 12.3 12.5 9.0 9.4
Legrand et al. (2001) has made detailed sensitivity analy-sis on the role of atmospheric water vapor in contaminating IDDI. They reported that when the water vapor amount is in the range between 0.5 and 2.5 g cm−2, maximum varia-tion in simulated METEOSAT infrared response (IDDI) is not greater than 2 K. When the water vapor amount exceeds 3 g cm−2, the effect of the water vapor becomes important. Over arid and semiarid locations water vapor amount is usu-ally less than 2.5 g cm−2 during most of the time in a year.
Over locations experiencing a water vapor amount exceed-ing 3 g cm−2, water vapor absorption contributes to IDDI.
We have made estimates of the effect of water vapor on IDDI based on Fig. 11, which shows that over most of the study region the effect of water vapor on IDDI is as high as 3 K (especially within the boxes shown in Fig. 9).
Investigations in the past have reported that the thresh-old wind speed required for dust production starts at 4 m s−1 (Helgren and Prospero, 1987; Nickling and Gillies, 1989). However, studies carried out later have shown that a wind speed above 0.5 m s−1is capable of transporting the mineral dust particles in the atmosphere as large as 2 µm in size (Mc-Tainsh, 1980; d’Almeida et al., 1991). When soil moisture is low (in the absence of vegetation) the magnitude of the surface wind is mainly responsible for the production of dust from the surface. Therefore, we show a regional distribu-tion of surface (10 m) winds (obtained from NCEP/NCAR reanalysis) during 1999 over India and adjacent continents in Fig. 12. The length of the arrows represents the magnitude of the wind speed, and its direction indicates the wind direction. Surface winds have an important role not only on dust pro-duction but also in transporting dust from one region to an-other. Surface winds are weak (3 to 5 m s−1)during Novem-ber to March throughout India and the adjacent regions. This
is shown in Fig. 12 for January. The wind speed starts pick-ing up from April and reaches a maximum (10 to 12 m s−1) during June/July. The net dust production at any location de-pends on the combined effect of wind and soil moisture. If the wind speed and soil moisture are both high, the dust pro-duction rate will be low. For example, over northwest India, when the wind speed peaks during June, July and August, soil moisture is also high due to monsoon rains. Thus, re-gions, such as Arabia, experiencing high wind speed and low soil moisture conditions (and nearly negligible vegetation) (Figs. 9 to 12), are expected to be the dominant dust sources. 4.2 Seasonal variations in dust loading as inferred from
IDDI
Dust which is transported large distances may have an im-pact on climate far from its source (Li et al., 1996; Alpert et al., 1998; Schollaert and Merrill, 1998; Li et al., 2004). Different regions act as dust sources during different times of the year and hence the dust source function is different for different regions and for different seasons. Over source regions and neighboring land areas dominant aerosols are mineral dust particles. Outside these regions, other aerosols, such as biomass burning aerosols or sulphates, are also im-portant. Airborne dust is likely to have the greatest impact on the radiative and optical properties of the atmosphere near its source where effective particle size and particle number den-sity is the highest.
The noon-time IDDI images were constructed in order to examine dust variability over arid and semiarid regions of In-dia, as well as Africa and Arabia. Here, only representative images of IDDI for the year 1999 are presented. However, discussions are based on IDDI maps for all days. More de-tails are provided in Tables 2 to 5. White areas are cloudy
S. Deepshikha et al.: Dust aerosols over India from METEOSAT infrared radiance – Part I 49
Fig. 13. Typical examples of regional distribution of IDDI (K) during January, February and March.
areas, which are screened by a cloud screening algorithm. Regions with IDDI larger than 6 K are easily distinguishable as regions with large dust loads (dusty areas). The IDDI val-ues larger than 6 K correspond to dusty conditions, charac-terised by visibilities near the ground of less than 10 km and are approximately equivalent to an Aerosol Optical Depth (AOD) of 0.3–0.5 (Legrand et al., 1994). This can contribute to a radiative forcing of several W m−2on a local or regional scale, which is of the same order as the globally averaged en-hanced greenhouse gas forcing (Lacis and Mischenko, 1995).
4.2.1 January, February and March
Noon-time data of the Meteosat-5 IR channel for all days of 1999 were analysed and low IDDI was observed over the In-dian landmass during January (Figs. 13a, b). Over arid and semiarid regions of Northwest India, IDDI values were in the range of 2 K to 8 K (monthly average), which ares com-monly observed values over desert regions. Studies of dust over the Sahara have demonstrated that a brightness temper-ature depression (i.e. IDDI) of 10 K is commonly observed
throughout the year (Legrand et al., 2001). During January, soil moisture was very low over the deserts (Fig. 10) over Northwest India (Rajasthan). However, surface winds were also low (∼3 m s−1)during January (Fig. 12), which could be the reason for low IDDI. In parts of South India high IDDI values were occasionally observed (Fig. 13, for exam-ple). One interesting feature was observed over the north-ern part of India, where IDDI values were in the range of 12 K to 18 K and persisted for more than 10 days (i.e. from 7 to 21 January 1999) (Fig. 13a). These high values usually correspond to dust storm events and interestingly there were no dust storms reported during January in that region. Even though IDDI is less sensitive to biomass burning aerosols, in the aftermath of the biomass burning episode, black carbon aerosols might stick to large dust aerosols (resulting in large and highly absorbing dust aerosols) (Chandra et al., 2004; Seinfeld et al., 2004; Deepshikha et al., 2005), hence leading to higher IDDI values. Sensitivity studies discussed in pre-vious sections have shown that IDDI is not sensitive to black carbon aerosols when it exists independently. But if black carbon is the result from biomass burning accumulation over
50 S. Deepshikha et al.: Dust aerosols over India from METEOSAT infrared radiance – Part I
Fig. 14. Maps of fire pixel counts (from TERRA satellite data) which provide information on the period and regions of biomass burning.
dust, then it will have an impact on IDDI. To examine the period and regions of biomass burning, we show monthly maps of fire pixel counts (a measure of biomass burning) from TERRA satellite data in Fig. 14. Fire pixel counts are estimated from infrared satellite radiance and represent the number of occurrences of high infrared emission from the surface (biomass burning episodes). These maps show in-tense biomass burning activity over Southern India and Indo-Gangetic plains (Northern India) during the winter months (December to March). Therefore, these high values of IDDI (over Indo-Gangetic plains and South India) (see Fig. 13a) could probably be due to dust mixed with black carbon par-ticles (from biomass burning). The influence of fog is ruled out, as we have examined the Relative Humidity (RH) data from meteorological observatories, which shows that RH de-creases from ∼90% in the morning hours to less than 50% by around 11 a.m. (see also, Tripathi et al., 2005). Thus, noon-time IDDI maps (which are reported in this paper) are not in-fluenced by fog. The Indo-Gangetic plain is well known for a high load of black carbon and sulphate aerosols during the
pre-monsoon season (Girolamo et al., 2005; Tripathi et al., 2005). These pollution aerosols also have an impact on the IDDI by decreasing the solar radiation at the surface. Sen-sitivity studies show that the effect of reduction of the solar radiation in IDDI is less than 10%.
During February IDDI over the Arabian Desert has in-creased but over the Indian region it was still low. In Fig. 13c (14 February) a region with high IDDI values (8–12 K) can be seen over the Arabian region (21◦N–29◦N and 40◦E–
50◦E), whereas the Indian region low values of IDDI were
observed. Figure 13d (23 February) shows larger IDDI (∼8 K) over Saudi Arabia compared to the Indian region with a large area covered by dust. However, February was a month with low IDDI over the Indian arid and semiarid regions (Figs. 13c, d). From March onwards dust loading increased over arid and semiarid regions of India, as well as adjacent regions (Figs. 13e, f). The soil moisture was low (0– 0.12) all over Northern India (Fig. 10). The surface wind pat-tern (NCEP/NCAR reanalysis data) in March /April (Fig. 12) shows that wind speeds in March/April are higher compared
S. Deepshikha et al.: Dust aerosols over India from METEOSAT infrared radiance – Part I 51
Fig. 15. Typical examples of regional distribution of IDDI (K) during April, May and July.
to January and February. The lower soil moisture and higher surface winds might have resulted in enhanced atmospheric dust loading over the source regions, as well as regions away from the source. Figures 13e, f show IDDI values as large as 15 K over most of India and Arabia. On 8 March over the Arabian Desert, no dust retrieval was possible because of clouds. On the same day, over the Indian desert and neigh-boring regions in Pakistan, Afghanistan and Iran, a mild dust storm was observed (Fig. 13e). Around the middle of March a high dust load was observed over the Arabian Desert and all over the northern part of India. In the southern part of India, around 18◦N, high IDDI was observed which could be due to dust aerosols transported or as a consequence of biomass burning aerosols sticking to local dust. Over Northwest India IDDI was, in general, high (in the range of 8 K–12 K) during March (Figs. 13e, f).
4.2.2 April, May and June
During April, May and June large IDDI values were ob-served over arid and semiarid regions of India (Figs. 15a–d and Fig. 16). During April, May and June the northwest part of India is the driest and hottest (Fig. 10). Low soil mois-ture simultaneous with high wind speed caused the uplift of
surface dust to the atmosphere and hence led to high IDDI over Northwest India (Figs. 10 and 12). In addition, the cir-culation pattern during this period favors transport of mineral dust aerosols from Northwest India towards Central India. Figures 15a, b show IDDI maps for two representative days of April 1999.
In May, winds were high, of the order of ∼10 m s−1. High
winds could be one of the factors, which leads to high IDDI (Figs. 15c, d). The IDDI was the highest over Northwest India during April, May and June (Figs. 15c, d and Fig. 16). An analysis of daily IDDI values during this period indicates that there were several dust episodes lasting from a few hours to a few days. During May and June several dust storms were observed. Figures 15c, d show high IDDI on 25 and 30 May, which represents a dust storm covering the northwest part of India and a part of Pakistan and Afghanistan. This dust episode persisted from 19 May and prevailed until 31 May.
During May and June, IDDI values as high as 18 K were observed often over desert regions and even more than 18 K occasionally (Figs. 15c, d and Fig. 16). A typical example of a dust storm observed during June 1999 is shown in Fig. 16. The daily average wind pattern corresponding to the days of the dust storm is shown in Fig. 17. Note from Figs. 9 to 12
52 S. Deepshikha et al.: Dust aerosols over India from METEOSAT infrared radiance – Part I
Fig. 16. A typical example of a dust storm observed during June 1999. Here IDDI is in K.
that Afghanistan (region above Rajasthan, which is Region-5 in Fig. 9) and the adjacent regions are dry during June/July and winds are quite high, of the order of 10 m s−1. The storm started on 4 June, reached its maximum on 5 June and there-after faded in intensity, gradually to reach background levels by 11 June. Meanwhile, another high dust event occurred over the Gujarat region (northwest India; Region-6 in Fig. 9) on 7 June and reached its maximum on 8 June and reduced to background values in the next two days. Figure 17 shows that variations in wind speed play an important role in these two dust episodes. The daily variations of IDDI correspond-ing to these two dust storms are shown in Fig. 18. In both cases dust levels decreased to normal values in two to three days.
4.2.3 July to December
After the onset of southwest monsoon, dust detection was difficult due to cloudy conditions. In case clouds are cov-ering an area where dust load is high, it is very difficult to distinguish between the dust and cloud patches. Thus, only a few days of IDDI data was available over the Indian re-gion during monsoon season. Over the Arabian and African regions, however, data were available. During and imme-diately after the monsoon rains, soil moisture increased and wind speed became low (Figs. 10 and 12). Thus, during Au-gust and September IDDI over the Indian arid and semiarid regions were moderate (Fig. 19). However, from Figs. 15e, f and 19, it can be seen that IDDI was high over the Arabian Desert until November. From October onwards soil moisture starts reducing and gradually dry conditions are back over
S. Deepshikha et al.: Dust aerosols over India from METEOSAT infrared radiance – Part I 53
Table 5. Comparison of Daily Maximum IDDI (K).
Table-5. Comparison of Daily Maximum IDDI (K) NE Africa Somalia Gujarat Month 1999 2003 1999 2003 1999 2003 Jan 10.8 13.5 11.4 14.1 5.8 5.9 Feb 5.9 8.4 7.1 9.6 5.2 10.0 Mar 10.3 11.2 12.3 12.3 7.7 12.3 Apr 10.2 12.9 10.4 13.1 6.7 11.4 May 9.9 12.2 10.3 12.1 15.8 9.7 Jun 12.7 12.5 13.2 12.4 15.6 11.0 Jul 11.4 9.8 12.1 10.2 13.2 13.4 Aug 8.5 13.0 9.5 12.8 9.8 14.2 Sep 9.6 9.2 10.6 9.5 16.0 12.1 Oct 14.0 10.9 14.4 10.5 6.0 6.1 Nov 8.4 12.8 9.4 12.9 10.6 5.3 Dec 5.8 11.4 6.3 11.8 6.2 8.0 Annual Average 9.8 11.5 10.6 11.8 9.9 10.0
Fig. 17. Daily average wind pattern corresponding to days of dust
storm shown in Fig. 13.
Fig. 18. Daily IDDI values (K) estimated over Afghanistan and
Gujarat during a dust event.
the Indian deserts (Fig. 10). December was characterised by low IDDI values (Fig. 19) all over the study region.
4.3 Difference between 1999 and 2003 dust episodes Using METEOSAT IR radiance, IDDI images were con-structed for all days of 1999 and 2003. A comparison be-tween 1999 and 2003 was made. The METEOSAT-5 was moved to the Indian Ocean region by the end of 1998. Since full year data were available in 1999, we have used 1999 data to study dust aerosols. We have compared these results with 2003, since 2003 was a year with alarge number of dust storms based on meteorological department reports based on visibility data.
Using daily noon-time IDDI images monthly mean images were constructed. Since various regions act as a dust source during different seasons, temporal variations of dust at var-ious regions were studied separately. We examine the sea-sonal variations in dust in the following seven regions, which include both dry and vegetated (and moist) regions. Since dust spatial distribution is highly uneven, we have selected small regions (typically 5◦×5◦boxes).
These seven regions are:
1. Arabian Desert-I (Saudi Arabia-I) (19◦N–24◦N and 53◦E-58◦E)
2. Arabian Desert-II (Saudi Arabia-II) (19◦N–24◦N and 45◦E–50◦E)
3. Northeast (NE) Africa (5◦–10◦N and 35◦E–40◦E) 4. Somalia (5◦–10◦N and 43◦E–48◦E)
5. Indian Desert (Rajasthan) (25◦N–30◦N and 70◦E– 76◦E) (North West India)
6. Gujarat (21◦N–25◦N and 68◦E–74◦E) (Northwest In-dia)
54 S. Deepshikha et al.: Dust aerosols over India from METEOSAT infrared radiance – Part I
Fig. 19. Typical examples of regional distribution of IDDI (K) during September, October, November and December.
Fig. 20. Temporal Variation of IDDI (K) (dashed lines) for 1999 (blue) and 2003 (red) over the Saudi Arabian Desert (53◦N–58◦N and 19◦E–24◦E). The solid lines represent a 15-day running average.
The boundaries of these regions are marked in Fig. 9 (vege-tation index maps). Thus, three boxes represent dry (no veg-etation) regions (Regions-1, 2 and 4 in Fig. 9), two boxes represent vegetated regions (Regions-3 and 7 in Fig. 9) and
two partly vegetated region (Regions-5 and 6 in Fig. 9). The numbers inside the boxes represent various regions, which are used subsequently in the discussions to identify regions.
S. Deepshikha et al.: Dust aerosols over India from METEOSAT infrared radiance – Part I 55
Fig. 21. Temporal variation of IDDI (K) (dashed lines) for 1999 (blue) and 2003 (red) over northeast Africa and Rajasthan. The solid lines
represent a 15-day running average.
Figures 20 to 22 compare IDDI (daily values) in 1999 (blue) and 2003 (red), for five regions out of the seven con-sidered. In Figs. 20 to 22, dashed lines correspond to daily values and the solid line represents the 15- day running aver-age. It was observed that most of the regions show a general tendency in seasonal pattern in IDDI, with maximum val-ues during the May to August period. It was also observed that for NE Africa a period of maximum IDDI is difficult to define. On a monthly or annual scale IDDI was higher in 2003 by 2 K (Tables 2 and 3). Another feature observed in all regions was the high day-to-day variability in dust load. Quantitative comparison of IDDI between 1999 and 2003 is given in Tables 2 and 3. These tables provide comparison for Saudi Arabia-II and Somalia, which are not shown in Figs. 20 to 22. Tables 4 and 5 provide information on the maximum daily IDDI within each month.
Figure 20 shows the IDDI variation over the Arabian Desert (Saudi Arabia-I; Region-1 in Fig. 9) and it can be seen that during March–April, June–July and September–October IDDI reaches high values (in 1999), with the highest value
of ∼18 K during April to July. Even in November few days show high IDDI, which could be due to short period dust events. An almost similar pattern was observed in 2003 but dust the load was slightly more, especially in April–May, August–September and December. The NE African region (excluding Somalia; Region-4 in Fig. 9) is not a dust source but it is adjacent to the Sahara and Sahel. This region shows the highest IDDI during April-May and August. As shown in the upper panel of Fig. 21, IDDI values for 2003 are slightly higher than that of 1999 (Table 3).
Another region considered was the “Thar Desert” in Northwest India, which extends over the northwest part of Rajasthan (locations defined earlier; Region-5 in Fig. 9). It receives very low annual rainfall and remains hot and dry during the daytime. The lower panel of Fig. 21 shows the variation of the dust load over this region. Average IDDI in this region is nearly 8 K throughout the year, but the region experienced a number of dust storms in May, June and July. As a consequence, IDDI often reaches as high as 19 K (rep-resenting a thick atmospheric dust layer).
56 S. Deepshikha et al.: Dust aerosols over India from METEOSAT infrared radiance – Part I
Fig. 22. Temporal variation of IDDI (K) (dashed lines) for 1999 (blue) and 2003 (red) over Gujarat and central India.
Over Gujarat (Region-6 in Fig. 9), the dust load increases in June, as shown in Fig. 22 (top panel), and the IDDI reaches a value as high as 16 K. Again, in September and October high dust loading was observed. Central India (Region-7 in Fig. 9) can be considered as a vegetated region. The largest IDDI observed in this region was ∼13 K. In summary, the dust load was, in general, maximum during the May to Au-gust period over most of the regions considered. The IDDI during this period was, on a monthly scale, higher in 2003 compared to 1999 (Tables 2, 3, 4 and 5).
Next, we consider the regional distribution of IDDI aver-aged over a month and show a comparison of 1999 and 2003. Figures 23 to 26 show a comparison of IDDI between 1999 and 2003 for the whole study area (0–35◦N; 30◦E–100◦E). The number of days averaged per month was mostly 30 or 31. But during the monsoon months, the number of days varies from 20 to 28 (data unavailability due to cloudy sky conditions). Over the northern part of India, along the Indo-Gangetic plain, an interesting feature with high IDDI values ranging between 6–12 K was observed in both years. Other parts of India, Saudi Arabia and the NE African regions did
not show any dust activity in January. High IDDI over North India disappears in February and only a few patches, indi-cating moderate dust load, were observed over central India, as well as Deccan Plateau of India, which gradually inten-sified in March. The large IDDI observed over the Indo-Gangetic plains was discussed in Sect. 4.2.1, in conjunction with Fig. 13. The band of large IDDI observed over the Indo-Gangetic plains, even on a monthly average scale (in January), indicates that this is a frequently occurring event.
In March, IDDI started increasing until July. During June and July high IDDI values were observed during 2003 over arid and semiarid regions of India and adjacent regions. Dur-ing June, the Thar Desert of India experienced a large number of dust storms of various intensities, which resulted in a sig-nificantly high IDDI, with the highest value in July over NE Africa. However, the Arabian Desert had the highest IDDI in March (which was concentrated over the central part of Ara-bia). The IDDI was low in April 2003 but it appears that dust was spread all over the Arabian region. In July 2003, a part of the Arabian region experienced a high dust load that slowly reduced in August. It is important to note that the difference
S. Deepshikha et al.: Dust aerosols over India from METEOSAT infrared radiance – Part I 57
Fig. 23. Regional distribution of IDDI (K) for January, February and March (1999 and 2003).
58 S. Deepshikha et al.: Dust aerosols over India from METEOSAT infrared radiance – Part I
Fig. 25. Regional distribution of IDDI (K) for July, August and September (1999 and 2003).
S. Deepshikha et al.: Dust aerosols over India from METEOSAT infrared radiance – Part I 59
in IDDI distribution (between 1999 and 2003) was dramatic in December and that IDDI values were drastically higher in 2003. In Part II, we make an effort to quantify wind depen-dence of IDDI and estimate the radiative effects of dust.
5 Conclusions
1. Spatial and temporal variability in dust loading over arid and semiarid regions of India and adjacent continents (excluding Sahara) are studied.
2. It was observed that dust activity starts by March over the Indian deserts, as well as over the deserts of Africa and the Arabian regions and reaches maximum during May to August.
3. Large day-to-day variation in IDDI was observed over the entire study region with values ranging from 4 to 22. 4. During the dry season, the magnitude of the monthly average IDDI during 2003 was slightly higher than that of 1999.
5. Monthly mean IDDI was in the range from 4 to 9 over the Indian deserts, as well as over the deserts of Africa. The maximum IDDI during a month was as high as in the range from 6 to 18.
6. Large IDDI values were observed even over vegetated regions (such as the vegetated part of Africa and cen-tral India), attributed to the presence of transported dust from nearby deserts.
7. Regional maps of IDDI, in conjunction with biomass burning episodes (using TERRA satellite fire pixel counts), suggest that large IDDI values observed dur-ing the winter months over Northern India could be due to a possible deposition of black carbon on larger dust aerosols.
Acknowledgements. The authors thank Department of Science and
Technology, New Delhi for supporting this work. We also thank LMD and EUMETSAT for providing METEOSAT-5 data and NCEP/NCAR for providing wind and soil moisture data. We sin-cerely thank the anonymous referees for their valuable suggestions, which has improved the quality of the paper substantially.
Topical Editor O. Boucher thanks three referees for their help in evaluating this paper.
References
Ackerman, S. A.: Using the radiative temperature difference at 3.7 and 11 µm to track dust outbreaks, Remote Sens. Environ., 27, 129–133, 1989.
Alpert, P., Kaufman, Y. J., Shay-El, Y., et al.: Quantification of dust-forced heating of the lower troposphere, Nature, 395, 367–370, 1998.
Arimoto, R., Duce, R. A., Ray, B. J., et al.: Trace elements in the atmosphere over the north Atlantic, J. Geophys. Res., 100, 1199– 1213, 1995.
Arimoto, R., Ray, B. J., Lewis, N. F., et al.: Mass-particle size dis-tributions of atmospheric dust and the dry deposition of dust to the remote ocean, J. Geophys. Res., 102, 15 867–15 874, 1997. Arimoto, R: Eolian dust and climate: relationships to sources,
tro-pospheric chemistry, transport and deposition, EarthScience Re-views, 54 (1–3), 29–42, 2001.
Brooks, N. and Legrand, M.: Dust variability over northern Africa and rainfall in the Sahel, in: Linking Land Surface change to cli-mate change, edited by: McLaren, S. J. and Kniveton, D., Kluwer Academic Publishers, 1999.
Brooks, N.: Dust-climate interactions in the Sahel-Sahara zone of northern Africa, with particular reference to late twentieth cen-tury Sahelian drought, PhD Thesis, Climatic Research Unit, Uni-versity of East Anglia, Norwich, 2000.
Chandra, S., Satheesh, S. K., and Srinivasan, J: Can the state of mixing of black carbon aerosols explain the mystery of “excess” atmospheric absorption?, Geophys. Res. Lett., 31, doi:10.1029/2004GL020662, 2004.
Chen, S.-J., Kuo, Y.-H., Ming, W., and Ying, H.: The effect of dust radiative heating on low-level frontogenesis, J. Atmos. Sci., 9, 1414–1420, 1995.
Christopher, S. A., Legrand, M., Marticorena, B., et al.: Estima-tion of diurnal short wave dust aerosol radiative forcing during PRIDE, J. Geophys. Res., 108 (D19): art. no. 8596, 2003. Coackley, J. A. and Bretherton, F. P.: Cloud cover from
high-resolution scanner data: method and preliminary results, J. Geo-phys. Res., 87, 4917–4932, 1982.
d’Almeida, G. A., Koepke, P., and Shettle, E. P.: Atmospheric Aerosols-Global Climatology and Radiative Characteristics, A. Deepak, Hampton, VA, 1991.
Deepshikha, S., Satheesh, S. K., and Srinivasan, J.: Regional Dis-tribution of Absorbing Efficiency of Dust Aerosols over India and Adjacent Continents inferred using Satellite Remote Sens-ing, Geophys. Res. Lett., 32 (3), art. no. L03811, 2005. Gillette, D. A.: Environmental factors affecting dust emissions by
wind erosion, Saharan Dust, C. Morales, Ed., Wiley, 71–94, 1979.
Ginoux, P., Chin, M., Tegen, I., Prospero, J. M., Holben, B., Dubovik, O., and Lin, S.J.: Sources and distributions of dust aerosols simulated with the GOCART model, J. Geophys. Res., 106 (D17), 20 255–20 273, 2001.
Ginoux, P., Prospero, J. M., Torres, O., and Chin, M.: Long-term simulation of dust distribution with the GOCART model: Corre-lation with the North Atlantic OscilCorre-lation, Environmental Mod-eling and Software, 19, 113–128, 2004.
Girolamo, Di. L., Bond, T. C., Bramer, D., et al.: Analysis of Multi-angle Imaging SpectroRadiometer (MISR) aerosol optical depths over greater India during winter 2001–2004, Geophys. Res. Lett., 31, L23115, doi:10.1029/2004GL021273, 2004.
Gong, S. L., Zhang, X. Y., Zhao, T. L., McKendry, I. G., Jaffe, D. A., and Lu, N. M.: Characterization of soil dust aerosol in China and its transport and distribution during 2001 ACE-Asia: 2. Model simulation and validation, J. Geophys. Res., 108, doi:10.1029/2002JD002633, 2003.
Haywood, J. and Boucher, O.:, Estimates of the direct and indirect radiative forcing due to tropospheric aerosols: A review, Rev. Geophys., 38 (4), 513–543, 2000.
Haywood, J. M., Francis, P. N., Glew, M. D., and Taylor, J. P.: Optical properties and direct radiative effect of Saharan dust: A case study of two Saharan dust outbreaks using aircraft data, J. Geophys. Res., 106 , D16, 18 417, doi:10.1029/2000JD900319, 2001.
60 S. Deepshikha et al.: Dust aerosols over India from METEOSAT infrared radiance – Part I
Haywood, J., Francis, P., Osborne, S., Glew, M., Loeb, N., High-wood, E., Tanr´e, D., Myhre, G., Formenti, P., and Hirst, E.: Ra-diative properties and direct raRa-diative effect of Saharan dust mea-sured by the C-130 aircraft during SHADE: 1. Solar spectrum, J. Geophys. Res., 108(D18), 8577, doi:10.1029/2002JD002687, 2003.
Heintzenberg, J. R., Charlson, R. J., Clarke, A. D., Liousse, C., Ra-maswamy, V., Shine, K. P., and Wendisch, M.: Measurement and modeling of aerosol singlre scattering albedo: Progress, prob-lems and prospects, Contrib. Atmos, Phys., 70, 249–264, 1997. Helgren, D. A. and Prospero, J. M.: Wind velocities associated with
dust deflation events in the western Sahara, J. Climate Applied Meteorol., 26, 1147–1151, 1987.
Hess, M., Koepke, P., and Schult, I.: Optical properties of aerosols and clouds: The software package OPAC, Bulletin of Am. Mete-orol. Soc., 79, 831–844, 1998.
Holben, B. N., Eck, T. F., Slutsker, I., et al.: AERONET-A federated instrument network and data archive for aerosol characterization, Remote Sens. Environ., 66, 1–16, 1998.
Hsu, N. C., Tsay, S. C., King, M. D., et al.:Aerosol properties over bright-reflecting source regions, IEEE Trans. Geosci. Rem. Sens., 42(3), 557–569, 2004.
Intergovernmental Panel on Climate Change, Climate Change 1994: Radiative Forcing of Climate, report to IPCC from the Scientific assessment Group (WGI), Cambridge Univ. Press, New York, 2001.
Jacobson, M. Z.: Strong Radiative heating due to the mixing state of black carbon in atmospheric aerosols. Nature, 409, 695–697, 2001.
Jaenicke, R.: Natural aerosols, Annuals of the New York Academy of Science, 317–329, 1980.
Jaenicke, R.: Tropospheric aerosols. in: Aerosol-Cloud-Climate In-teractions, edited by: Hobbs, P. V., Academic Press, NewYork, 1–31, 1993.
Junge C. E.: Our knowledge of the Physico-Chemistry of aerosols in the undisturbed marine environment, J. Geophys. Res., 77, 5183–5200, 1972.
Kalu, A. E.: The African dust plume: its characteristics and propa-gation across West Africa in winter, in: Saharan Dust: Mobilisa-tion, transport, deposition: papers and recommendations from a workshop held in Gothenburg, Sweden, 25–28 April 1977, edited by: Morales, C., Wiley, 1979.
Kaufman, Y. J.: Remote sensing of direct and indirect aerosol forc-ing, in: Aerosol Forcing of Climate: Report of the Dahlem Work-shop on Aerosol Forcing of Climate, Berlin 1994, April 24-29, edited by: Charlson, R. J. and Heintzenberg, J., 297–332, 1995. Kaufman, Y. J., Tanr´e, D., Gordon, H. R., et al.: Passive remote
sensing of tropospheric aerosol and atmospheric correction for the aerosol effect, J. Geophys. Res., 102 (D14), 16 815–16 830, 1997.
Kaufman, Y. J., Tanr´e, D., Dubovik, O., et al.: Absorption of sun-light by dust as inferred from satellite and ground-based remote sensing, Geophys. Res. Lett., 28 , 1479–1483, 2001.
Kaufman, Y. J., Tanr´e, D., and Boucher, O.: A satellite view of aerosols in the climate system, Nature, 419 (6903), 215–223, 2002.
Lacis, A. A. and Mishchenko, M. I.: Climate forcing, climate sen-sitivity, and climate response: a radiative modeling perspective on atmospheric aerosols, in: Aerosol Forcing of Climate: Report of the Dahlem Workshop on Aerosol Forcing of Climate, Berlin 1994, April 24-29, edited by: Charlson, R. J. and Heintzenberg, J. 11–42, 1995.
Legrand, M. : Etude des brumes seches sur I’Afrique de I’Quest a l’aide de Meteosat-I, Meteorology, VI, 29–30, 153–159, 1983. Legrand, M.: Dust clouds over west Africa: A characterization by
satellite data, Ann. Geophys., 3, 777–784, 1985.
Legrand, M.: The potential of infrared satellite data for the retrieval of Saharan-dust optical depth over Africa, J. Appl. Meteorol., 28, 309–319, 1989.
Legrand, M.: Thermal impact of Saharan dust over land, Part-II, Application to satellite IR remote sensing, J. Appl. Meteorol., 31, 181–193, 1992.
Legrand, M., N’Doume, C., and Jankowiak, I.: Satellite-derived cli-matology of the Saharan aerosol, Passive Infrared remote sensing of clouds and the atmosphere II, edited by: Lynch, D. K., Proc. SPIE 2309, 127–135, 1994.
Legrand, M., Plana-Fattori, A., and N’doume, C. : Satellite detec-tion of dust using the IR imagery of Meteosat 1. Infrared dif-ference dust index, J. Geophys. Res., 106 (D16), 18 251–18 274, 2001.
Leon, F. and Legrand, M.: Mineral dust sources in the surround-ings of the north Indian Ocean, Geophys. Res. Lett., 30, 1309, doi:10.1029/2002GL016690, 2003.
Li, X., Maring, H., Savoie, D., Voss, K., and Prospero, J. M.: Dom-inance of Mineral Dust in Aerosol light-scattering in the North Atlantic Trade Winds, Nature, 380, 416–422, 1996.
Li, F., Vogelmann, A. M., and Ramanathan, V.: Saharan dust aerosol radiative forcing measured from space, J. Climate, 17 (13), 2558–2571, 2004.
Liao, H. and Seinfeld, J. H.: Radiative forcing by mineral dust aerosols: sensitivity to key variables, J. Geophys. Res., 103, 31 637–31 645, 1998.
Maley, J.: Dust, clouds, rain types, and climatic variations in tropi-cal North Africa, Quaternary Research, 18, 1–16, 1982. Martonchik, J. V.: Comparison of MISR and AERONET aerosol
optical depths over desert sites, Geophys. Res. Lett., 31 (16), art. no. L16102, 2004.
McTainsh, G. H.: Harmattan dust deposition in northern Nigeria, Nature, 286, 587–588, 1980.
Miller, R. L. and Tegen I.: Radiative forcing of a tropical direct circulation by soil dust aerosols, J. Atmos. Sci., 56 (14), 2403– 2433, 1999.
Miller, R. L., Tegen, I., and Perlwitz, J.: Surface radiative forcing by soil dust aerosols and the hydrologic cycle, J. Geophys. Res., 109 (D4), art. no. D04203, 2004.
Mohalfi, S., Bedi, H. S., and Krishnamurti, T. N.: Impact of short wave radiative effects of dust aerosols on the summer season heat low over Saudi Arabia, Monthly Weather Rev., 126, 3153–3168, 1998.
Moorthy, K. K., Sunilkumar, S. V., Pillai, P. S., et al.: Win-tertime spatial characteristics of boundary layer aerosols over peninsular India, J. Geophys. Res., 110 (D8), art. no. D08207, doi:10.1029/2004JD005520, 1-11, 2005.
Moulin, C., Lambert, C. E., and Dayan, U., et al.: Satellite climatol-ogy of African dust transport in the Mediterranean atmosphere, J. Geophys. Res., 103, 13 137–13 143, 1998.
Nickling, W. G. and Gillies, J. A.: Emission of dust from desert soils, in: Paleoclimatology and Paleometeorology: Modern and Past Patterns of Global Atmospheric Transport, edited by: Leinen, M. and Sarnthein, M., 133–165, Kluwer, 1989. N’Tchayi, M. G., Bertrand, J. J., and Nicholson, S. E.: The diurnal
and seasonal cycles of wind-borne dust over Africa north of the equator, J. Appl. Meteorol. 36, 868–882, 1997.
S. Deepshikha et al.: Dust aerosols over India from METEOSAT infrared radiance – Part I 61
upwelling regions, J. Aerosol Science, 18, 277–290, 1987. Petit, R. H., Legrand, M., Jankowiak, I., et al.: Transport of Saharan
dust over the Caribbean islands: study of an event, J. Geophys. Res., 110 (D18), art. no. D18S09, 1–9, 2005.
Prospero, J. M., Charlson, R. J., Mohnen, V., Jaenicke, R., Delany, A. C., Moyers, J., Zoller, W., and Rahn, K.: The atmospheric aerosol system – an overview, Rev. Geophys. Space Phys., 21, 1607–1629, 1983.
Prospero, J. M.: African dust in America, Geotimes, 46 (11), 24– 27, 2001.
Prospero, J. M., Ginoux, P., Torres, O., et al.: Environmental char-acterization of global sources of atmospheric soil dust identified with the Nimbus 7 Total Ozone Mapping Spectrometer (TOMS) absorbing aerosol product, Rev. Geophys., (1), art. no. 1002 AUG-SEP, 1–22, 2002.
Prospero, J. M.: Global dust transport over the oceans: The link to climate, Geochimica Et Cosmochimica Acta, 67 (18), A384-A384 Supp., 2003.
Prospero, J. M. and Lamb, P. J.: African droughts and dust trans-port to the Caribbean: Climate change implications, Science, 302 (5647), 1024–1027, 2003.
Satheesh S. K. and Ramanathan, V.: Large differences in tropical aerosol forcing at the top of the atmosphere and earth’s surface, Nature, 405, 60–63, 2000.
Satheesh, S. K., and Srinivasan, J.: Enhanced aerosol loading over Arabian Sea during pre-monsoon season: Natural or An-thropogenic?, Geophys. Res. Lett., doi:10.1029/2002GL015687, 2002.
Satheesh, S. K and Moorthy, K. K.: Radiative Effects of natural Aerosols, Atmospheric Environment, 39, 2089–2110, 2005. Satheesh, S. K., Krishna Moorthy, K., Kaufman Y. J., et al.: Aerosol
Optical Depth, Physical Properties and Radiative Forcing over the Arabian Sea, Meteorol. Atmos. Phys., April, 45–62, 2005. Schollaert, S. E. and Merrill, J. T.: Cooler seas surface west of the
Sahara Desert correlated to dust events, Geophys. Res. Lett., 25 (18), 3529–3532, 1998.
Seinfeld, J. H., Carmichael, G. R., Arimoto, R., et al.: Regional Climatic and Atmospheric Chemical Effects of Asian Dust and Pollution, Bull. Amer. Meteorol. Soc., 367–380, 2004.
Shaw, G. E.: Transport of Asian desert Aerosol to the Hawaiian Islands, J. Appl. Meteorol., 19, 1254–1259, 1980.
Shaw, G. E., Benner, R. L., Cantrell, W., et al.: The regulation of climate: A sulfate particle feedback loop involving deep convec-tion – An editorial essay, Climate Change, 39 (1), 23–33, 1998. Shenk, W. E., and Curran, R. J.: The detection of dust storms over
land and water with satellite visible and infrared measurements, Mon. Weather rev., 102, 830–837, 1974.
Sokolik, I. N., Toon, O. B., and Bergstrom, R. W.: Modeling the radiative characteristics of airborne mineral aerosols at infrared wavelengths, J. Geophys. Res., 103 (D8), 8813–8826, 1998. Tanr´e, D. and Legrand, M.: On the satellite retrieval of Saharan
dust optical thickness over land: Two different approaches, J. Geophys. Res., 96, 5221–5227, 1991.
Tanr´e, D., Kaufman, Y. J., and Holben, B. N.: Climatology of dust aerosol size distribution and optical properties derived from remotely sensed data in the solar spectrum, J. Geophys. Res., 106(D16), 18 205–1 8217, 2001.
Tanr´e, D., Haywood, J., Pelon, J., et al.: Measurement and modeling of the Saharan dust radiative impact: Overview of the Saharan Dust Experiment (SHADE), J. Geophys. Res., 108(D18), 8574, doi:10.1029/2002JD003273, 2003.
Tegen, I. and Fung, I.: Modelling of Mineral Dust in the Atmo-sphere: Sources, Transport, and Optical Thickness, J. Geophys. Res., 99, 22 897–22 914, 1994.
Tegen, I. and Miller, R. A.: general circulation model study on the inter-annual variability of soil dust aerosol, J. Geophys. Res., 103 (D20), 25 975–2 5995, 1998.
Tegen, I., Werner, M., Harrison, S. P., and Kohfeld, K. E.: Rela-tive importance of climate and land use in determining present and future global soil dust emission, Geophys. Res. Lett., 31, L05105, doi:10.1029/2003GL019216, 2004.
Tripathi, S. N., Dey, S., Tare, V. and Satheesh S. K.: Aerosol black carbon radiative forcing at an industrial city in northern India, Geophys. Res. Lett., 32 (8), art. no. L08802, 1–4, 2005. Zender, C. S., Bian, H., and Newman, D.: Mineral Dust
En-trainment and Deposition (DEAD) model: Description and 1990s dust climatology, J. Geophys. Res., 108(D14), 4416, doi:10.1029/2002JD002775, 2003.
Zhang, J. L. and Christopher, S. A.: Long wave radiative forcing of Saharan dust aerosols estimated from MODIS, MISR, and CERES observations on Terra, Geoephys. Res. Lett., 30 (23), art. no. 2188, 1–4, 2003.