HAL Id: hal-00304241
https://hal.archives-ouvertes.fr/hal-00304241
Submitted on 9 Jun 2008HAL is a multi-disciplinary open access
archive for the deposit and dissemination of sci-entific research documents, whether they are pub-lished or not. The documents may come from teaching and research institutions in France or abroad, or from public or private research centers.
L’archive ouverte pluridisciplinaire HAL, est destinée au dépôt et à la diffusion de documents scientifiques de niveau recherche, publiés ou non, émanant des établissements d’enseignement et de recherche français ou étrangers, des laboratoires publics ou privés.
Validation of water vapour transport in the tropical
tropopause region in coupled Chemistry Climate Models
S. Kremser, M. Rex, U. Langematz, M. Dameris, I. Wohltmann
To cite this version:
S. Kremser, M. Rex, U. Langematz, M. Dameris, I. Wohltmann. Validation of water vapour transport in the tropical tropopause region in coupled Chemistry Climate Models. Atmospheric Chemistry and Physics Discussions, European Geosciences Union, 2008, 8 (3), pp.10999-11037. �hal-00304241�
ACPD
8, 10999–11037, 2008 Water vapour transport in CCMs S. Kremser et al. Title Page Abstract Introduction Conclusions References Tables Figures ◭ ◮ ◭ ◮ Back CloseFull Screen / Esc
Printer-friendly Version Interactive Discussion
Atmos. Chem. Phys. Discuss., 8, 10999–11037, 2008 www.atmos-chem-phys-discuss.net/8/10999/2008/ © Author(s) 2008. This work is distributed under the Creative Commons Attribution 3.0 License.
Atmospheric Chemistry and Physics Discussions
Validation of water vapour transport in the
tropical tropopause region in coupled
Chemistry Climate Models
S. Kremser1, M. Rex1, U. Langematz2, M. Dameris3, and I. Wohltmann1
1
Stiftung Alfred-Wegener Institute for Polar and Marine Research, Potsdam, Germany
2
Institut f ¨ur Meteorologie, Freie Universit ¨at Berlin, Berlin, Germany
3
Institut f ¨ur Physik der Atmosph ¨are, DLR-Oberpfaffenhofen, Wessling, Germany Received: 1 February 2008 – Accepted: 29 May 2008 – Published: 9 June 2008 Correspondence to: M. Rex ([email protected])
ACPD
8, 10999–11037, 2008 Water vapour transport in CCMs S. Kremser et al. Title Page Abstract Introduction Conclusions References Tables Figures ◭ ◮ ◭ ◮ Back CloseFull Screen / Esc
Printer-friendly Version Interactive Discussion Abstract
In this study backward trajectories from the tropical lower stratosphere were calcu-lated for the Northern Hemisphere (NH) winters 1995–1996, 1997–1998 (El Ni ˜no) and 1998–1999 (La Ni ˜na) and summers 1996, 1997 and 1999 using both ERA-40 reanal-ysis data of the European Centre for Medium-Range Weather Forecast (ECMWF) and
5
coupled chemistry climate model (CCM) data. The calculated trajectories were ana-lyzed to determine the distribution of points where individual air masses encounter the minimum temperature and thus minimum water vapour mixing ratio during their ascent through the tropical tropopause layer (TTL) into the stratosphere. The geographical distribution of these dehydration points and the local conditions there determine the
10
overall water vapour entry into the stratosphere. Results of two CCMs are presented: the ECHAM4.L39(DLR)/CHEM (hereafter: E39/C) from the German Aerospace Center (DLR) and the Freie Universit ¨at Berlin Climate Middle Atmosphere Model with interac-tive chemistry (hereafter: FUB-CMAM-CHEM). In the FUB-CMAM-CHEM model the minimum temperatures are overestimated by about 7 K in Northern Hemisphere (NH)
15
winter as well as in NH summer, resulting in too high water vapour entry values com-pared to ERA-40. However, the geographical distribution of dehydration points is fairly reproduced for NH winter 1995–1996 and 1998–1999 and in all boreal summers. The distribution of dehydration points suggests an influence of the Indian monsoon upon the water vapour transport. The E39/C model displays a temperature bias of about
20
+3 K. Hence, the minimum water vapour mixing ratios are higher relative to ERA-40. The geographical distribution of dehydration points is satisfactory in NH winter 1995– 1996 and 1997–1998 with respect to ERA-40. The distribution is not reproduced for the NH winter 1998–1999 (La Ni ˜na event) compared to ERA-40. There is excessive mass flux through warm regions e.g. Africa, leading to excessive water vapour flux in the NH
25
winter and summer. The possible influence of the Indian monsoon on the transport is not seen in the boreal summer. Further, the residence times of air parcels in the TTL were derived from the trajectory calculations. The analysis of the residence times
ACPD
8, 10999–11037, 2008 Water vapour transport in CCMs S. Kremser et al. Title Page Abstract Introduction Conclusions References Tables Figures ◭ ◮ ◭ ◮ Back CloseFull Screen / Esc
Printer-friendly Version Interactive Discussion
reveals that in both CCMs residence times in the TTL are underestimated compared to ERA-40 and the seasonal variation is hardly present.
1 Introduction
Water vapour is the most important greenhouse gas (GHG) in the atmosphere. In con-trast to tropospheric warming, water vapour leads to a radiative cooling in the
strato-5
sphere (Forster and Shine, 1999). An increase in stratospheric water vapour also changes the stratospheric ozone distribution by changing radical driven ozone loss cycles in the lower stratosphere and increasing polar ozone loss by enhancing the effectiveness of the heterogeneous reactions that destroy ozone there (Oltmans and
Hofmann,1995).
10
Water vapour in the stratosphere results from two processes. About one third or less (depending on altitude and latitude) comes from the oxidation of methane. But the majority of stratospheric water vapour comes from the direct flux of water vapour from the troposphere into the stratosphere through the tropical tropopause layer (TTL) (c.f. Sect. 1.1). The humid tropospheric air is freeze dried when moving through the
15
cold tropical tropopause (e.g. Brewer,1949), a process that is very sensitive to tem-perature and the interaction between horizontal and vertical transport of air in the TTL. Hence, small changes in the thermal structure or the dynamical properties of this re-gion of the atmosphere can have a large impact on stratospheric water vapour fields and therefore significantly couple to the ozone layer and global climate. In Chemistry
20
Climate Models (CCM) a correct representation of the processes that determine the flux of water vapour through the TTL is essential for projections of the impact of these coupling mechanisms in a changing climate.
In this study a Lagrangian trajectory module is used to diagnose the representation of water vapour transport through the TTL in two CCMs and to compare it to similar
25
calculations that are designed to give the closest representation of these processes in the real atmosphere that can be achieved.
ACPD
8, 10999–11037, 2008 Water vapour transport in CCMs S. Kremser et al. Title Page Abstract Introduction Conclusions References Tables Figures ◭ ◮ ◭ ◮ Back CloseFull Screen / Esc
Printer-friendly Version Interactive Discussion
1.1 Processes in the TTL
Today it is generally accepted that based on the study byBrewer(1949) air enters the stratosphere primarily in the tropics within the TTL (Fueglistaler et al.,2005). The TTL describes the transition from the humid, turbulent troposphere to the dry, stable strato-sphere. There are multiple definitions of the TTL. Following Highwood and Hoskins 5
(1998), the TTL extends from the main convective outflow (∼14 km) to the cold point of the tropopause (CPT) at an altitude of about 17 km. Air is basically tropospheric below this level and stratospheric above this level (Gettelman and Forster,2002a). Thus this region is vital in studying water vapour transport into the stratosphere. In the lower part of the TTL convection dominates the vertical transport and in the upper part radiative
10
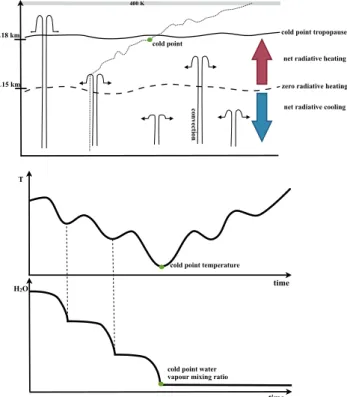
processes determine the vertical transport (Gettelman et al.,2004). This is illustrated schematically in Fig. 1 (top panel). Past investigations show that overshooting convec-tion into the interior of the TTL is not a common occurrence (Gettelman and Holton,
2001b) suggesting that most air masses ascend through the coldest region in slow
ra-diatively driven diabatic motion. Using backward trajectory calculations extending back
15
from a stratospheric level (Fig. 1, top panel) to examine the transport processes in the TTL has the advantage that one can focus on the transport through the cold point into the stratosphere without being affected by tropospheric processes (e.g. convection). The individual cold point for each trajectory coincides with the temperature minimum along the trajectory and is termed the dehydration point. Microphysical processes and
20
sedimentation of ice particles reduce the water vapour in the air mass to a minimum in this point and behind this point the water vapour content in the air mass has no memory to the air mass history before, with the exception of a speculative contribution of par-ticulate water entry into the stratosphere (e.g.,Sherwood and Dessler,2000;Notholt
et al.,2005) which would depend on aerosol density – this process is not considered
25
here. Hence, only the conditions in the dehydration point determine the direct entry of water vapour into the stratosphere (Fig. 1).
ACPD
8, 10999–11037, 2008 Water vapour transport in CCMs S. Kremser et al. Title Page Abstract Introduction Conclusions References Tables Figures ◭ ◮ ◭ ◮ Back CloseFull Screen / Esc
Printer-friendly Version Interactive Discussion
1.2 Past investigations of trajectory calculations
First, (Gettelman et al.,2002b) used 10 day backward trajectories to explore the rela-tionship between the observed variation of temperature and water vapour in the TTL.
Bonazzola and Haynes (2004) have also calculated trajectories based on ECMWF
operational data to determine patterns of transport and encountered temperatures,
5
showing that both effects must be taken into account for understanding variability and changes of stratospheric water vapour. In addition, they examined interannual variabil-ity and found that air masses are dehydrated more efficiently in cold La Ni ˜na relative to warmer El Ni ˜no years. Also using ECMWF backward trajectoriesFueglistaler et al.
(2004) then demonstrated that estimates of water vapour mixing ratios of air entering
10
the stratosphere were in good agreement with satellite observations. The analysis by
Fueglistaler et al. (2004) highlighted the importance of particular geographical areas
for tropical troposphere to stratosphere transport (TST), finding that the western Pacific is the dominant contributor to stratospheric air. In a subsequent study,Fueglistaler et
al. (2005) presented backward trajectory calculations in the tropics based on ECMWF
15
ERA-40 data between 1979 and 2001 determining that stratospheric water vapour mix-ing ratios are in good agreement with various balloon and satellite measurements. The study by Hatsushika and Yamazaki (2003) used trajectory calculations based on at-mospheric general circulation model data (AGCM) to investigate the entry process of air parcels from the tropical troposphere to the stratosphere and to examine the
de-20
hydration process during their ascent through the TTL.Kr ¨uger et al.(2007) calculated trajectories based on diabatic heating/cooling rates to present long term climatology of transport processes in the upper part of the TTL.
1.3 Vertical transport
In CCMs species transport is implemented by using an advection scheme that is driven
25
by the three dimensional wind field. Uncertainties in the modeled water vapour entry into the stratosphere come from uncertainties in the temperature fields, uncertainties
ACPD
8, 10999–11037, 2008 Water vapour transport in CCMs S. Kremser et al. Title Page Abstract Introduction Conclusions References Tables Figures ◭ ◮ ◭ ◮ Back CloseFull Screen / Esc
Printer-friendly Version Interactive Discussion
in the wind fields and numerical properties of the advection scheme, like numerical diffusion. The tropopause is a region of extremely steep vertical gradients in water vapour mixing ratios and vertical diffusion from the numerical properties of the advec-tion scheme can obscure problems with the more physically based dynamical proper-ties like temperature or wind fields. To isolate the dynamical properproper-ties of the model
5
from the effect of numerical diffusion the Lagrangian trajectory module driven by the wind and temperature fields of the CCMs is used to advect water vapour through the TTL. Since the advection schemes in the CCMs are driven by the three dimensional wind fields including the vertical winds, the trajectory calculations that are used to di-agnose transport in the CCMs are also driven by the vertical winds.
10
To evaluate the representation of the water vapour transport in CCMs, the calcu-lations mentioned above are compared with similar calcucalcu-lations that are designed to reflect the processes in the real atmosphere as close as possible. These calculations are driven by meteorological reanalysis data from ECMWF (ERA-40) (Uppala et al.,
2005). ERA-40 reanalysis data are currently the best available long-term dataset for
15
the intention of this study even though past investigations show that ERA-40 reanalysis data display uncertainties in the temperature and wind field compared to observations (e,g.,Christensen et al.,2007). But these are strongest in the stratosphere of the polar regions (Parrondo et al., 2007) and relatively small in the tropical tropopause region (e,g.,Christensen et al.,2007).
20
Vertical winds from analysis data often suffer from excessive noise and errors in their mean magnitude, which results in vertical diffusion many orders of magnitude larger than observed and overall unrealistic vertical transport. Wohltmann and Rex (2007) showed that trajectory calculations using calculated diabatic heating rates to drive verti-cal transport are much more realistic. These are termed diabatic trajectories in contrast
25
to trajectories that are driven by vertical winds, which are termed kinematic trajectories. These results are in line with the earlier work bySchoeberl et al.(2003) who also con-cluded that diabatic trajectories are closest to reality. Hence the calculations based on ERA-40 data that are designed to reflect the real atmosphere are driven by diabatic
ACPD
8, 10999–11037, 2008 Water vapour transport in CCMs S. Kremser et al. Title Page Abstract Introduction Conclusions References Tables Figures ◭ ◮ ◭ ◮ Back CloseFull Screen / Esc
Printer-friendly Version Interactive Discussion
heating rates.
1.4 Residence time
Besides examining the water vapour transport, the residence time of the air parcels in the upper part of the TTL was determined. The residence time is equivalent to the time that each air parcel resides in the TTL. This is an important parameter/measurement for
5
short lived chemical compounds which can reach the stratosphere and thus can have a major impact on stratospheric chemistry (such as very short lived bromine species (WMO, 2007)). The residence time allows to assess which compounds can reach the stratosphere chemically unaltered and which species will be chemically processed before reaching the stratosphere. Due to the weaker Brewer-Dobson Circulation (BDC)
10
in NH summer than in NH winter (Bonazzola and Haynes,2004), it is expected that in NH summer the residence times of the parcels are longer than in NH winter.
In the lower TTL tropospheric processes (e.g. convection) dominate, which decline rapidly with height (Gettelman et al.,2004). Convection still contributes significantly to the vertical transport in the lower part of the TTL and therefore the diabatic trajectories
15
give inaccurate results. In the upper part of the TTL the radiative balance of the TTL determines the strength and direction of the vertical motion (Gettelman et al.,2004) and therefore convective transport is less likely to be important for the vertical transport.
This paper is organized as follows; in Sect. 2 the data and method used for the tra-jectory calculations are described. The results are presented and discussed in Sect. 3.
20
Conclusions and a brief outlook are provided in Sect. 4.
2 Data and method
2.1 ERA-40 reanalysis data and model data
The ERA-40 dataset, available every 6 h, covers the period from 1957 to August 2002. The data were produced from the ECMWF in collaboration with many institutions. We
ACPD
8, 10999–11037, 2008 Water vapour transport in CCMs S. Kremser et al. Title Page Abstract Introduction Conclusions References Tables Figures ◭ ◮ ◭ ◮ Back CloseFull Screen / Esc
Printer-friendly Version Interactive Discussion
have extracted the data on a 2◦
×2◦latitude-longitude grid. In the vertical a hybrid σ − p coordinate system with 60 levels is used (for a detailed description see Uppala et al. [2005]).
Model data were provided from two CCMs:
– E39/C: The E39/C model is operated at the German Aerospace Center (DLR). 5
The E39/C model has a spectral horizontal resolution of T30, which is a resolution of 3.75◦
×3.75◦ in the corresponding Gaussian grid. The E39/C model has a hybrid σ−p coordinate system. In the vertical the model has 39 layers and the top of the model is centered at 10 hPa (∼30 km). The vertical resolution in the extra tropical tropopause region is approximately 700 m (Hein et al., 2001).
10
The transient simulations of the E39/C model cover the 40 year period between 1960 and 1999. Based on observations, several boundary conditions are prescribed (e.g. sea surface temperature (SST), greenhouse gas and halogen concentrations). The E39/C model is described in detail by (Dameris et al.,2005).
15
– FUB-CMAM-CHEM: The model is based on the Freie Universit ¨at Berlin Climate
Middle Atmosphere Model, described in detail by Pawson et al. (1998). It has been updated and coupled to an interactive chemistry module as described in
Langematz et al.(2005). The FUB-CMAM-CHEM has been run at T21 horizontal
resolution, corresponding to 5.6◦
×5.6◦in a Gaussian longitude-latitude grid. In the
20
vertical a hybrid σ − p coordinate system is used with 34 levels from the surface up to the top at 84 km. The vertical distance between two layers is 2 km in the tropopause region and 3.5 km in the middle atmosphere. The simulations cover the period from 1980 to 1999 and was run with transient boundary conditions for SSTs, GHGs and halogens.
25
Both CCMs are based on the same dynamical model, the ECHAM general circulation model, developed at Max-Planck-Institut for Meteorology. The models differ in their horizontal and vertical resolutions of the analyzed integrations, the vertical domain,
ACPD
8, 10999–11037, 2008 Water vapour transport in CCMs S. Kremser et al. Title Page Abstract Introduction Conclusions References Tables Figures ◭ ◮ ◭ ◮ Back CloseFull Screen / Esc
Printer-friendly Version Interactive Discussion
as well as in details of the physical parameterizations. While FUB-CMAM-CHEM pro-vides a better representation of the physics and dynamics of the upper stratosphere and mesosphere which is important for representing tropical transport by the Brewer-Dobson-Circulation, E39/C provides the better vertical representation at the tropical tropopause and includes updated parameterizations of tropical deep convection
com-5
pared to the FUB-model. 2.2 Trajectory models
Two types of trajectories were calculated: kinematic and diabatic trajectories. In the ”kinematic method” air parcels are transported horizontally on pressure surfaces and the vertical motion across these surfaces is generated by the vertical wind. Since the
10
water vapour transport by advection schemes in the CCMs is driven by vertical winds, kinematic trajectories were calculated with CCM data. The vertical wind is calculated from the continuity equation. Since horizontal winds are many orders of magnitude larger than the vertical wind, small errors in the horizontal wind field can lead to large errors in the vertical wind (Wohltmann and Rex,2007).
15
In the second approach, the ”diabatic method”, the propagation of horizontal wind errors into the vertical is avoided. In stable stratified regions like the TTL and strato-sphere one can use the potential temperature as vertical coordinate instead of the pressure. Thus, the horizontal transport takes place on isentropic surfaces and radia-tive heating rates are applied as vertical velocity. With the reanalysis data ERA-40
20
both approaches were used but only results from the diabatic calculations are shown because they better represent reality (c.f. Sect. 1.3).
2.3 Simulations
Backward trajectories initialized in the lower stratosphere at Θ=400 K were calculated. The trajectories were started between 30◦N and 30◦S for all longitudes on a 2◦
×2◦
25
ACPD
8, 10999–11037, 2008 Water vapour transport in CCMs S. Kremser et al. Title Page Abstract Introduction Conclusions References Tables Figures ◭ ◮ ◭ ◮ Back CloseFull Screen / Esc
Printer-friendly Version Interactive Discussion
Haynes (2004) andKr ¨uger et al.(2007). Trajectories were calculated for 89 days (with an integration time step of 10 min) and the position (longitude/latitude), pressure (p), temperature (T ) and potential temperature (Θ) were stored every 2 h. The temperature minimum along the trajectory path was calculated, the potential temperature and the location where it occurs were stored.
5
For the trajectory analysis only trajectories that stayed at least 2 days below Θ=365 K (upper troposphere) and rise from the upper troposphere to the lower stratosphere (Θ=400 K) in the 89 days were considered. These set of trajectories is referred to as the ”troposphere-to-stratosphere” (TS) trajectories (using the terminology ofBonazzola
and Haynes,2004). Trajectories that do not reach the troposphere, and do not
con-10
tribute to the troposphere to stratosphere transport, are not analysed. The number of TS trajectories is lower in NH summer than in NH winter (not shown). Particularly, for the ERA-40 reanalysis data the lowest percentages of TS diabatic trajectories obtained in the NH summer. This corresponds to the weaker BDC in NH summer than in NH winter (Bonazzola and Haynes,2004).
15
The humidity of air that enters the stratosphere is given by the minimum water vapour mixing ratio (χH
2O mi n) assumed along the trajectory during its ascent. Here χH2O mi nis
estimated from saturation vapour pressure over ice at the temperature minimum.
χH
2O mi n=
ps
pcold point (1)
where ps is the saturation pressure of water vapour and pcold pointis the ambient
pres-20
sure. The saturation pressure was calculated by the equation given in Marti and
Mauersberger (1993) which allows the calculation of the water vapour pressure be-tween 170 K and the triple point of water, with an accuracy of about 2% (Marti and
Mauersberger,1993):
ps= 10−2663.5T +12.537 (2)
25
in which p is in hPa and T in K. This approach neglects supersaturation and non-equilibrium processes. These can enhance the water vapour entry into the
strato-ACPD
8, 10999–11037, 2008 Water vapour transport in CCMs S. Kremser et al. Title Page Abstract Introduction Conclusions References Tables Figures ◭ ◮ ◭ ◮ Back CloseFull Screen / Esc
Printer-friendly Version Interactive Discussion
sphere slightly but predominantly in the form of a relatively flat scaling factor. Since we are comparing the results from the runs that are driven by CCM data with calculations that are based on the same assumptions, a flat scaling of the water vapour shown in all figures does not have an impact on the conclusions.
In addition, the residence times of air parcels in the TTL were derived from the
trajec-5
tory calculations. The results for the upper TTL (layer from Θ=385–395 K) are shown. For the computation of the residence time the number of time steps for which a trajec-tory was located in the corresponding layer was counted. By multiplying by the time step length (10 min), the residence time of a trajectory in the corresponding layer was determined.
10
Trajectories for the (NH) winters 1995–1996, 1997–1998 and 1998–1999 (started on 28 February) and for the NH summer 1996 (started on 30 August) were calculated. These years were chosen because they allow the comparison of transport processes between winter and summer, and for NH winters the comparison of different phases of the El Ni ˜no Southern Oscillation (ENSO). ENSO changes the temperatures and the
15
circulation of the tropical tropopause region and the convective activity in the tropics (e.g.,Gettelman et al.,2001a). NH winter 1997–1998 corresponds to El Ni ˜no condi-tions, while the NH winter 1998–1999 corresponds to La Ni ˜na conditions. In NH winter 1995–1996 ENSO was in a neutral phase.
3 Results and discussion
20
3.1 NH Winter 1995–1996
Figures 2, 3 and 4 show results from the NH winter 1995–1996 (neutral ENSO). The reference calculations (those based on ERA-40 reanalysis data) are shown in Fig. 2, while Fig. 3 and 4 contain the results from the calculations based on the CCMs. The geographical distribution of dehydration points is shown in the panels (a) and (b),
re-25
ACPD
8, 10999–11037, 2008 Water vapour transport in CCMs S. Kremser et al. Title Page Abstract Introduction Conclusions References Tables Figures ◭ ◮ ◭ ◮ Back CloseFull Screen / Esc
Printer-friendly Version Interactive Discussion
the corresponding equilibrium water vapour mixing ratio. Note that the values from FUB (Fig. 4b) were divided by a factor of two to match up with the common color scale. In order to make an assessment of the contribution of the different geographical re-gions to the overall stratospheric water vapour, the investigation area was divided in 10◦
×5◦(longitude x latitude) grid boxes. The trajectories reaching their individual
dehy-5
dration points in a grid cell were identified. The total water vapour transported into the stratosphere by these trajectories was divided by the overall water vapour transported into the stratosphere by all TS trajectories. This fraction is shown in panels (c) of the figures. Hence, the numbers shown there represent the fraction of water molecules in the stratosphere that encountered their last contact with the ice phase in the respective
10
geographical region. Since temperatures during the last contact with the ice phase determine water vapour mixing ratios that remain in the gas phase, stratospheric wa-ter vapour mixing ratios are particularly sensitive to temperatures in regions where the values shown in panels (c) are large. Panels (d) illustrate the longitudinal distribution of the water vapour entry, i.e. the values from (c) integrated over all latitudes (from 30◦N
15
to 30◦S) per 60◦longitude bin. The arrangement of these panels does not change for the other years/seasons.
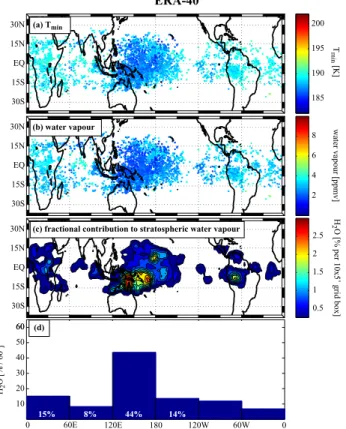
In the neutral NH winter 1995–1996, the reference calculations (Fig. 2) indicate that the region with particularly low temperatures occurs over the West Pacific (here defined between 120◦E and 180◦), seen in Fig. 2a. Figure 2b shows that the dehydration points
20
in the West Pacific have equilibrium water vapour mixing ratios lower than ∼2 ppvm. These values increase to the west and east but do not 5 ppvm. The mean mixing ratio over all TS trajectories in the reference calculation is 2.6 ppmv. In NH winter, water vapour mixing ratios of about 2.5–3.0 ppmv were typically observed in the stratosphere
(Bonazzola and Haynes,2004). Figure 2d shows that the western Pacific contributed
25
44% to the entire stratospheric water vapour. Slight contributions from South America and Africa are much smaller (below 15%). Our calculations with kinematic trajectories (not shown) give similar results but the concentration of dehydration points over the West Pacific is somewhat less pronounced (32% contribution). The kinematic results
ACPD
8, 10999–11037, 2008 Water vapour transport in CCMs S. Kremser et al. Title Page Abstract Introduction Conclusions References Tables Figures ◭ ◮ ◭ ◮ Back CloseFull Screen / Esc
Printer-friendly Version Interactive Discussion
are virtually identical to the results fromFueglistaler et al.(2004).
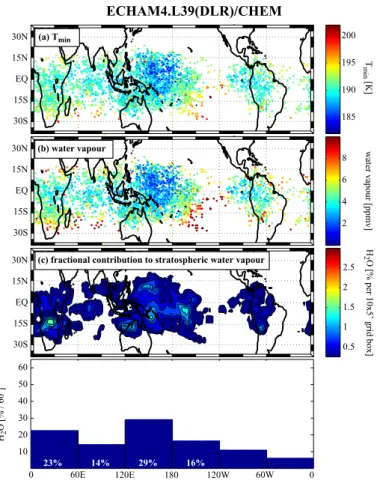
Figure 3 shows results from E39/C. The temperatures at the dehydration points (and likely in most of the TTL) are overestimated by about 3 K, leading to an average positive bias of water vapour mixing ratios of 1.7 ppmv over all TS trajectories. However, the geographical distribution of the dehydration points (Fig. 3a,b) is fairly well reproduced
5
compared to the reference calculations, though the distribution is more zonally sym-metric and the concentration of points over Africa is larger than in the reference. Since temperatures are higher there, the fractional contribution of Africa (here defined be-tween 0◦ and 60◦E) to stratospheric water vapour is overestimated (23% versus 15% in the reference).
10
Results from FUB-CMAM-CHEM are shown in Fig. 4. The minimum temperatures are overestimated by about 7 K results in a positive bias of average water vapour of more than a factor of three. But the geographical distribution of dehydration points is in good agreement with the reference calculation and the location of the minimum temper-atures are better reproduced than in E39/C (Figs. 4a, b). The fractional contributions
15
of the different geographical areas (Fig. 4d) are nearly identical to the reference. Due to the warm temperature bias of the CCMs in the TTL, the overall water vapour flux into the stratosphere is too high, an effect that is particularly pronounced in FUB-CMAM-CHEM. But the relative importance of the different geographical regions for determining stratospheric water vapour is overall well represented, particularly in
FUB-20
CMAM-CHEM.
3.2 NH winter 1997–1998
The distributions of dehydration points and the distribution of water vapour entry during the “warm” ENSO phase (El Ni ˜no) are presented in Figs. 5, 6 and 7. During El Ni ˜no the main convective region in the Pacific is shifted eastward and covers the Central and
25
Eastern Pacific.
In the reference calculation (Fig. 5) the geographical distribution of dehydration points is significantly more zonally symmetric during El Ni ˜no compared to the
neu-ACPD
8, 10999–11037, 2008 Water vapour transport in CCMs S. Kremser et al. Title Page Abstract Introduction Conclusions References Tables Figures ◭ ◮ ◭ ◮ Back CloseFull Screen / Esc
Printer-friendly Version Interactive Discussion
tral NH winter 1995–1996. Enhanced densities of points occur in the Central and East Pacific (here defined from 180◦to 120◦W). The region of lowest temperatures is shifted eastward (following the displacement of the convection during the El Ni ˜no event) and is also located over the Central and East Pacific. Accordingly the lowest water vapour mixing ratios occur here (Fig. 5b). The Central and East Pacific contribute 30% of the
5
overall water vapour that gets into the stratosphere during the El Ni ˜no winter, while the contribution from the West Pacific drops to 24%. The mean water vapour mixing ratio is 2.5 ppmv, which does not differ significantly from the mean mixing ratio in the neutral NH winter 1995–1996. These results suggest that during the El Ni ˜no event the amount of water entering the stratosphere is not increased relative to the NH winter
10
1995–1996, but the locations of the dehydration points change significantly.
Figure 6 shows results from E39/C. Temperature and water vapour biases are slightly smaller than for the neutral year (e.g. 1.4 ppmv positive water vapour bias). The shift of the geographical distribution of dehydration points to the Central and East Pacific is well reproduced. However the contribution of Africa is too high (22% compared to 13%
15
in the reference), as was also the case in the neutral year.
Results from FUB-CMAM-CHEM are shown in Fig. 7. The temperature bias is even more pronounced as in the neutral year (∼9 K positive bias), resulting in more than a factor of four bias in water vapour (11 ppmv versus 2.5 ppmv in the reference). As in the reference the geographical distribution of dehydration points is more zonally symmetric,
20
but the maximum density in the Central and East Pacific is not reproduced. Instead the contribution of this region is fairly small (14% versus 30% in the reference).
Particularly, the higher density of dehydration points over Africa and South America in the CCMs and the higher temperatures and thus higher mixing ratios there lead to overall excessive water vapour entry into the stratosphere compared to the reference.
25
FUB-CMAM-CHEM does not capture the shift towards the Central and East Pacific as well as E39/C.
ACPD
8, 10999–11037, 2008 Water vapour transport in CCMs S. Kremser et al. Title Page Abstract Introduction Conclusions References Tables Figures ◭ ◮ ◭ ◮ Back CloseFull Screen / Esc
Printer-friendly Version Interactive Discussion
3.3 NH winter 1998–1999
The NH winter 1998–1999 corresponds to La Ni ˜na conditions (cold ENSO phase). During the La Ni ˜na event the region of convection is shifted slightly westward compared to neutral conditions. Results from this year are shown in Figs. 8, 9 and 10.
In the reference calculations (Fig. 8) the dehydration points are even more
concen-5
trated over the West Pacific with less contributions from Africa and South America compared to the neutral winter. Also, the TS trajectories experienced lower tempera-ture minima than in the other years. Some of the TS trajectories reach temperatempera-ture minima of ∼175 K. The coldest region and thus lowest water vapour mixing ratios are found over the West Pacific. Due to the lower temperatures, the mean water vapour
10
mixing ratio is also lower than in the other years (1.5 ppmv versus 2.5–2.6 ppmv). The modelled water vapour mixing ratios are in agreement with water vapour profile ob-servations by Schiller et al. (2006) from the same winter. During this La Ni ˜na the contribution of stratospheric water vapour is even more focussed on the West Pacific (60%) (Fig. 8d).
15
In E39/C (Fig. 9) the overall drop in TTL temperatures between neutral conditions and the La Ni ˜na is reproduced, while the geographical distribution of dehydration points during this La Ni ˜na is not well captured. The maximum density of dehydration points is shifted eastwards towards the Central Pacific compared to the westward shift in the reference. Overall the distribution is much too zonal and water vapour contributions
20
from Africa and South America are too high (e.g. 27% from Africa and only 20% from the West Pacific, compared to 11% and 60% in the reference).
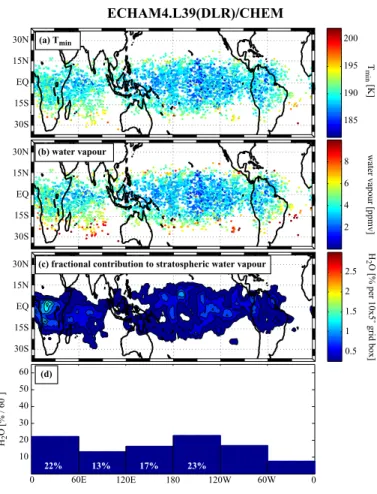
In FUB-CMAM-CHEM (Fig. 10) the temperature and water vapour biases are simi-lar as in the neutral year. Nevertheless, the distribution of dehydration points and the westward shift of the maximum density are fairly well reproduced. The largest
differ-25
ence between the reference and FUB-CMAM-CHEM is that in the latter more trajecto-ries reach their temperature minimum over the warmer regions of Africa and the Indian Ocean, which contributes to the positive water vapour bias. The dominant contribution
ACPD
8, 10999–11037, 2008 Water vapour transport in CCMs S. Kremser et al. Title Page Abstract Introduction Conclusions References Tables Figures ◭ ◮ ◭ ◮ Back CloseFull Screen / Esc
Printer-friendly Version Interactive Discussion
of stratospheric water vapour from the West Pacific is slightly less pronounced (47% versus 60% in the reference).
The westward shift of dehydration points and the larger concentration of points in the maximum over the West Pacific are reproduced by one CCM (FUB-CMAM-CHEM), while the other does not represent the changes in this pattern during La Ni ˜na.
5
3.4 NH Summer
The location of the intertropical convergence zone (ITCZ) varies with the seasons. Over land it shifts from the Southern Hemisphere (SH) in NH winter to the NH in NH summer. Over the Pacific and Atlantic Ocean the ITCZ does not vary that much with the seasons. The monsoon is connected with the seasonal shift of the ITCZ. Trajectories
10
were calculated for the NH summers 1996, 1997 and 1998 in order to examine the seasonal variations of water vapour transport and the influence of the monsoon on the transport processes in the TTL. Only the results of the NH summer 1996 are presented here; the results of the other NH summers are very similar.
The reference results for summer are shown in Fig. 11. With respect to the NH
15
winters, the TS trajectories assume temperature minima of about 4 K higher than in NH summer. Due to higher temperature minima the mean water vapour mixing ratio (3.8 ppmv) is higher than in NH winter. This value agrees well with the observed values of about 3.5–4.5 ppmv (Bonazzola and Haynes,2004). The regions of lowest tempera-tures are found over Indonesia, Philippines and the Bay of Bengal (Fig. 11a). In contrast
20
to NH winter, a large number of dehydration points lie outside the region between 15◦N and 15◦S. Overall the region of dehydration points is shifted northward, with points ly-ing as far north as 30◦N. This shift follows the seasonal shift of the ITCZ in NH summer. Since relatively high temperatures coincide with a large density of dehydration points over the Bay of Bengal, this region contributes a large fraction of the overall water
25
vapour transport into the stratosphere. The West Pacific and the India/Indian Ocean region (60◦E to 120◦E) both contribute 36% to the entire water vapour entry in ERA-40 (Fig. 11d). The geographical distribution of the water vapour entry suggests that the
ACPD
8, 10999–11037, 2008 Water vapour transport in CCMs S. Kremser et al. Title Page Abstract Introduction Conclusions References Tables Figures ◭ ◮ ◭ ◮ Back CloseFull Screen / Esc
Printer-friendly Version Interactive Discussion
Indian monsoon affects the water vapour transport into the stratosphere.
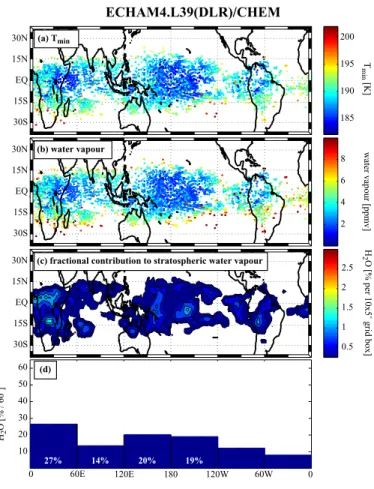
In E39/C (Fig. 12) the summertime temperature bias in the TTL is slightly less pro-nounced than in winter. The temperatures in the dehydration points and corresponding water vapour are much more variable than during winter and than in the reference cal-culation. Much too warm and wet dehydration points occur particularly at the edge of
5
the tropics in both hemispheres but also above Africa and Central America. Individual warm and wet dehydration points also lie in the West Pacific that is entirely cold and dry in the reference. These warm and wet dehydration points contribute to a positive bias in overall water vapour entry into the stratosphere such that the positive water vapour bias in summer is larger than in winter (2.6 ppmv positive bias versus 1.7 ppmv positive
10
bias in winter 1995–1996), although the average temperature bias is less pronounced. The contribution from the Indian monsoon is not reproduced and the maximum den-sity of points lies too far east over the Pacific. Accordingly the contribution from the Indian/Indian Ocean sector is too low (17% compared to 36% in the reference). The contribution from Africa (17%) is higher than in the reference.
15
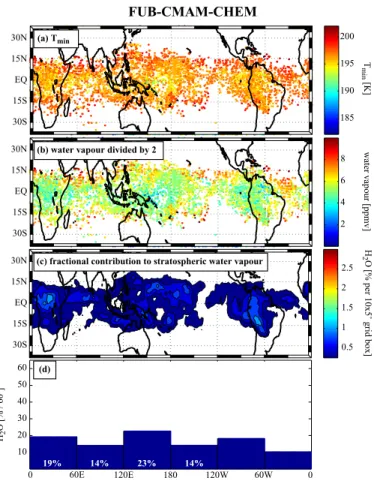
In FUB-CMAM-CHEM (Fig. 13) the warm temperature bias of about 7 K is also present in summer, leading to a high mean water vapour mixing ratio of about 11 ppmv. But consistent with the reference calculations the region of lowest temperatures shifts north-westward and overall the distribution of dehydration points is fairly well repro-duced with the lowest temperature minima and water vapour mixing ratios over the
Ara-20
bian Sea, India and the Bay of Bengal. As in E39/C warm and wet dehydration points lie at the southern edge of the tropics and individual points are scattered throughout the tropics. The impact of the Indian monsoon is reproduced but is less pronounced than in the reference. Figure 13d shows that similar to the reference the region India/Indian Ocean contributes 36% to the entire stratospheric water vapour entry. But note that
25
while in the reference virtually all water vapour transport in this sector takes place over India, in FUB-CMAM-CHEM some of the water vapour transport in this sector happens further south over the Southern Indian Ocean.
ACPD
8, 10999–11037, 2008 Water vapour transport in CCMs S. Kremser et al. Title Page Abstract Introduction Conclusions References Tables Figures ◭ ◮ ◭ ◮ Back CloseFull Screen / Esc
Printer-friendly Version Interactive Discussion
CCMs appear to be more noisy than in the reference (panels b of Figs. 11–13). Oth-erwise important features of the geographical distribution of dehydration in summer (e.g. the importance of the Indian monsoon) are fairly well reproduced by FUB-CMAM-CHEM but not by E39/C.
3.5 Residence time
5
The periods that trajectories spend in the upper TTL (Θ=385–395 K) were derived from the trajectory calculations. Results of the neutral NH winter 1995–1996 and NH summer 1996 are presented. The results of the other years are similar.
Figures 14 and 15 show histograms of the probability density function (PDF) of the residence time in the upper TTL for NH winter 1995–1996 and for NH summer 1996
10
respectively. The top panel shows the results of the reference calculations. The results based on CCM data are shown in the second (E39/C) and third panel (FUB).
Figure 14 illustrates that on average the reference trajectories stay 1–2 days longer in the upper part of the TTL than the CCM trajectories in NH winter. However, the more important difference is the shape of the PDF. The majority of the reference
trajecto-15
ries reside 9–10 days in the upper TTL before they leave this layer. Only very little air masses pass through this layer in less than 5 days. In contrast, most CCM trajectories pass through this layer in only 1–3 days. This basic difference in the shape of the PDF is present in both, summer and winter. This has a crucial influence on the transport of short-lived chemical species through the TTL. In the CCMs more short lived
com-20
pounds can reach the stratosphere chemically unaltered compared to the reference. Results of kinematic trajectory calculations based on ERA-40 data (not shown) are similar to the results from the CCMs. This suggests that most of the difference between the reference and the CCM runs come from the use of vertical winds to drive the transport in the CCMs.
25
In NH summer the reference trajectories stay longer in the upper TTL than in NH winter (Fig. 15 compared to Fig. 14). This is expected from the seasonal variation of the BDC. This seasonal variation of ascent rates through the TTL is not reproduced by
ACPD
8, 10999–11037, 2008 Water vapour transport in CCMs S. Kremser et al. Title Page Abstract Introduction Conclusions References Tables Figures ◭ ◮ ◭ ◮ Back CloseFull Screen / Esc
Printer-friendly Version Interactive Discussion
both CCMs, which show similar average residence times in summer and winter. The reason why there is no seasonal variability in the residence time of the CCM trajectories is not known and needs further investigations.
4 Conclusions
Lagrangian trajectory studies are now established tools for studying processes that
reg-5
ulate the transport of water from the troposphere into the stratosphere through the TTL. Here we have used this method to evaluate how well these processes are represented by two state of the art CCMs. In contrast to previous work diabatic trajectories driven by meteorological reanalysis data have been used to give the best representation of the processes in the real atmosphere. The results of these reference calculations agree
10
reasonably well with studies based on kinematic trajectories (Fueglistaler et al.,2004);
(Bonazzola and Haynes,2004) showing that the main conclusions of these papers are
fairly robust and do not depend much on the method that is used to drive the vertical transport. In particular the notion that during neutral and La Ni ˜na years most dehydra-tion takes place over the West Pacific and that this regions shifts toward the Central
15
and East Pacific during El Ni ˜no is confirmed by our diabatic calculations.
For all years analyzed, both CCMs have a warm temperature bias of about 3 K (E39/C) and 7K (FUB-CMAM-CHEM) compared to the reference calculations. Thus the overall water vapour entry into the stratosphere is too high. This seems to be a general feature of simulations with models of the ECHAM family, as is also shown in
20
Eyring et al.(2006), and thus seems rather to be due to deficits in the physical
param-eterizations than to the differences in the spatial resolutions of the two CCMs.
In NH winter 1995–1996 (neutral ENSO phase) the mean mixing ratio over all tra-jectories in E39/C is 4.3 ppmv and in FUB-CMAM-CHEM 8.2 ppmv, compared to the reference calculation of 2.6 ppmv. The value from the reference run compares well
25
with the observed values. But the geographical distribution of dehydration points is fairly well represented by both CCMs, particularly by FUB-CMAM-CHEM, while E39/C
ACPD
8, 10999–11037, 2008 Water vapour transport in CCMs S. Kremser et al. Title Page Abstract Introduction Conclusions References Tables Figures ◭ ◮ ◭ ◮ Back CloseFull Screen / Esc
Printer-friendly Version Interactive Discussion
shows somewhat more dehydration over Africa than the reference calculation.
During the El Ni ˜no winter (1997–1998) the shift of the dehydration region to the east is well reproduced in E39/C but in FUB-CMAM-CHEM the geographical distri-bution is too zonally symmetric and the strong dehydration in the Central and East Pacific is underestimated. Both CCMs show a higher density of dehydration points
5
over Africa where temperatures are higher. This contributes to overall excessive water vapour transport into the stratosphere. The mean water vapour mixing ratio is 3.4 ppmv (E39/C) and 11 ppmv (FUB-CMAM-CHEM) compared to 2.5 ppmv in the reference.
During La Ni ˜na (NH winter 1998–1999) minimum temperatures and water vapour mixing ratios are lower than in the other years, resulting in average water vapour of
10
1.5 ppmv. This drop in temperature and water vapour is reproduced in E39/C but the geographical distribution of dehydration is not well reproduced. Overall the distribution is much too zonal and water vapour contributions from Africa are too high. The mean water vapour mixing ratio is 3.5 ppmv. In FUB-CMAM-CHEM the mean temperature and water vapour biases are similar as in the neutral winter. Nevertheless, the
distri-15
bution of dehydration points and the westward shift of the maximum density are fairly well reproduced in this model. It should however be noted, that single El Ni ˜no and La Ni ˜na events were analyzed here and details of the simulated features for the different ENSO phases might differ from a mean ENSO signal.
In NH summer 1996 all trajectories reach higher temperature minima than in NH
20
winter. Consequently, the amount of water vapour reaching the stratosphere is higher than in NH winter. The mean water vapour mixing ratios are 6.4 ppmv (E39/C) and 11.1 ppmv (FUB-CMAM-CHEM) compared to 3.8 ppmv in the reference calculations. The important features of the geographical distribution of dehydration (e.g. the impor-tance of the Indian monsoon) are fairly well reproduced by FUB-CMAM-CHEM but not
25
by E39/C.
The residence times in the upper TTL (Θ=385–395 K) were determined. It turns out that in contrast to the geographical distribution of dehydration, the residence times are very sensitive to the approach that is used for driving the vertical transport (heating
ACPD
8, 10999–11037, 2008 Water vapour transport in CCMs S. Kremser et al. Title Page Abstract Introduction Conclusions References Tables Figures ◭ ◮ ◭ ◮ Back CloseFull Screen / Esc
Printer-friendly Version Interactive Discussion
rates versus vertical winds). Since diabatic trajectories, which are based on heating rates, best represent real atmospheric conditions (e.g., Wohltmann and Rex, 2007) but vertical transport is driven by vertical winds in the CCMs, significant differences between the PDF of the residence times exist between the reference calculation and the CCM results. In the reference, virtually all air masses remain 6 days or longer in the
5
vertical range indicated above, while in the CCM based runs most air masses remain 3 days or less in this region. Also, the seasonal cycle of the residence time (with slower ascent and longer residence times in NH summer) is not reproduced by the CCMs. The same deficit applies to trajectory studies that were driven by meteorological reanalysis data but which were based on vertical winds.
10
Overall this study shows that, while known large temperature biases in the TTL often lead to unrealistic absolute values in the transport of water vapour into the stratosphere, many important features of the geographical distribution of dehydration and its variabil-ity with climate patterns are fairly well reproduced by the two CCMs chosen for this study. A good reproduction of these features and their variability are important
pre-15
requisites to assess the future evolution of stratospheric water vapour in a changing climate.
Acknowledgements. We would like to thank Markus Kunze for providing the
FUB-CMAM-CHEM model data. We thank Rudolf Deckert for providing the ECHAM4.L39(DLR)/FUB-CMAM-CHEM model data. The FUB-CMAM-CHEM simulations have been performed within the European 20
project EuroSPICE (EVK2-CT-1999-00014) at the Konrad-Zuse-Zentrum f ¨ur Informationstech-nik, Berlin. The analysis has been supported by the European project SCOUT-O3 (GOCE-CT-2004-505390). Meteorological data were provided by the European Centre for Medium-Range Weather Forecasts (ECMWF).
References 25
Bonazzola, M. and Haynes, P.: A trajectory-based study of transport and dehydration in the tropical tropopause, J. Geophys. Res., 109, D20112, doi:10.1029/2003JD004356, 2004.
ACPD
8, 10999–11037, 2008 Water vapour transport in CCMs S. Kremser et al. Title Page Abstract Introduction Conclusions References Tables Figures ◭ ◮ ◭ ◮ Back CloseFull Screen / Esc
Printer-friendly Version Interactive Discussion Brewer, A. W.: Evidence for a world circulation provided by measurements of He and H2O in
the stratosphere, Q. J. Roy. Meteor. Soc., 75, 351–363, 1949. 11001,11002
Christensen, T., Knudsen, B. M., Pommereau, J.-P., Letrenne, G., Hertzog, A., Vial, F., Ovarlez, J., and Piot, M.: Evaluation of ECMWF ERA-40 temperature and wind in the lower tropi-cal stratosphere since 1998 from past long-duration balloon measurements, Atmos. Chem. 5
Phys., 7, 3399–3409, 2007,http://www.atmos-chem-phys.net/7/3399/2007/. 11004
Dameris, M., Grewe, V., Ponater, M., Deckert, R., Eyring, V., Mager, F., Matthes, S., Schnadt, C., Stenke, A., Steil, B., Br ¨uhl, C., and Giorgetta, M. A.: Long-term changes and variability in a transient simulation with a chemistry-climate model employing realistic forcing, Atmos. Chem. Phys., 5, 2121–2145, 2005,http://www.atmos-chem-phys.net/5/2121/2005/. 11006
10
Eyring, V., Butchart, N., Waugh, D. W., Akiyoshi, H., Austin, J., Bekki, S., Bodeker, G. E., Boville, B. A., Br ¨uhl, C., Chipperfield, M. P., Cordero, E., Dameris, M., Deushi, M., Fioletov, V. E., Frith, S. M., Garcia, R. R., Gettelman, A., Giorgetta, M. A., Grewe, V., Jourdain, L., Kinnison, D. E., Mancini, E., Manzini, E., Marchand, M., Marsh, D. R., Nagashima, T., Newman, P. A., Nielsen, J. E., Pawson, S., Pitari, G., Plummer, D. A., Rozanov, E., Schraner, M., Shepherd, 15
T. G., Shibata, K., Stolarski, R. S., Struthers, H., Tian, W., and Yoshiki, M.: Assessment of temperature, trace species, and ozone in chemistry-climate model simulations of the recent past, J. Geophys. Res., 111, D22308, doi:10.1029/2006JD007327, 2006. 11017
Forster, P. M. and Shine, K. P.: Stratospheric water vapour changes as a possible contributor to observed stratospheric cooling, Geophys. Res. Lett., 26, 21, 3309–3312, 1999.11001
20
Fueglistaler, S., Wernli, H., and Peter, T.: Tropical troposphere-to-stratosphere
transport inferred from trajectory calculations, J. Geophys. Res., 109,
D03108,doi:10.1029/2003JD004069, 2004.11003,11011,11017
Fueglistaler, S., Bonazzola, M., Haynes, P., and Peter, Th.: Stratospheric water vapor predicted from the Lagrangian temperature history of air entering the stratosphere in the tropics, J. 25
Geophys. Res., 110, D08107, doi:10.1029/2004JD005516, 2005. 11002,11003
Gettelman, A., Randel, W. J., Massie, S., and Wu, F.: El Ni ˜no as a natural experiment for studying the tropical tropopause region, J. Climate, 14, 3375–3392, 2001a.11009
Gettelman, A. and Holton, J. R.: Horizontal transport and the dehydration of the stratosphere, Geophys. Res. Lett., 28 14, 2799–2802, 2001b. 11002
30
Gettelman, A. and Forster, P. M. de F.: A climatology of the tropical tropopause layer, J. Meteor. Soc. Jpn. 80, 911–924, 2002a.11002
ACPD
8, 10999–11037, 2008 Water vapour transport in CCMs S. Kremser et al. Title Page Abstract Introduction Conclusions References Tables Figures ◭ ◮ ◭ ◮ Back CloseFull Screen / Esc
Printer-friendly Version Interactive Discussion tropopause layer, Geophys. Res. Lett., 29, 1, 1009, doi:10.1029/2001GL013818, 2002b.
11003
Gettelman, A., Forster, P. M. de F., Fujiwara, M., Fu, Q., V ´omel, H., Gohar, L. K., Johanson, C., and Ammerman, M.: Radiation balance of the tropical tropopause layer, Geophys. Res. Lett., 109, D07103, doi:10.1029/2003JD004190, 2004.11002,11005
5
Hatsushika, H. and Yamazaki, K.: Stratospheric drain over Indonesia and dehydration within the tropical tropopause layer diagnosed by air parcel trajectories, J. Geophys. Res., 108, D19, 4610, doi:10.1029/2002JD002986, 2003.11003
Hein, R., Dameris, M., Schnadt, C., Land, C., Grewe, V., K ¨ohler, I., Ponater, M., Sausen, R., Steil, B., Landgraf, J., and Br ¨uhl, C.: Results of an interactively coupled atmo-10
spheric chemistry-general circulation model: Comparison with observations, Ann. Geophys.-Germany, 19, 435–457, 2001. 11006
Highwood, E. J. and Hoskins, B. J.: The tropical tropopause, Q. J. Roy. Meteor. Soc., 124, 1579–1604, 1998. 11002
Kr ¨uger, K., Tegtmeier, S., and Rex, M.: Long-term climatology of mass transport through the 15
Tropical Tropopause Layer (TTL) during NH winter, Atmos. Chem. Phys. Discuss., 7, 13 989– 14 010, 2007.11003,11008
Langematz, U., Grenfell, J., Matthes, K., Mieth, P., Kunze, M., Steil, B., and Br ¨uhl, C.: Chem-ical effects in 11-year solar cycle simulations with the Freie Universit ¨at Berlin Climate Mid-dle Atmosphere Model with online chemistry (FUB-CMAM-CHEM), Geophys. Res. Lett., 32, 20
L13803, doi:10.1029/2005GL022686, 2005. 11006
Marti, J. and Mauersberger, K.: A survey and new measurements of ice vapor pressure at temperatures between 170 and 250 K, Geophys. Res. Lett., 20, 363–366, 1993.11008
Notholt, J., Luo, B., Fueglistaler, S., Weisenstein, D., Rex, M., Lawrence, M.G., Bingemer, H., Wohltmann, I., Corti, T., Warneke, T., von Kuhlmann, R., Peter, Th.: Influence of tropospheric 25
SO2 emissions on particle formation and the stratospheric humidity, Geophys. Res. Lett., 32, L07810, doi:10.1029/2004GL022159, 2005. 11002
Oltmans, S. J. and Hofmann, D. J.: Increase in lower-stratospheric water vapour at a mid-latitude Northern Hemisphere site from 1981 to 1994, Nature, 374, 146–149, 1995. 11001
Parrondo, M. C., Yela, M., von der Gathen, P., and Ochoa, H.: Mid-winter lower stratosphere 30
temperatures in the Antarctic vortex: comparison between observations and ECMWF and NCEP operational models, Atmos. Chem. Phys., 7, 435–441, 2007,
ACPD
8, 10999–11037, 2008 Water vapour transport in CCMs S. Kremser et al. Title Page Abstract Introduction Conclusions References Tables Figures ◭ ◮ ◭ ◮ Back CloseFull Screen / Esc
Printer-friendly Version Interactive Discussion Pawson, S., Langematz, U., Radek, G., Schlese, U., and Strauch, P.: The Berlin
troposphere-stratospheremesosphere GCM: Sensitivity to physical parametrizations, Q. J. Roy. Meteor. Soc., 124, 1343–1371, 1998. 11006
Schiller, C., Afchine, A., Rohs, S., Santos, F. H., and Spelten, N.: Water vapour profile obser-vations in the tropics, EGU General Assembly, Vienna, Austria, 2–7 April 2006, EGU06-A-5
04364, 2006. 11013
Schoeberl, M. R, Douglass, A. R., Zhu, Z., and Pawson, S.: A comparison of the lower strato-spheric age spectra derived from a general circulation model and two data assimilation sys-tems, J. Geophys. Res., 108, D3, 4113, doi:10.1029/2002JD002652, 2003.11004
Sherwood, S. C. and Dessler, A. E:. On the control of stratospheric humidity, Geophys. Res. 10
Lett., 27, 16, 2513–2516, 2000.11002
Uppala, S. M., Kallberg, P. W., Simmons, A. J., Andrae, U., Costa Bechtold, V. DA, Fiorino, M., Gibson, J. K., Haseler, J., Hernandez, A., Kelly, G. A., Li, X., Onogi, K., Saarinen, S., Sokka, N., Allan, R. P., Andersson, E., Arpe, K., Balmaseda, M.A., Beljaars, A.C.M., van de Berg, L., Bidlot, J., Bormann, N., Caires, S., Chevallier, F., Dethof, A., Dragosavac, M., Fisher, 15
M., Fuentes, M., Hagemann, S., Holm, E., Hoskins, B. J., Isaksen, L., Janssen, P. A. E. M., Jenne, R., McNally, A. P., Mahfouf, J.-F., Morcrette, J.-J., Rayner, N. A., Saunders, R. W., Simon, P., Sterl, A., Trenberth, K. E., Untch, A., Vasiljevic, D., Viterbo, P., and Woollen, J.: The ERA-40 re-analysis, Q. J. Roy. Meteor. Soc., 131, 2961–3012, 2005. 11004
Wohltmann, I. and Rex, M.: Improvement of vertical and residual velocities in pressure or hybrid 20
coordinates in analysis data and CTMs in the stratosphere, Atmos. Chem. Phys. Discuss., 7, 13 401–13 416, 2007.11004,11007,11019
World Meteorological Organization: Scientific Assessment of Ozone Depletion: 2006, WMO Global Ozone Research and Monitoring Project, Report No. 50, 2007. 11005
ACPD
8, 10999–11037, 2008 Water vapour transport in CCMs S. Kremser et al. Title Page Abstract Introduction Conclusions References Tables Figures ◭ ◮ ◭ ◮ Back CloseFull Screen / Esc
Printer-friendly Version Interactive Discussion 400 K cold point con ve cti on
zero radiative heating cold point tropopause
net radiative cooling net radiative heating
∿15 km ∿18 km T time H2O time
cold point temperature
cold point water vapour mixing ratio
Fig. 1. Schematic picture that illustrates the Lagrangian cold point concept. The Lagrangian
cold point (green dot in the top panel) corresponds to the lowest temperature along an individual air mass trajectory and thus to the lowest water vapour value. It is located close to the cold point tropopause but due to the interaction between horizontal and vertical transport it does not exactly coincide with it. This figure shows the time series of temperature (middle) and water vapour (bottom) experienced along a trajectory. In addition, it demonstrates that, if one calculates backward trajectories (represented by the dotted curve in the top panel) the water vapour content of an air parcel won’t be affected by processes before the cold point.
ACPD
8, 10999–11037, 2008 Water vapour transport in CCMs S. Kremser et al. Title Page Abstract Introduction Conclusions References Tables Figures ◭ ◮ ◭ ◮ Back CloseFull Screen / Esc
Printer-friendly Version Interactive Discussion ERA-40 2 (a) Tmin (b) water vapour
(c) fractional contribution to stratospheric water vapour
(d) 15% 8% 44% 14% H2 O [% / 60˚] 200 195 190 185 8 6 4 2 w ater v apour [ppmv] 2.5 2 1.5 1 0.5 2.5 2 1.5 1 0.5 H
2O [% per 10x5˚ grid box]
0 60E 120E 180 120W 60W 0 T min [K] 30N 15N EQ 15S 30S 30N 15N EQ 15S 30S 30N 15N EQ 15S 30S 60 50 40 30 20 10 60
Fig. 2. NH winter 1995–1996. The scatter plots (panel a and b) show the geographical
distribu-tion of the dehydradistribu-tion points for ERA-40. Color code in (a) shows the minimum temperatures experienced by the TS trajectories and in (b) the corresponding equilibrium water vapour mix-ing ratios. Panel(c) illustrates the fractional contribution to stratospheric water vapour from different geographical areas, expressed by percentage contribution per individual 10◦
×5◦ grid boxes. Panel (d) shows longitudinal distribution of the water vapour entry, i.e. the value from (c) integrated over latitude (30◦N–30◦S) per 60◦longitude.
ACPD
8, 10999–11037, 2008 Water vapour transport in CCMs S. Kremser et al. Title Page Abstract Introduction Conclusions References Tables Figures ◭ ◮ ◭ ◮ Back CloseFull Screen / Esc
Printer-friendly Version Interactive Discussion
(a) Tmin
(b) water vapour
(c) fractional contribution to stratospheric water vapour
(d) 15%23% 14%8% 44%29% 14%16% H2 O [% / 60˚] 200 195 190 185 8 6 4 2 w ater v apour [ppmv] 2.5 2 1.5 1 0.5 2.5 2 1.5 1 0.5 H
2O [% per 10x5˚ grid box]
0 60E 120E 180 120W 60W 0 T min [K] 30N 15N EQ 15S 30S 30N 15N EQ 15S 30S 30N 15N EQ 15S 30S 60 50 40 30 20 10 ECHAM4.L39(DLR)/CHEM
ACPD
8, 10999–11037, 2008 Water vapour transport in CCMs S. Kremser et al. Title Page Abstract Introduction Conclusions References Tables Figures ◭ ◮ ◭ ◮ Back CloseFull Screen / Esc
Printer-friendly Version Interactive Discussion
(a) Tmin
(b) water vapour divided by 2
(c) fractional contribution to stratospheric water vapour
(d) 18% 10% 46% 10% H2 O [% / 60˚] 200 195 190 185 8 6 4 2 w ater v apour [ppmv] 2.5 2 1.5 1 0.5 2.5 2 1.5 1 0.5 H
2O [% per 10x5˚ grid box]
0 60E 120E 180 120W 60W 0 T min [K] 30N 15N EQ 15S 30S 30N 15N EQ 15S 30S 30N 15N EQ 15S 30S 60 50 40 30 20 10 FUB-CMAM-CHEM
ACPD
8, 10999–11037, 2008 Water vapour transport in CCMs S. Kremser et al. Title Page Abstract Introduction Conclusions References Tables Figures ◭ ◮ ◭ ◮ Back CloseFull Screen / Esc
Printer-friendly Version Interactive Discussion 2
(a) Tmin
(b) water vapour
(c) fractional contribution to stratospheric water vapour
0 60 120 180 240 300 360 (d) 13% 11% 24% 30% H2 O [% / 60˚] 200 195 190 185 8 6 4 2 w ater v apour [ppmv] 2.5 2 1.5 1 0.5 H
2O [% per 10x5˚ grid box]
0 60E 120E 180 120W 60W 0 T min [K] 30N 15N EQ 15S 30S 30N 15N EQ 15S 30S 30N 15N EQ 15S 30S 60 50 40 30 20 10 ERA-40
ACPD
8, 10999–11037, 2008 Water vapour transport in CCMs S. Kremser et al. Title Page Abstract Introduction Conclusions References Tables Figures ◭ ◮ ◭ ◮ Back CloseFull Screen / Esc
Printer-friendly Version Interactive Discussion
(a) Tmin
o o o o o o o
(b) water vapour
(c) fractional contribution to stratospheric water vapour
(d) 22% 13% 17% 23% H2 O [% / 60˚] 200 195 190 185 8 6 4 2 w ater v apour [ppmv] 2.5 2 1.5 1 0.5 2.5 2 1.5 1 0.5 H
2O [% per 10x5˚ grid box]
0 60E 120E 180 120W 60W 0 T min [K] 30N 15N EQ 15S 30S 30N 15N EQ 15S 30S 30N 15N EQ 15S 30S 60 50 40 30 20 10 ECHAM4.L39(DLR)/CHEM
ACPD
8, 10999–11037, 2008 Water vapour transport in CCMs S. Kremser et al. Title Page Abstract Introduction Conclusions References Tables Figures ◭ ◮ ◭ ◮ Back CloseFull Screen / Esc
Printer-friendly Version Interactive Discussion
(a) Tmin
(b) water vapour divided by 2
(c) fractional contribution to stratospheric water vapour
(d) 19% 14% 23% 14% H2 O [% / 60˚] 200 195 190 185 8 6 4 2 w ater v apour [ppmv] 2.5 2 1.5 1 0.5 2.5 2 1.5 1 0.5 H
2O [% per 10x5˚ grid box]
0 60E 120E 180 120W 60W 0 T min [K] 30N 15N EQ 15S 30S 30N 15N EQ 15S 30S 30N 15N EQ 15S 30S 60 50 40 30 20 10 FUB-CMAM-CHEM
ACPD
8, 10999–11037, 2008 Water vapour transport in CCMs S. Kremser et al. Title Page Abstract Introduction Conclusions References Tables Figures ◭ ◮ ◭ ◮ Back CloseFull Screen / Esc
Printer-friendly Version Interactive Discussion
(a) Tmin
(b) water vapour
(c) fractional contribution to stratospheric water vapour
(d) 11% 11% 60% 9% H2 O [% / 60˚] 200 195 190 185 8 6 4 2 w ater v apour [ppmv] 2.5 2 1.5 1 0.5 2.5 2 1.5 1 0.5 H
2O [% per 10x5˚ grid box]
0 60E 120E 180 120W 60W 0 T min [K] 30N 15N EQ 15S 30S 30N 15N EQ 15S 30S 30N 15N EQ 15S 30S 60 50 40 30 20 10 ERA-40
ACPD
8, 10999–11037, 2008 Water vapour transport in CCMs S. Kremser et al. Title Page Abstract Introduction Conclusions References Tables Figures ◭ ◮ ◭ ◮ Back CloseFull Screen / Esc
Printer-friendly Version Interactive Discussion
(a) Tmin
(b) water vapour
(c) fractional contribution to stratospheric water vapour
(d) 27% 14% 20% 19% H2 O [% / 60˚] 200 195 190 185 8 6 4 2 w ater v apour [ppmv] 2.5 2 1.5 1 0.5 2.5 2 1.5 1 0.5 H
2O [% per 10x5˚ grid box]
0 60E 120E 180 120W 60W 0 T min [K] 30N 15N EQ 15S 30S 30N 15N EQ 15S 30S 30N 15N EQ 15S 30S 60 50 40 30 20 10 ECHAM4.L39(DLR)/CHEM
ACPD
8, 10999–11037, 2008 Water vapour transport in CCMs S. Kremser et al. Title Page Abstract Introduction Conclusions References Tables Figures ◭ ◮ ◭ ◮ Back CloseFull Screen / Esc
Printer-friendly Version Interactive Discussion
(a) Tmin
(b) water vapour divided by 2
(c) fractional contribution to stratospheric water vapour
(d) 19% 16% 47% 6% H2 O [% / 60˚] 200 195 190 185 8 6 4 2 w ater v apour [ppmv] 2.5 2 1.5 1 0.5 2.5 2 1.5 1 0.5 H
2O [% per 10x5˚ grid box]
0 60E 120E 180 120W 60W 0 T min [K] 30N 15N EQ 15S 30S 30N 15N EQ 15S 30S 30N 15N EQ 15S 30S 60 50 40 30 20 10 FUB-CMAM-CHEM
ACPD
8, 10999–11037, 2008 Water vapour transport in CCMs S. Kremser et al. Title Page Abstract Introduction Conclusions References Tables Figures ◭ ◮ ◭ ◮ Back CloseFull Screen / Esc
Printer-friendly Version Interactive Discussion
(a) Tmin
(b) water vapour
(c) fractional contribution to stratospheric water vapour
0 60 120 180 240 300 360 (d) 10% 36% 36% 12% H2 O [% / 60˚] 200 195 190 185 8 6 4 2 w ater v apour [ppmv] 2.5 2 1.5 1 0.5 2.5 2 1.5 1 0.5 H
2O [% per 10x5˚ grid box]
0 60E 120E 180 120W 60W 0 T min [K] 30N 15N EQ 15S 30S 30N 15N EQ 15S 30S 30N 15N EQ 15S 30S 60 50 40 30 20 10 ERA-40
ACPD
8, 10999–11037, 2008 Water vapour transport in CCMs S. Kremser et al. Title Page Abstract Introduction Conclusions References Tables Figures ◭ ◮ ◭ ◮ Back CloseFull Screen / Esc
Printer-friendly Version Interactive Discussion
(a) Tmin
(b) water vapour
o o o o o o o
(c) fractional contribution to stratospheric water vapour (d) 17% 17% 30% 16% H2 O [% / 60˚] 200 195 190 185 8 6 4 2 w ater v apour [ppmv] 2.5 2 1.5 1 0.5 2.5 2 1.5 1 0.5 H
2O [% per 10x5˚ grid box]
0 60E 120E 180 120W 60W 0 T min [K] 30N 15N EQ 15S 30S 30N 15N EQ 15S 30S 30N 15N EQ 15S 30S 60 50 40 30 20 10 ECHAM4.L39(DLR)/CHEM
ACPD
8, 10999–11037, 2008 Water vapour transport in CCMs S. Kremser et al. Title Page Abstract Introduction Conclusions References Tables Figures ◭ ◮ ◭ ◮ Back CloseFull Screen / Esc
Printer-friendly Version Interactive Discussion
(a) Tmin
(b) water vapour divided by 2
(c) fractional contribution to stratospheric water vapour (d) 11% 36% 28% 10% H2 O [% / 60˚] 200 195 190 185 8 6 4 2 w ater v apour [ppmv] 2.5 2 1.5 1 0.5 2.5 2 1.5 1 0.5 H
2O [% per 10x5˚ grid box]
0 60E 120E 180 120W 60W 0 T min [K] 30N 15N EQ 15S 30S 30N 15N EQ 15S 30S 30N 15N EQ 15S 30S 60 50 40 30 20 10 FUB-CMAM-CHEM
ACPD
8, 10999–11037, 2008 Water vapour transport in CCMs S. Kremser et al. Title Page Abstract Introduction Conclusions References Tables Figures ◭ ◮ ◭ ◮ Back CloseFull Screen / Esc
Printer-friendly Version Interactive Discussion ERA-40 ECHAM4.L39(DLR)/CHEM FUB-CMAM-CHEM 0 5 10 15 20 25 30 35 40
Average residence time 9.43 days
Average residence time 6.97 days
Average residence time 8.04 days 2 6 10 14 18 22 26 5 10 15 20 25 30 35 40 0
Residence time between 385-395K [days]
PDF [%/day]
5 10 15 20 25 30 35 40
0
Residence time between 385-395K [days] 2 6 10 14 18 22 26 PDF [%/day] 5 10 15 20 25 30 35 40 0
Residence time between 385-395K [days] 2 6 10 14 18 22 26 PDF [%/day]
Fig. 14. NH winter 1995–1996. Residence time for the TS trajectories in the upper part of the
TTL for ERA-40 (top), ECHAM4.L39(DLR)/CHEM (middle) and FUB-CMAM-CHEM (bottom), respectively.