HAL Id: hal-01645698
https://hal.archives-ouvertes.fr/hal-01645698
Submitted on 9 May 2018
HAL is a multi-disciplinary open access
archive for the deposit and dissemination of
sci-entific research documents, whether they are
pub-lished or not. The documents may come from
teaching and research institutions in France or
abroad, or from public or private research centers.
L’archive ouverte pluridisciplinaire HAL, est
destinée au dépôt et à la diffusion de documents
scientifiques de niveau recherche, publiés ou non,
émanant des établissements d’enseignement et de
recherche français ou étrangers, des laboratoires
publics ou privés.
CfA
Malcolm Hicken, Andrew S. Friedman, Stephane Blondin, Peter Challis, Perry
Berlind, Mike Calkins, Gil Esquerdo, Thomas Matheson, Maryam Modjaz,
Armin Rest, et al.
To cite this version:
Malcolm Hicken, Andrew S. Friedman, Stephane Blondin, Peter Challis, Perry Berlind, et al.. Type
II Supernova Light Curves and Spectra From the CfA. Astrophys.J.Suppl., 2017, 233 (1), pp.6.
�10.3847/1538-4365/aa8ef4�. �hal-01645698�
TYPE II SUPERNOVA LIGHT CURVES AND SPECTRA FROM THE CfA
Malcolm Hicken,1Andrew S. Friedman,1, 2, 3 Peter Challis,1 Perry Berlind,1 Stephane Blondin,4 Mike Calkins,1 Gil Esquerdo,5 Thomas Matheson,6Maryam Modjaz,7 Armin Rest,8 and Robert P. Kirshner1, 9
1Harvard-Smithsonian Center for Astrophysics, Cambridge, MA 02138, USA
2Center for Theoretical Physics and Department of Physics, Massachusetts Institute of Technology, Cambridge, MA 02139 3University of California, San Diego, La Jolla, CA 92093, USA
4Aix Marseille Univ, CNRS, LAM, Laboratoire d’Astrophysique de Marseille, Marseille, France 5Planetary Science Institute, 1700 East Fort Lowell Road, Tucson, AZ 85719, USA
6National Optical Astronomy Observatory, 950 North Cherry Avenue, Tucson, AZ, 85719, USA
7Center for Cosmology and Particle Physics, New York University, 4 Washington Place, New York, NY 10003, USA 8Space Telescope Science Institute, Baltimore, MD 21218, USA
9Gordon and Betty Moore Foundation, 1661 Page Mill Road, Palo Alto, CA 94304, USA
ABSTRACT
We present multiband photometry of 60 spectroscopically-confirmed supernovae (SN): 39 SN II/IIP, 19 IIn, one IIb and one that was originally classified as a IIn but later as a Ibn. Forty-six have only optical photometry, six have only near infrared (NIR) photometry and eight have both optical and NIR. The median redshift of the sample is 0.016. We also present 192 optical spectra for 47 of the 60 SN. All data are publicly available. There are 26 optical and two NIR light curves of SN II/IIP with redshifts z > 0.01, some of which may give rise to useful distances for cosmological applications. All photometry was obtained between 2000 and 2011 at the Fred Lawrence Whipple Observatory (FLWO), via the 1.2m and 1.3m PAIRITEL telescopes for the optical and NIR, respectively. Each SN was observed in a subset of the u0U BV RIr0i0J HKs bands. There are a total of 2932 optical and 816 NIR light curve points. Optical spectra
were obtained using the FLWO 1.5m Tillinghast telescope with the FAST spectrograph and the MMT Telescope with the Blue Channel Spectrograph. Our photometry is in reasonable agreement with other samples from the literature. Comparison with Pan-STARRS shows that two-thirds of our individual star sequences have weighted-mean V offsets within ±0.02 mag. In comparing our standard-system SN light curves with common Carnegie Supernova Project objects using their color terms, we found that roughly three-quarters have average differences within ±0.04 mag. The data from this work and the literature will provide insight into SN II explosions, help with developing methods for photometric SN classification, and contribute to their use as cosmological distance indicators.
Keywords: stars: supernovae: general — stars: supernovae: light curves — stars: supernovae: in-dividual: SN2000eo, SN2001ez, SN2001fa, SN2002bx, SN2002em, SN2005ay, SN2005kd, SN2006at, SN2006be, SN2006bl, SN2006bo, SN2006bv, SN2006ca, SN2006cd, SN2006gy, SN2006it, SN2006iw, SN2006ov, SN2007Q, SN2007T, SN2007aa, SN2007ad, SN2007ah, SN2007ak, SN2007av, SN2007ay, SN2007bb, SN2007be, SN2007bf, SN2007cd, SN2007ck, SN2007cm, SN2007ct, SN2007cu, SN2007hv, SN2007od, SN2007pk, SN2007rt, SN2008B, SN2008F, SN2008aj, SN2008bj, SN2008bn, SN2008bu, SN2008bx, SN2008gm, SN2008if, SN2008in, SN2008ip, SN2009K, SN2009N, SN2009ay, SN2009dd, SN2009kn, SN2009kr, SN2010aj, SN2010al, SN2010bq, SN2011an, SN2011ap
1. INTRODUCTION
This paper presents CfA SN II light curves and spectra, all of which are publicly available from the journal, the CfA SN Group website1 and The Open Supernova Catalog.2 It is our hope that these data will be of use to the broader SN community for use in SN II analysis and cosmological calculations.
Massive stars (M & 8M ) end their lives as core-collapse supernovae (CCSN). Those that have retained a large
portion of their hydrogen envelope are known as Type II SN, with spectra dominated by Balmer features. Those that have lost their hydrogen envelope and have no Balmer lines but do have helium features are known as Type Ib. Finally, those that have also lost much or all of their helium envelope and show no helium spectral features are known as Type Ic. For reviews of these classifications, see, for example,Gal-Yam (2016) and the introductions of Smartt et
al.(2009),Van Dyk et al. (2012), Modjaz et al.(2016) and Liu et al.(2016). A continuum seems to exist across the
CCSN classes, depending on how much of the outer layer(s) has been lost. SN II with thick hydrogen envelopes have a long plateau phase with roughly constant or slowly declining luminosity (SN IIP) whereas those with thinner envelopes decline more quickly (SN IIL) (see, for example:Anderson et al. 2014;Sanders et al. 2015). Gall et al.(2015) point out that, in addition to thinner envelopes, SN IIL need larger progenitor radii than SN IIP to give rise to their observed luminosities. There also appears to be a continuous range of decline rates joining SN IIP and IIL, giving further weight to the continuum between CCSN types. However, see Valenti et al. (2016) for more on the debate over SN IIP and IIL andMorozova, Piro & Valenti(2017) for discussion on whether there is a physical process that smoothly gives rise to a continuum between SN IIP and IIL or whether there is some specific mechanism that more abruptly gives rise to their differences. Type IIb are an intermediate class between SN II and Ib. They have hydrogen features in their early spectra but these quickly disappear as the SN ages, suggesting a thin hydrogen layer in the progenitor. Liu et al.
(2016) showed that there is a continuum of Hα strengths between SN IIb and Ib. Another kind of SN II is the Type IIn, distinguished by its narrow Balmer emission lines that are believed to arise from the SN blast wave colliding with previously-ejected progenitor material from stellar winds or eruptions.
SN II are of interest for several reasons. They mark the death of many massive stars and play an important role in the chemical enrichment of the Universe. SN II light curves and spectra give insight into SN II explosion mechanisms and progenitor properties. SN II also serve as accurate distance indicators. SN II are not as luminous as SN Ia (see, for example,Richardson et al. 2002) but do provide an alternative and independent means of measuring cosmological distances (see, for example,de Jaeger et al. 2017). As more powerful telescopes, such as the Large Synoptic Survey Telescope,3observe larger numbers of SN II at both low and high redshift, SN II will become more useful cosmological
tools than in the past, offering an independent source of distances for calculating the expansion history of the universe. Since most of the SN observed with large surveys will not be spectroscopically identified, it is important to understand the photometric nature of all types of SN so that sufficiently pure subsets (e.g., consisting only of SN Ia or SN IIP) can be photometrically separated and used for cosmology.
The potential cosmological use of SN II was pioneered by Kirshner & Kwan (1974, 1975) with the expanding photospheric method for measuring distances. Schmidt, Kirshner & Eastman(1992) applied this method to 10 SN II to calculate their distances and a value for the Hubble constant. Schmidt et al. (1994) improved their method and applied it to 18 SN II to find a Hubble constant of Ho= 73 ± 6(stat) ± 7(syst) km/s/Mpc, consistent within the error
bars with more recent measurements such as the SN Ia and Cepheid-based value of Ho= 73.24 ± 1.74 km/s/Mpc from
Riess et al.(2016) and the P lanck cosmic microwave background radiation-based value of Ho= 67.8 ± 0.9 km/s/Mpc
from thePlanck Collaboration (2016).
More recently, several optical and NIR SN II data sets have been published while other unpublished data sets have been used for analysis or cosmological applications. We present a summary of many of them and their findings, in largely chronological order. This may also assist anyone interested in compiling SN II data from the literature.
Poznanski et al. (2009) combined optical light curves and spectra of 17 new SN IIP with those of 23 from the
literature to find a Hubble diagram dispersion of 0.38 mag, which reduced to 0.22 mag when three > 3σ outliers were removed. D’Andrea et al.(2010) presented light curves and spectra of 15 SDSS SN IIP and combined them with others from the literature to find a Hubble diagram dispersion of 0.29 mag for the combination.
NIR photometry of SN II has also been produced and analyzed. Dust extinction at NIR wavelengths is diminished relative to the optical, and there is the additional potential for smaller intrinsic dispersion in NIR light curves of SN II.
1www.cfa.harvard.edu/supernova/index.html 2https://sne.space/about/
Maguire et al.(2010) explain that reduced extinction in the NIR gives rise to a lower error in the extinction estimate and has less of an effect on the fit between expansion velocity and NIR luminosity. They also point out that SN IIP plateau-phase spectra have far fewer lines in the NIR than the optical. They thus presume that estimates of SN IIP NIR luminosity should be less affected by variations in line strengths and line widths between different SN IIP. They examined 12 SN IIP that had spectra and both V I and NIR light curves. However, only one of their SN was in the Hubble flow (cz > 3000 km/s), suggesting the Hubble diagram dispersion they found would be larger than that of Hubble flow objects. In the optical, they found a dispersion of 0.56 mag by combining V -band photometry and an estimate of the expansion velocity at +50d post-explosion. In I, they found a dispersion of 0.5 mag. Maguire et al.
(2010) confirmed their hopes for the NIR by measuring a J band dispersion of 0.39 mag, ∼ 0.1 mag lower than in I, suggesting that NIR light curves of Hubble-flow SN II would offer a similar improvement when compared to the optical.
In the past year,Rodr´ıguez et al.(2016) presented preliminary results from a set of 16 SN II, showing a 0.12 mag dispersion Hubble diagram in each of the J HKsbands, better than the BV I dispersions of 0.23, 0.17 and 0.19 mag,
respectively, providing evidence that the smaller dispersion seen by Maguire et al.(2010) for very-nearby NIR SN II light curves would also be found in the Hubble flow.
More data was published by various groups in the following years. Returning to the optical, Arcavi et al.(2012) produced 21 SN II light curves from the Caltech Core Collapse Project. Taddia et al. (2013) published light curves and spectra of five CSP SN IIn. Faran et al. (2014) presented light curves and spectra of 23 SN IIP from LOSS and analyzed them. Anderson et al. (2014) provided V-band light curves and analysis for 116 SN II from the CSP and its predecessors (CT, C&T, SOIRS and CATS). They found evidence suggesting a continuum, where low-luminosity SN II have flat light curves during the plateau phase and higher-luminosity SN II have faster decline rates. Anderson
et al. (2014) measured a dispersion of 0.56 mag around the relation between the plateau-phase decline rate and peak
magnitudes, suggesting that SN II can be used as pure photometric distance indicators. Galbany et al.(2016) published all of the bands for 51 of these 116 SN II while the CSP portion is not yet published. Guti´errez (2016) presented an in-depth analysis of spectra of 123 SN II from the CSP and its predecessors, finding evidence suggesting that differences between SN IIP and IIL are related to the pre-explosion hydrogen envelope mass and do not come from different progenitor families.
Rodr´ıguez et al.(2014) found a very promising dispersion of 0.12 mag by using 13 SN II in the Hubble flow that
have a well-constrained shock breakout epoch. Gonz´alez-Gait´an et al.(2015) studied the rise times of 223 SN II light curves from SDSS and SNLS and found evidence that the early light curves of most SN II are powered by cooling of shock-heated ejecta. They also found that massive hydrogen envelopes are indeed needed to explain the plateaus of SN II. Sanders et al. (2015) analyzed 76 multiband Pan-STARRS1 (PS1) SN II light curves and concluded that there does not appear to be two unconnected subclasses of SN II (IIP and IIL) but rather a one-parameter family likely related to the original mass of the progenitor, similar to the findings ofAnderson et al. (2014). Sanders et al.
(2015) further confirmed that SN IIP appear to be standardizable with an intrinsic dispersion as low as ∼0.2 mag.
Rubin et al.(2015) published 57 R-band SN II light curves from the Palomar Transient Factory. Valenti et al.(2016)
presented photometry of 12 SN II and combined them with well-sampled light curves from the literature to search for correlations between the slope of the linear light-curve decay and other properties.
In the past year, de Jaeger et al. (2017) presented a Hubble diagram based on 73 SN II with a redshift range of 0.01 ≤ z ≤ 0.50 from the CSP, SDSS and SNLS and found a Hubble diagram dispersion of 0.35 mag by applying the Photometric Colour Method with no redshift information, showing that SN II can be used as pure photometric distance indicators. On a smaller sample of 61 SN II and using spectroscopic information, de Jaeger et al. (2017) measured a dispersion of 0.27 mag. Finally,Gall et al.(2017) presented light curves and spectra of nine SN IIP/L in the redshift range of 0.045 ≤ z ≤ 0.335 and combined them with data from the literature to update previous EPM and SCM Hubble diagrams. An interesting finding is that their three SN IIL are indistinguishable from their SN IIP in both the EPM and SCM Hubble diagrams. Larger samples are needed to confirm this but it suggests that SN IIL may be useful cosmological distance indicators as well. Given their higher luminosity than SN IIP, this could make SN IIL easier to find at higher redshifts, assuming a sufficient observing cadence is used to account for their faster decline. The Harvard-Smithsonian Center for Astrophysics (CfA) Supernova Group has been a source of data for nearby SN since 1993. The primary focus has been SN Ia but numerous CCSN have been observed as well. In addition to various individual SN papers, the CfA1-CfA4 data sets include a total of 345 SN Ia multiband optical light curves (Riess et al.
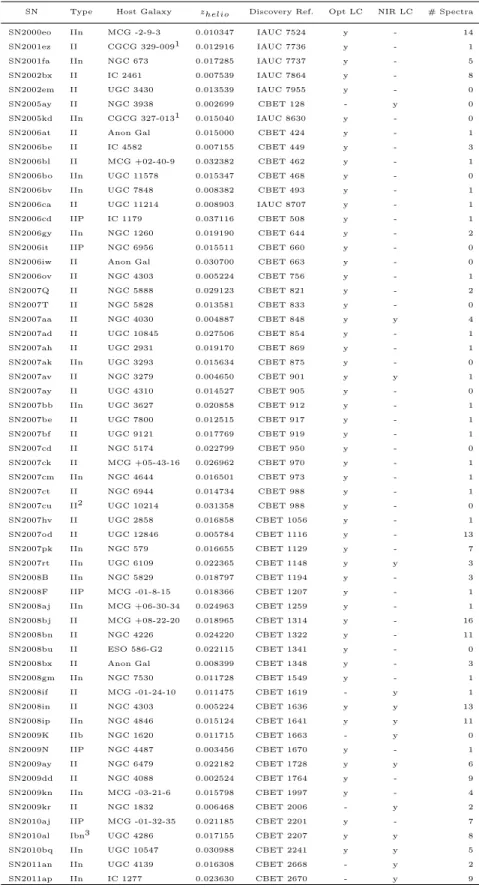
Table 1. SN II Discovery Data
SN Type Host Galaxy zhelio Discovery Ref. Opt LC NIR LC # Spectra
SN2000eo IIn MCG -2-9-3 0.010347 IAUC 7524 y - 14
SN2001ez II CGCG 329-0091 0.012916 IAUC 7736 y - 1
SN2001fa IIn NGC 673 0.017285 IAUC 7737 y - 5
SN2002bx II IC 2461 0.007539 IAUC 7864 y - 8
SN2002em II UGC 3430 0.013539 IAUC 7955 y - 0
SN2005ay II NGC 3938 0.002699 CBET 128 - y 0
SN2005kd IIn CGCG 327-0131 0.015040 IAUC 8630 y - 0
SN2006at II Anon Gal 0.015000 CBET 424 y - 1
SN2006be II IC 4582 0.007155 CBET 449 y - 3
SN2006bl II MCG +02-40-9 0.032382 CBET 462 y - 1
SN2006bo IIn UGC 11578 0.015347 CBET 468 y - 0
SN2006bv IIn UGC 7848 0.008382 CBET 493 y - 1
SN2006ca II UGC 11214 0.008903 IAUC 8707 y - 1
SN2006cd IIP IC 1179 0.037116 CBET 508 y - 1
SN2006gy IIn NGC 1260 0.019190 CBET 644 y - 2
SN2006it IIP NGC 6956 0.015511 CBET 660 y - 0
SN2006iw II Anon Gal 0.030700 CBET 663 y - 0
SN2006ov II NGC 4303 0.005224 CBET 756 y - 1
SN2007Q II NGC 5888 0.029123 CBET 821 y - 2
SN2007T II NGC 5828 0.013581 CBET 833 y - 0
SN2007aa II NGC 4030 0.004887 CBET 848 y y 4
SN2007ad II UGC 10845 0.027506 CBET 854 y - 1
SN2007ah II UGC 2931 0.019170 CBET 869 y - 1
SN2007ak IIn UGC 3293 0.015634 CBET 875 y - 0
SN2007av II NGC 3279 0.004650 CBET 901 y y 1
SN2007ay II UGC 4310 0.014527 CBET 905 y - 0
SN2007bb IIn UGC 3627 0.020858 CBET 912 y - 1
SN2007be II UGC 7800 0.012515 CBET 917 y - 1
SN2007bf II UGC 9121 0.017769 CBET 919 y - 1
SN2007cd II NGC 5174 0.022799 CBET 950 y - 0
SN2007ck II MCG +05-43-16 0.026962 CBET 970 y - 1
SN2007cm IIn NGC 4644 0.016501 CBET 973 y - 1
SN2007ct II NGC 6944 0.014734 CBET 988 y - 1
SN2007cu II2 UGC 10214 0.031358 CBET 988 y - 0
SN2007hv II UGC 2858 0.016858 CBET 1056 y - 1
SN2007od II UGC 12846 0.005784 CBET 1116 y - 13
SN2007pk IIn NGC 579 0.016655 CBET 1129 y - 7
SN2007rt IIn UGC 6109 0.022365 CBET 1148 y y 3
SN2008B IIn NGC 5829 0.018797 CBET 1194 y - 3
SN2008F IIP MCG -01-8-15 0.018366 CBET 1207 y - 1
SN2008aj IIn MCG +06-30-34 0.024963 CBET 1259 y - 1
SN2008bj II MCG +08-22-20 0.018965 CBET 1314 y - 16
SN2008bn II NGC 4226 0.024220 CBET 1322 y - 11
SN2008bu II ESO 586-G2 0.022115 CBET 1341 y - 0
SN2008bx II Anon Gal 0.008399 CBET 1348 y - 3
SN2008gm IIn NGC 7530 0.011728 CBET 1549 y - 1
SN2008if II MCG -01-24-10 0.011475 CBET 1619 - y 1
SN2008in II NGC 4303 0.005224 CBET 1636 y y 13
SN2008ip IIn NGC 4846 0.015124 CBET 1641 y y 11
SN2009K IIb NGC 1620 0.011715 CBET 1663 - y 0 SN2009N IIP NGC 4487 0.003456 CBET 1670 y - 1 SN2009ay II NGC 6479 0.022182 CBET 1728 y y 6 SN2009dd II NGC 4088 0.002524 CBET 1764 y - 9 SN2009kn IIn MCG -03-21-6 0.015798 CBET 1997 y - 4 SN2009kr II NGC 1832 0.006468 CBET 2006 - y 2
SN2010aj IIP MCG -01-32-35 0.021185 CBET 2201 y - 7
SN2010al Ibn3 UGC 4286 0.017155 CBET 2207 y y 8
SN2010bq IIn UGC 10547 0.030988 CBET 2241 y y 5
SN2011an IIn UGC 4139 0.016308 CBET 2668 - y 2
SN2011ap IIn IC 1277 0.023630 CBET 2670 - y 9
1 Host galaxy from NED
2 Type from http://w.astro.berkeley.edu/bait/2007/sn2007cu.html 3 Type fromPastorello et al.(2015)
Note—The SN Type, Host Galaxy and Discovery Reference columns come from www.cbat.eps.harvard.edu/lists/Supernovae.html, except as noted. The redshifts, zhelio, are of the host galaxy and come from NED, except for 2006at (CBET 441), 2006iw (D’Andrea et al.(2010)) and 2008bx (CBET 1359).
et al. 2012) have been published. In the near-infrared, the CfAIR2 set consists of 94 SN Ia light curves (Friedman et
al. 2015) with earlier versions of a subset published byWood-Vasey et al.(2008). The CCSN photometry we acquired
up until 2011 was processed along with the SN Ia photometry when the CfA3, CfA4 and CfAIR2 data sets were produced: 61 optical and 25 near-infrared stripped-envelope light curves were presented in Bianco et al. (2014) and 60 SN II/IIn/IIb/Ibn light curves are presented in this work. Two additional NIR light curves have been published elsewhere: SN 2010jl (Fransson et al. 2014) and SN 2011dh (Marion et al. 2014). One SN IIb NIR light curve was produced after Bianco et al. (2014) and it is presented here. Additionally, optical light curves, spectra and analysis of SN IIP 2005cs and 2006bp were presented in Dessart et al.(2008). Modjaz et al. (2014) presented and analyzed optical spectra of 73 stripped-envelope CCSN while CfA SN II spectra for 47 of the 60 SN from the current paper are presented here. Finally, the CfA5 data set is currently being produced and will include optical SN light curves of all types taken after the CfA4 era (which included SN discovered up to mid-2010) plus any earlier ones that were missing calibration or host-galaxy subtraction images when the CfA4 light curves were created. Spectra from the CfA5-era will also be published.
Section 2 describes the data and reduction and section 3 provides select comparisons of photometry with other data sets for overlapping objects.
2. DATA ACQUISITION AND REDUCTION
The CfA SN II sample consists of 60 objects: 39 SN II/IIP, 19 IIn, one IIb and one that was originally classified as a IIn but later as a Ibn (2010al; see, for example,Pastorello et al. 2015). Forty-six objects have only optical photometry, six have only NIR photometry and eight have both. The median redshift is 0.016. Optical spectra for 47 of the 60 SN are presented in this work. See Table 1 for information on each SN’s type, host galaxy, redshift, discovery reference, optical or NIR photometry, and number of CfA optical spectra. Most of the SN were discovered as part of targeted searches.
There are 54 objects in this work with optical photometry: 36 II/IIP, 17 IIn and one Ibn. Measurements were made in the u0U BV r0i0 bands and consist of a total 2932 light curve points. These data were acquired on the 1.2m telescope at the FLWO4at the same time as the CfA3 and CfA4 SN Ia data sets. Twenty-six SN II light curves were generated
as part of the light curve production process that created the CfA3 set and 28 as part of the process that created the CfA4 set. Five of the CfA3-era SN II light curves were observed on the 4Shooter camera5 (hereafter referred to as CfA34SH), and 21 on the KeplerCam6 (hereafter referred to as CfA3KEP). The 28 CfA4-era SN II light curves
(hereafter referred to as CfA4) were all observed on the KeplerCam. Since all of the optical photometry reported here was produced as part of the CfA3 and CfA4 processing campaigns, see Hicken et al.(2009) andHicken et al.(2012) for greater details on the instruments, observations, photometry pipeline, calibration and host-galaxy subtraction used to create the CfA SN II light curves. It should be noted that the passbands shifted during part of the CfA4 observing campaign, likely due to deposits or condensation on the KeplerCam, resulting in two sets of color terms for the CfA4 calibration: period 1 and period 2, one before the shift and one after. Anyone using the CfA4-era natural system light curves should be careful to use the appropriate-period passbands, which can be found at our website.7 Also, the 1.2m
primary mirror deteriorated during the course of the CfA4 observing, causing a sensitivity loss of about 0.6 mag in V . There are 14 SN with NIR photometry in this work: seven SN II, five IIn, one IIb and one Ibn. We obtained our J HKs-band photometry with the robotic 1.3-m Peters Automated InfraRed Imaging TELescope (PAIRITEL) at
FLWO (Bloom et al. 2006). PAIRITEL was a refurbished version of the Two Micron All Sky Survey (2MASS) North telescope using the transplanted 2MASS South camera (Skrutskie et al. 2006). It was utilized from 2005-2013 as a dedicated NIR imager for follow-up of transients, including SN of all types discovered by optical searches (Bloom et
al. 2006;Bianco et al. 2014;Friedman et al. 2015). Our NIR observing strategy was described elsewhere (Wood-Vasey
et al. 2008;Friedman et al. 2012; Bianco et al. 2014;Friedman et al. 2015). In particular, seeFriedman et al.(2015)
for a detailed discussion of our image reduction and photometry pipelines including mosaicking, sky subtraction, and host galaxy subtraction. Whenever possible, we used an error-weighted mean of light curves derived from multiple host galaxy template images to remove flux contamination at the SN position. Since PAIRITEL was already on the 2MASS system, the SN brightness in each field was determined with differential photometry using reference field stars from the 2MASS point source catalog (Cutri et al. 2003). There are a total of 816 NIR light curve points.
4http://linmax.sao.arizona.edu/FLWO/48/48.html
5http://linmax.sao.arizona.edu/FLWO/48/OLD/4shccd.html 6http://linmax.sao.arizona.edu/FLWO/48/kepccd.html 7www.cfa.harvard.edu/supernova/index.html
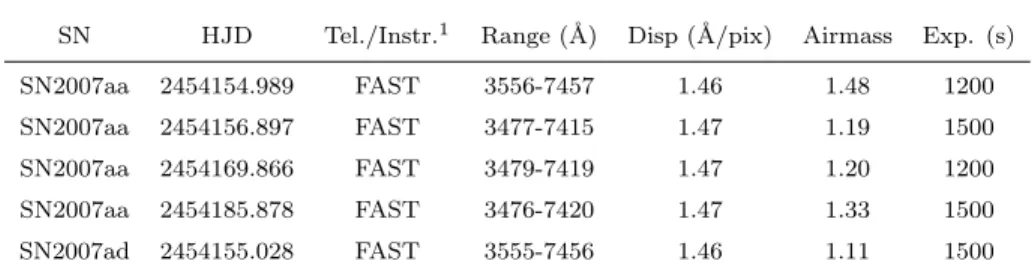
Table 2. Journal of Spectroscopic Observations
SN HJD Tel./Instr.1 Range (˚A) Disp (˚A/pix) Airmass Exp. (s) SN2007aa 2454154.989 FAST 3556-7457 1.46 1.48 1200 SN2007aa 2454156.897 FAST 3477-7415 1.47 1.19 1500 SN2007aa 2454169.866 FAST 3479-7419 1.47 1.20 1200 SN2007aa 2454185.878 FAST 3476-7420 1.47 1.33 1500 SN2007ad 2454155.028 FAST 3555-7456 1.46 1.11 1500 1 Telescope and instrument used for this spectrum: FAST: FLWO1.5m+FAST; MMTblue:
MMT+Blue Channel
Note—Only a portion is shown here for guidance regarding its form and content. This table is available in its entirety in a machine-readable form in the online journal. It is also available at the CfA Web site: www.cfa.harvard.edu/supernova/index.html
Eleven of our 14 NIR light curves had host galaxy subtraction as described inFriedman et al.(2015), while 3 objects were sufficiently isolated from the host galaxy nucleus (SN 2010bq, SN 2011an, SN 2011ap) and forced DoPHOT photometry (Schechter et al. 1993) was used at the SN position without template image subtraction. The NIR light curve of SN 2005ay is presented here while its optical light curves and spectra will be presented in a separate, future paper. The optical light curve of SN 2009K was presented inBianco et al.(2014) but the NIR light curve did not have final calibration and host galaxy images and so it is presented here.
We acquired 192 optical spectra for 47 of the 60 SN in this work. Spectra were obtained using the FLWO 1.5m Tillinghast telescope with the FAST spectrograph (Fabricant et al. 1998) and the MMT Telescope with the Blue Channel Spectrograph. The FAST spectra were taken using a 300slit with an atmospheric corrector. The observations at the MMT were taken with a 100 slit and a 300 line/mm grating at the parallactic slit position. All Spectra were reduced and flux calibrated by a combination of standard IRAF and custom IDL procedures (Matheson et al. 2005). The 2-d spectra underwent flat-fielding, cosmic-ray removal and extraction into 1-d spectra. Pairs of spectroscopic standard stars were obtained to provide flux calibration (with no second order contamination) and assist in the removal of telluric features. For more detail, seeMatheson et al.(2008) andBlondin et al.(2012). The journal of observations of the spectra are in Table2.
2.1. Star Sequences, Light Curves and Spectra
In Table3 we present the standard system optical star sequences for the CfA SN II photometry and in Tables4
and 5 the natural system and standard system optical light curves, respectively. Note should be made of the seven CfA3-era SN II optical light curves that were well-removed from their host galaxies and did not require host-galaxy subtraction. They can be identified in Tables4 and5 as those that have Nhost=0 host subtractions. The rest of the
CfA3-era SN II light curves have Nhost=1. All of the CfA4-era light curves were host-subtracted and have Nhost ≥1.
We remind the reader that the CfA4 period-1 and period-2 natural system passbands are different and so special care should be taken to use the correct period-1 or period-2 passband for the natural system CfA4-era SN II light curves for each point. In the last column of Table 4, KEP1 means it was taken on the KeplerCam during CfA4 period 1 and KEP2 signifies period 2. CfA4-era data before 2009 August 15 (MJD=55058) is period 1 and CfA4-era data after is period 2. The CfA4 Ia light curves (Hicken et al. 2012) usually had multiple host subtractions for each light curve data point, giving rise to multiple values and uncertainties for such a data point. The median of the multiple values, which arise from the multiple subtractions for each data point, was chosen to be the light curve value for that date. The uncertainty was created from two components: the median of the photometric pipeline uncertainties for each light curve point was added in quadrature to the standard deviation of the multiple host-subtraction light curve values for that point. However, the CfA3-era light curves did not have multiple host galaxy subtractions and thus their uncertainty consists only of the photometric pipeline uncertainty. To ensure that the CfA3-era and CfA4-era SN II light curve uncertainties are comparable, we chose to only use the median of the photometric pipeline uncertainties
T able 3. Standard System Star Se q ue nces SN Star RA(J2000) DEC ( J20 00) V N V U − B N U B − V N B V − r 0 Nr 0 V − i 0 N i 0 SN2007aa 01 12:00:38.638 -01:06:5 5.25 16.213(0.014) 2 – 0 1.238 ( 0 .058) 2 0.538(0.023) 2 1.043(0.023 ) 2 SN2007aa 02 12:00:36.905 -01:05:5 3.67 17.245(0.016) 2 – 0 0.556 ( 0 .021) 2 0.149(0.009) 2 0.285(0.011 ) 2 SN2007aa 03 12:00:35.217 -01:03:5 1.48 17.324(0.026) 2 – 0 0.648 ( 0 .055) 2 0.197(0.037) 2 0.366(0.011 ) 2 SN2007aa 04 12:00:25.058 -01:02:4 9.29 17.802(0.030) 2 – 0 0.625 ( 0 .044) 2 0.124(0.027) 2 0.334(0.023 ) 2 SN2007aa 05 12:00:24.144 -01:09:5 5.72 17.359(0.014) 2 – 0 0.533 ( 0 .032) 2 0.138(0.011) 2 0.276(0.009 ) 2 SN2007aa 06 12:00:20.107 -01:06:2 2.99 17.451(0.029) 2 – 0 0.527 ( 0 .039) 2 0.306(0.068) 2 0.436(0.030 ) 2 SN2007aa 07 12:00:19.767 -01:05:0 3.02 15.299(0.012) 2 – 0 0.615 ( 0 .019) 2 0.161(0.018) 2 0.308(0.022 ) 2 SN2007aa 08 12:00:16.229 -01:02:1 4.43 17.954(0.033) 2 – 0 0.736 ( 0 .047) 2 0.246(0.013) 2 0.504(0.010 ) 2 SN2007aa 09 12:00:14.168 -01:04:2 4.72 17.185(0.016) 2 – 0 0.636 ( 0 .017) 2 0.177(0.017) 2 0.325(0.009 ) 2 SN2007aa 10 12:00:08.517 -01:07:1 8.48 15.374(0.015) 2 – 0 1.406 ( 0 .022) 2 0.574(0.014) 2 1.255(0.011 ) 2 SN2007aa 11 12:00:07.955 -01:04:4 2.70 16.902(0.020) 2 – 0 1.349 ( 0 .018) 2 0.555(0.012) 2 1.085(0.012 ) 2 SN2007aa 12 12:00:07.616 -01:04:5 7.01 16.756(0.012) 2 – 0 0.685 ( 0 .015) 2 0.196(0.022) 2 0.357(0.009 ) 2 Note —Only a p ortion is sho wn here for gu idance regarding its form and c o n ten t. This table is a v ailable in its en tiret y in a mac hine-readable form in the online journal. It is a lso a v ailable at the CfA W eb site: www.cfa.harv ard.edu/sup erno v a/index.h tml
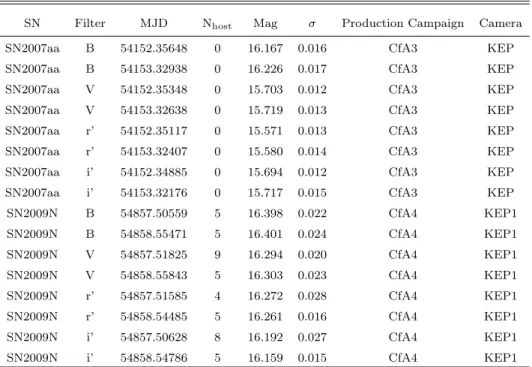
Table 4. Natural-System SN Light Curves
SN Filter MJD Nhost Mag σ Production Campaign Camera
SN2007aa B 54152.35648 0 16.167 0.016 CfA3 KEP
SN2007aa B 54153.32938 0 16.226 0.017 CfA3 KEP
SN2007aa V 54152.35348 0 15.703 0.012 CfA3 KEP
SN2007aa V 54153.32638 0 15.719 0.013 CfA3 KEP
SN2007aa r’ 54152.35117 0 15.571 0.013 CfA3 KEP
SN2007aa r’ 54153.32407 0 15.580 0.014 CfA3 KEP
SN2007aa i’ 54152.34885 0 15.694 0.012 CfA3 KEP
SN2007aa i’ 54153.32176 0 15.717 0.015 CfA3 KEP
SN2009N B 54857.50559 5 16.398 0.022 CfA4 KEP1 SN2009N B 54858.55471 5 16.401 0.024 CfA4 KEP1 SN2009N V 54857.51825 9 16.294 0.020 CfA4 KEP1 SN2009N V 54858.55843 5 16.303 0.023 CfA4 KEP1 SN2009N r’ 54857.51585 4 16.272 0.028 CfA4 KEP1 SN2009N r’ 54858.54485 5 16.261 0.016 CfA4 KEP1
SN2009N i’ 54857.50628 8 16.192 0.027 CfA4 KEP1
SN2009N i’ 54858.54786 5 16.159 0.015 CfA4 KEP1
Note—This table presents the CfA natural-system SN II photometry. Nhostis the number of host-galaxy images subtracted from the same data image. Nhost=0 means no host-galaxy subtraction was performed and the SN was sufficiently removed from the host galaxy. σ is the same as the light curve uncertainty as used inHicken et al.(2009) and is the same as σpipe inHicken et
al. (2012). The penultimate column lists during which light curve production campaign that data point was produced: CfA3 or CfA4. The last column lists which camera the SN data was acquired with. For CfA4 data, a 1 or 2 is appended to ’KEP’ to indicate if it was taken during period 1 or 2 and which set of natural-system bandpasses should be used. Only the first two nights in each band of two SN (one from CfA3 and one from CfA4) are shown here for guidance regarding its form and content. This table is available in its entirety in a machine-readable form in the online journal. It is also available at the CfA Web site, as are the natural-system passbands: www.cfa.harvard.edu/supernova/index.html
for the CfA4-era SN II light curves in this work (as opposed to adding it in quadrature to the standard deviation of the multiple subtraction light curve values for a given data point).
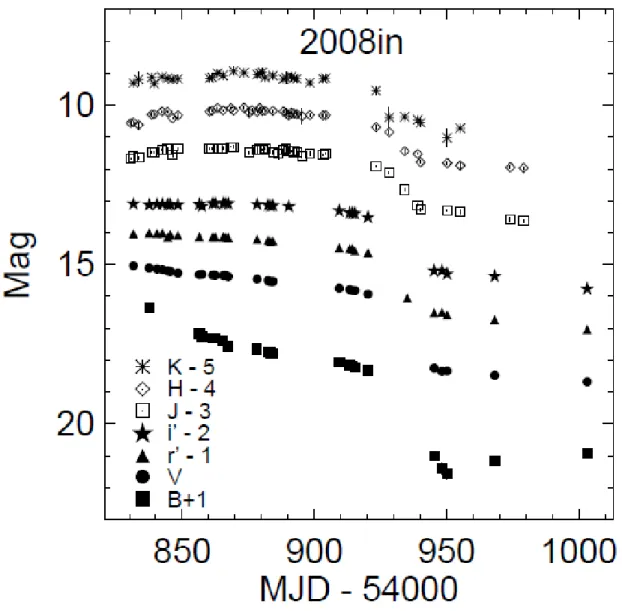
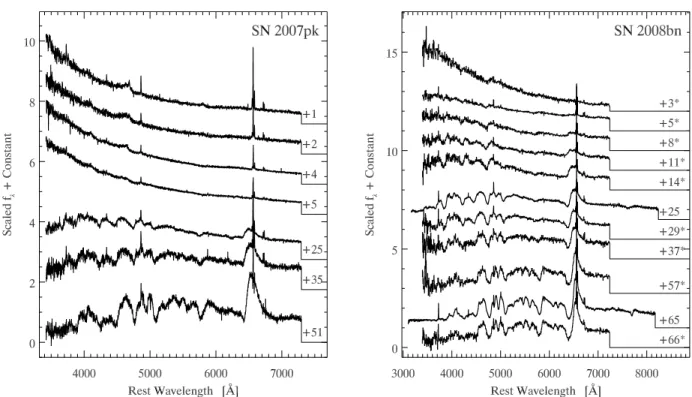
In Table6we present the PAIRITEL NIR light curves. Figures1and2show two examples of CfA SN II light curves: one optical (SN 2008bn) and one with both optical and NIR (SN 2008in). Figure 3 shows the spectral series of SN 2007pk, a IIn, and SN 2008bn, a IIP. The photometry and spectra are available from the journal, the CfA SN Group website8and The Open Supernova Catalog.9 The natural system passbands mentioned inHicken et al.(2012) are also
available at our website. The period-1 passbands can be used for the CfA3 KeplerCam and the CfA4 period-1 natural system light curves while the period-2 passbands can be used for the CfA4 period-2 natural system light curves. The 4Shooter natural system passbands can be found inJha et al. (2006) for use with the CfA3 4Shooter natural system light curves.
3. PHOTOMETRY COMPARISON WITH OTHER SAMPLES
We compared the BV r0i0 CfA SN II star sequences and light curves with overlapping data from two other groups and find reasonable agreement overall, although a few objects have larger discrepancies.
8www.cfa.harvard.edu/supernova/index.html 9https://sne.space/about/
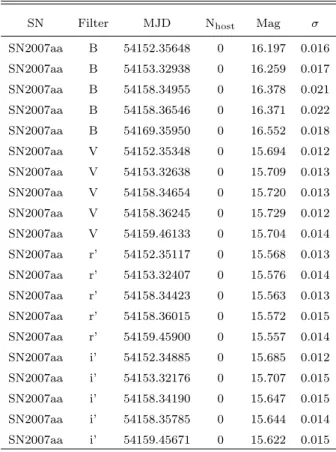
Table 5. Standard-System SN Light Curves
SN Filter MJD Nhost Mag σ
SN2007aa B 54152.35648 0 16.197 0.016 SN2007aa B 54153.32938 0 16.259 0.017 SN2007aa B 54158.34955 0 16.378 0.021 SN2007aa B 54158.36546 0 16.371 0.022 SN2007aa B 54169.35950 0 16.552 0.018 SN2007aa V 54152.35348 0 15.694 0.012 SN2007aa V 54153.32638 0 15.709 0.013 SN2007aa V 54158.34654 0 15.720 0.013 SN2007aa V 54158.36245 0 15.729 0.012 SN2007aa V 54159.46133 0 15.704 0.014 SN2007aa r’ 54152.35117 0 15.568 0.013 SN2007aa r’ 54153.32407 0 15.576 0.014 SN2007aa r’ 54158.34423 0 15.563 0.013 SN2007aa r’ 54158.36015 0 15.572 0.015 SN2007aa r’ 54159.45900 0 15.557 0.014 SN2007aa i’ 54152.34885 0 15.685 0.012 SN2007aa i’ 54153.32176 0 15.707 0.015 SN2007aa i’ 54158.34190 0 15.647 0.015 SN2007aa i’ 54158.35785 0 15.644 0.014 SN2007aa i’ 54159.45671 0 15.622 0.015
Note—This table presents the CfA standard-system SN II photometry. Nhost is the number of host-galaxy images subtracted from the same data image. Nhost=0 means no host-galaxy subtraction was performed and the SN was suf-ficiently removed from the host galaxy. σ is the same as the light curve uncertainty as used inHicken et al. (2009) and is the same as σpipe in Hicken et al. (2012). Only the first five nights in each band of one SN are shown here for guidance regarding its form and content. This table is available in its entirety in a machine-readable form in the online journal. It is also available at the CfA Web site: www.cfa.harvard.edu/supernova/index.html
3.1. Comparison of CfA and Pan-STARRS1 Star Sequences
Scolnic et al. (2015) (S15) introduced the Supercal method which provides a very useful analysis tool to estimate
systematic photometric offsets among many of the SN Ia samples, including those from the CfA. Their work enables the different samples to be placed much more reliably on one photometric system. For anyone combining SN II samples from various groups and needing to put them on one system, we recommend that either the offsets from S15 be applied for photometric systems covered by S15 or that the general method be followed to calculate offsets for photometric systems not covered.
To check how accurate our star sequence calibrations are, we did not apply the Supercal method but simply compared our standard system star photometry with the recently released Pan-STARRS1 (PS1) Catalog10, converted to the
standard system. Using the coordinates for each of the stars from Table3, we searched the PS1 catalog. We required a separation of 0.5 arc seconds or less for a match. We added the offsets from Table 3 ofScolnic et al.(2015) to transform
Figure 1. Optical light curves of SN 2008bn. Most error bars are smaller than the symbols.
the PS1 catalog values (which have the calibration of S15) to the Tonry et al. (2012) calibration. We then applied the transformation equations of Table 6 of Tonry et al. (2012) to convert to the standard system BV ri. Finally, we converted from SDSS11ri toSmith et al. (2002) r0i0, though there is minimal difference. Similar to S15, we removed
PS1 stars brighter than 14.8, 14.9 and 15.1 mag in gri to avoid saturated stars and used the broader of the two S15 color ranges (0.3 < g − i < 1.0) in order to have more stars to compare with. After applying these conditions, 50 of the 54 CfA SN II optical star sequences still had some stars in common with the PS1 Catalog. Additionally, we had a star sequence (but no light curve) for SN 2004et that we compared with PS1, bringing the number of star sequences compared with PS1 to 51.
The weighted means of the CfA-minus-PS1 matched-star differences are shown in Table7for the CfA SN II sample as a whole, and for the separate CfA34SH, CfA3KEPand CfA4 matched-star subsamples. No effort was made to convert
the CfA34SH RI bands into ri and so only BV comparisons are available for CfA34SH stars. The weighted-average
differences of all the stars combined for the respective BV r0i0 bands are -0.018, 0.001, 0.012 and -0.014 mag.
In this work, the CfA B calibration is about 0.02 brighter, in the same direction found by S15 in their Table 4 (NGSL column). It should be noted that the comparisons of this work and S15 are not the same. First of all, the star sequences in S15 are different from those in this work. More importantly, S15 used observed natural-system
Figure 2. Optical and NIR light curves of SN 2008in. Most error bars are smaller than the symbols.
and synthetic natural-system photometry while this work is using standard system photometry so any similarities or differences in the values between the two works’ offsets are not conclusive but merely suggestive.
In this work, CfA V has virtually no offset with the PS1 conversion to V for the CfA34SH and CfA4 subsamples, in
rough agreement with S15. However, the CfA3KEP subsample is 0.012 mag fainter, about 0.01 mag fainter than the
offset S15 found.
CfA r0 is fainter than PS1 in this work, as is the case in S15, though the offset here is greater than in S15. There is excellent agreement between the CfA3KEPi0 offsets in the two works but the CfA4 i0 offset in this work is 0.0165 mag
brighter while there is virtually no offset in S15.
With the exception of CfA3KEP V and CfA4 i0, there is reasonable directional agreement in the CfA-minus-PS1
offsets of this work and S15, in the sense of both agreeing on which calibration is fainter or brighter.
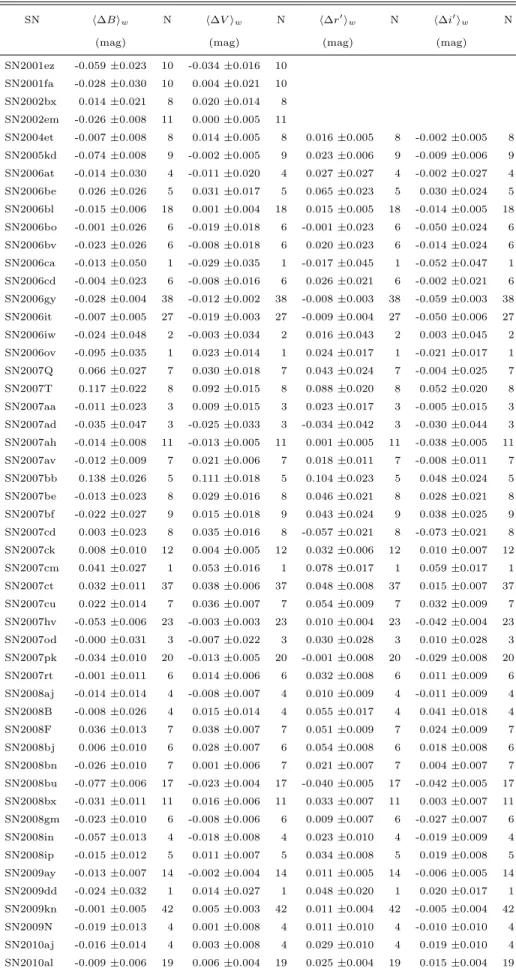
On a SN-by-SN basis, Table8 shows the weighted mean of the CfA-minus-PS1 star differences for each CfA SN II that had matches. 19 of the 51 SN II (37%) have V offsets within ±0.01 mag, 34 (67%) have V offsets within ±0.02 mag, 42 (82%) within ±0.03 mag, and 48 (94%) within ±0.038 mag. These can be considered to have reasonable agreement with PS1. However, there are 3 SN with larger calibration discrepancies. SN 2007bb has a V offset of 0.111
Figure 3. Examples of SN II spectral series from the CfA SN Group. The flux units are fλ(erg s−1cm−2˚A−1) that have been
normalized and then additive offsets applied for clarity. The zero-flux level for each spectrum is marked with an extension on the red edge. The wavelength axis is corrected for the recession velocity of the host galaxy. The number associated with each spectrum indicates the age in (rest-frame) days from the date of discovery. Spectra with low S/N have been binned to 5 ˚A per pixel; they are indicated with an asterisk appended to the age label. Shown are spectra of a Type IIn (SN 2007pk) and a Type IIP (SN 2008bn).
mag based on 5 matched stars, SN 2007T has a 0.092 mag offset based on 8 stars and SN 2007cm has a 0.053 mag offset based on only 1 star.
3.2. Comparison of CfA and CSP Star Sequences and SN II Light Curves
The CSP provided us with standard-system BV r0i star sequences for their upcoming SN II light curve publication (Carlos Contreras — private communication). Table 9 shows the BV r0i0 comparisons between 8 CfA and CSP star sequences, with the average of the differences in V ranging from -0.014 to 0.035 mag, showing reasonable agreement.
We also took the CSP natural system V light curves for 7 objects from Anderson et al. (2014) and the natural system BV r0i0 light curves for SN 2006bo fromTaddia et al.(2013) and applied color terms12to convert them to the
standard system and compare with the CfA standard system light curves from Table5. Applying star-derived color terms to SN photometry to create standard system light curves is fraught with danger and inaccuracy (the user is encouraged to use the natural system light curves whenever possible) so this is intended only as a rough comparison and sanity check. Only points that are within 0.6d of each other are matched. No interpolation was used to provide for more points of comparison. Table 10shows the average of the light curve differences for the 8 SN II in common (11 comparisons in total: 8 in V and 1 in each of Br0i0). Of the 11 comparisons, eight are within ±0.04 mag while one has CfA 0.046 mag brighter, another has CfA 0.071 mag fainter and the most disparate one has CfA 0.106 mag fainter. This is comparable to the similarity that the CfA3 and CfA4 SN Ia light curves had with other groups’ light curves inHicken et al.(2009) andHicken et al.(2012) and suggests that the CfA SN II light curves are of reasonable accuracy.
4. CONCLUSION
The CfA SN II light curve sample consists of 60 multiband light curves: 46 have only optical, six have only NIR and eight have both optical and NIR. We also present 192 optical spectra for 47 of the 60 SN. This work includes a total of
12CT
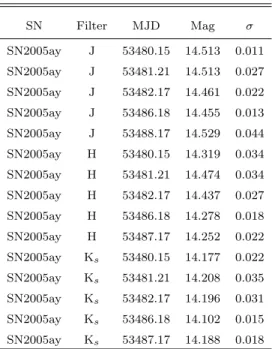
Table 6. NIR Natural-System SN Light Curves SN Filter MJD Mag σ SN2005ay J 53480.15 14.513 0.011 SN2005ay J 53481.21 14.513 0.027 SN2005ay J 53482.17 14.461 0.022 SN2005ay J 53486.18 14.455 0.013 SN2005ay J 53488.17 14.529 0.044 SN2005ay H 53480.15 14.319 0.034 SN2005ay H 53481.21 14.474 0.034 SN2005ay H 53482.17 14.437 0.027 SN2005ay H 53486.18 14.278 0.018 SN2005ay H 53487.17 14.252 0.022 SN2005ay Ks 53480.15 14.177 0.022 SN2005ay Ks 53481.21 14.208 0.035 SN2005ay Ks 53482.17 14.196 0.031 SN2005ay Ks 53486.18 14.102 0.015 SN2005ay Ks 53487.17 14.188 0.018
Note—This table presents the CfA NIR natural-system SN II photometry. Only the first five nights in each band of one SN are shown here for guidance regarding its form and con-tent. This table is available in its entirety in a machine-readable form in the online jour-nal. It is also available at the CfA Web site: www.cfa.harvard.edu/supernova/index.html
2932 optical and 816 NIR light curve points. There are 26 optical and two NIR light curves of SN II/IIP with redshifts z > 0.01, some of which may give rise to useful distances for Hubble diagrams. Select comparisons with other groups’ data show reasonable agreement in the vast majority of cases. These light curves add to a growing body of SN II data from the literature. This collective body of data (from the literature, this work and future samples) will be useful for providing greater insight into SN II explosions, developing analytic methods for photometric SN classification, and opening the path for their increasing use as cosmological distance indicators. Having another method for measuring the expansion history of the Universe, independent from SN Ia, will serve the important purpose of either confirming the results derived from SN Ia or offering insights for improving the cosmological use of SN Ia. Having an independent set of distances will enable a deeper study of SN Ia systematic errors and evolution with redshift. A larger set of SN II light curves is also useful for efforts to better photometrically identify SN types. By having a more complete picture of the range and frequency of SN II light curve properties, positive identification of SN II will be more likely, which will be useful both in building up a sample of SN II and in excluding them with confidence from samples of other types, particularly SN Ia. This will become increasingly important as large surveys provide far more SN light curves than spectroscopic identification resources can handle.
We thank the FLWO staff for their dedicated work in maintaining the 1.2m and 1.5m telescopes and instruments, as well as the 1.3m PAIRITEL when it was in full operation. We likewise thank the MMT staff. We are grateful to Dan Scolnic for discussions on comparing the CfA SN II star sequences with the Pan-STARRS1 stars, and Carlos Contreras and Joseph Anderson for help in comparing CfA SN II star sequences with the CSP. We also thank Kaisey Mandel and Arturo Avelino for helpful discussions. This work has been supported, in part, by NSF grants 0606772, AST-0907903, AST-1211196, AST-1516854 and NASA grant NNX15AJ55G to Harvard University. A.S.F. acknowledges
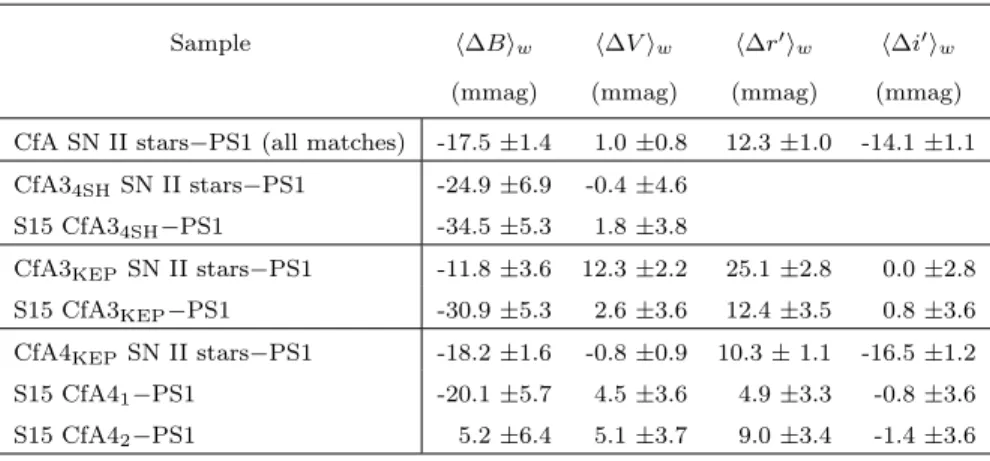
Table 7. Comparison of CfA SN II Star Sequences with Pan-STARRS1 by CfA Subsample
Sample h∆Biw h∆V iw h∆r0iw h∆i0iw (mmag) (mmag) (mmag) (mmag)
CfA SN II stars−PS1 (all matches) -17.5 ±1.4 1.0 ±0.8 12.3 ±1.0 -14.1 ±1.1 CfA34SHSN II stars−PS1 -24.9 ±6.9 -0.4 ±4.6
S15 CfA34SH−PS1 -34.5 ±5.3 1.8 ±3.8
CfA3KEPSN II stars−PS1 -11.8 ±3.6 12.3 ±2.2 25.1 ±2.8 0.0 ±2.8 S15 CfA3KEP−PS1 -30.9 ±5.3 2.6 ±3.6 12.4 ±3.5 0.8 ±3.6 CfA4KEPSN II stars−PS1 -18.2 ±1.6 -0.8 ±0.9 10.3 ± 1.1 -16.5 ±1.2 S15 CfA41−PS1 -20.1 ±5.7 4.5 ±3.6 4.9 ±3.3 -0.8 ±3.6 S15 CfA42−PS1 5.2 ±6.4 5.1 ±3.7 9.0 ±3.4 -1.4 ±3.6
Note—This table presents the weighted mean of the difference between standard system CfA and Pan-STARRS1 matched stars (CfA minus PS1) in BV r0i0for the whole CfA SN II sample and for the subsamples listed, subject to the luminosity and color restrictions mentioned in the text. Below each subsample’s line from this work is the S15 NGSL offset to serve as a rough comparison. However, note that the quantities from this work and S15 are not directly comparable since they are different things, nor are they based on the same sample of stars, so any similarity or difference is more suggestive than conclusive. Also, note that the signs for the S15 NGSL differences are reversed here since the order of subtraction is CfA minus PS1 here, versus PS1 minus CfA in S15.
support from NSF Awards SES 1056580 and PHY 1541160. M. Modjaz is supported in part by the NSF CAREER award AST-1352405 and by the NSF award AST-1413260.
Table 8. Comparison of CfA SN II Star Sequences with Pan-STARRS1 by SN
SN h∆Biw N h∆V iw N h∆r0iw N h∆i0iw N
(mag) (mag) (mag) (mag)
SN2001ez -0.059 ±0.023 10 -0.034 ±0.016 10 SN2001fa -0.028 ±0.030 10 0.004 ±0.021 10 SN2002bx 0.014 ±0.021 8 0.020 ±0.014 8 SN2002em -0.026 ±0.008 11 0.000 ±0.005 11 SN2004et -0.007 ±0.008 8 0.014 ±0.005 8 0.016 ±0.005 8 -0.002 ±0.005 8 SN2005kd -0.074 ±0.008 9 -0.002 ±0.005 9 0.023 ±0.006 9 -0.009 ±0.006 9 SN2006at -0.014 ±0.030 4 -0.011 ±0.020 4 0.027 ±0.027 4 -0.002 ±0.027 4 SN2006be 0.026 ±0.026 5 0.031 ±0.017 5 0.065 ±0.023 5 0.030 ±0.024 5 SN2006bl -0.015 ±0.006 18 0.001 ±0.004 18 0.015 ±0.005 18 -0.014 ±0.005 18 SN2006bo -0.001 ±0.026 6 -0.019 ±0.018 6 -0.001 ±0.023 6 -0.050 ±0.024 6 SN2006bv -0.023 ±0.026 6 -0.008 ±0.018 6 0.020 ±0.023 6 -0.014 ±0.024 6 SN2006ca -0.013 ±0.050 1 -0.029 ±0.035 1 -0.017 ±0.045 1 -0.052 ±0.047 1 SN2006cd -0.004 ±0.023 6 -0.008 ±0.016 6 0.026 ±0.021 6 -0.002 ±0.021 6 SN2006gy -0.028 ±0.004 38 -0.012 ±0.002 38 -0.008 ±0.003 38 -0.059 ±0.003 38 SN2006it -0.007 ±0.005 27 -0.019 ±0.003 27 -0.009 ±0.004 27 -0.050 ±0.006 27 SN2006iw -0.024 ±0.048 2 -0.003 ±0.034 2 0.016 ±0.043 2 0.003 ±0.045 2 SN2006ov -0.095 ±0.035 1 0.023 ±0.014 1 0.024 ±0.017 1 -0.021 ±0.017 1 SN2007Q 0.066 ±0.027 7 0.030 ±0.018 7 0.043 ±0.024 7 -0.004 ±0.025 7 SN2007T 0.117 ±0.022 8 0.092 ±0.015 8 0.088 ±0.020 8 0.052 ±0.020 8 SN2007aa -0.011 ±0.023 3 0.009 ±0.015 3 0.023 ±0.017 3 -0.005 ±0.015 3 SN2007ad -0.035 ±0.047 3 -0.025 ±0.033 3 -0.034 ±0.042 3 -0.030 ±0.044 3 SN2007ah -0.014 ±0.008 11 -0.013 ±0.005 11 0.001 ±0.005 11 -0.038 ±0.005 11 SN2007av -0.012 ±0.009 7 0.021 ±0.006 7 0.018 ±0.011 7 -0.008 ±0.011 7 SN2007bb 0.138 ±0.026 5 0.111 ±0.018 5 0.104 ±0.023 5 0.048 ±0.024 5 SN2007be -0.013 ±0.023 8 0.029 ±0.016 8 0.046 ±0.021 8 0.028 ±0.021 8 SN2007bf -0.022 ±0.027 9 0.015 ±0.018 9 0.043 ±0.024 9 0.038 ±0.025 9 SN2007cd 0.003 ±0.023 8 0.035 ±0.016 8 -0.057 ±0.021 8 -0.073 ±0.021 8 SN2007ck 0.008 ±0.010 12 0.004 ±0.005 12 0.032 ±0.006 12 0.010 ±0.007 12 SN2007cm 0.041 ±0.027 1 0.053 ±0.016 1 0.078 ±0.017 1 0.059 ±0.017 1 SN2007ct 0.032 ±0.011 37 0.038 ±0.006 37 0.048 ±0.008 37 0.015 ±0.007 37 SN2007cu 0.022 ±0.014 7 0.036 ±0.007 7 0.054 ±0.009 7 0.032 ±0.009 7 SN2007hv -0.053 ±0.006 23 -0.003 ±0.003 23 0.010 ±0.004 23 -0.042 ±0.004 23 SN2007od -0.000 ±0.031 3 -0.007 ±0.022 3 0.030 ±0.028 3 0.010 ±0.028 3 SN2007pk -0.034 ±0.010 20 -0.013 ±0.005 20 -0.001 ±0.008 20 -0.029 ±0.008 20 SN2007rt -0.001 ±0.011 6 0.014 ±0.006 6 0.032 ±0.008 6 0.011 ±0.009 6 SN2008aj -0.014 ±0.014 4 -0.008 ±0.007 4 0.010 ±0.009 4 -0.011 ±0.009 4 SN2008B -0.008 ±0.026 4 0.015 ±0.014 4 0.055 ±0.017 4 0.041 ±0.018 4 SN2008F 0.036 ±0.013 7 0.038 ±0.007 7 0.051 ±0.009 7 0.024 ±0.009 7 SN2008bj 0.006 ±0.010 6 0.028 ±0.007 6 0.054 ±0.008 6 0.018 ±0.008 6 SN2008bn -0.026 ±0.010 7 0.001 ±0.006 7 0.021 ±0.007 7 0.004 ±0.007 7 SN2008bu -0.077 ±0.006 17 -0.023 ±0.004 17 -0.040 ±0.005 17 -0.042 ±0.005 17 SN2008bx -0.031 ±0.011 11 0.016 ±0.006 11 0.033 ±0.007 11 0.003 ±0.007 11 SN2008gm -0.023 ±0.010 6 -0.008 ±0.006 6 0.009 ±0.007 6 -0.027 ±0.007 6 SN2008in -0.057 ±0.013 4 -0.018 ±0.008 4 0.023 ±0.010 4 -0.019 ±0.009 4 SN2008ip -0.015 ±0.012 5 0.011 ±0.007 5 0.034 ±0.008 5 0.019 ±0.008 5 SN2009ay -0.013 ±0.007 14 -0.002 ±0.004 14 0.011 ±0.005 14 -0.006 ±0.005 14 SN2009dd -0.024 ±0.032 1 0.014 ±0.027 1 0.048 ±0.020 1 0.020 ±0.017 1 SN2009kn -0.001 ±0.005 42 0.005 ±0.003 42 0.011 ±0.004 42 -0.005 ±0.004 42 SN2009N -0.019 ±0.013 4 0.001 ±0.008 4 0.011 ±0.010 4 -0.010 ±0.010 4 SN2010aj -0.016 ±0.014 4 0.003 ±0.008 4 0.029 ±0.010 4 0.019 ±0.010 4 SN2010al -0.009 ±0.006 19 0.006 ±0.004 19 0.025 ±0.004 19 0.015 ±0.004 19 Note—This table presents the weighted mean of the difference between standard system CfA and PS1
stars (CfA minus PS1) in BVr’i’ for each individual SN’s star sequence and how many stars were matched. 50 CfA SN II have star matches with PS1 after luminosity and color restrictions. Four SN star sequences have no PS1 matches. Additionally, we calibrated a star sequence for SN 2004et on the KeplerCam and include it in this analysis even though the light curve is not available.
Table 9. Comparison of CfA SN II Star Sequences with CSP by SN
SN h∆Bi N h∆V i N h∆r0i N h∆i0i N
(mag) (mag) (mag) (mag)
SN2006be 0.004 5 0.036 5 0.058 4 0.036 5 SN2006bl -0.016 13 0.002 13 0.015 13 0.002 13 SN2006bo -0.023 4 -0.017 4 -0.083 4 -0.017 4 SN2006it -0.025 12 -0.015 12 -0.019 12 -0.015 12 SN2007aa 0.016 10 0.017 10 0.043 10 0.017 10 SN2007od -0.018 6 -0.015 6 -0.014 6 -0.015 6 SN2008bu -0.006 9 0.019 9 0.024 9 0.019 9 SN2009N 0.029 8 0.039 8 0.051 7 0.039 8
Note—This table presents the average of the difference between stan-dard system CfA and CSP stars (CfA minus CSP) in BVr’i’ for 8 individual SN star sequences and how many stars were matched.
Table 10. Comparison of CfA SN II Light Curves with CSP by SN
SN Band h∆magi N SN2006bo B -0.027 3 SN2006bo V -0.046 4 SN2006bo r’ -0.033 4 SN2006bo i’ -0.011 4 SN2006be V 0.071 7 SN2006bl V 0.106 5 SN2006it V -0.038 1 SN2007aa V -0.010 5 SN2007od V -0.015 6 SN2008bu V -0.033 1 SN2009N V 0.032 1
Note—This table presents the aver-age of the difference between stan-dard system CfA and CSP light curve points for eight SN (CfA mi-nus CSP, with ∆MJD < 0.6d), in BVr’i’ for 2006bo and V for the other seven, and how many light curve points were matched.
REFERENCES
Anderson, J. P., Gonzlez-Gaitn, S., Hamuy, M., et al. 2014, ApJ, 786, 67
Arcavi, I., Gal-Yam, A., Cenko, S. B., et al. 2012, ApJ, 756, L30
Bianco, F. B., Modjaz, M., Hicken, M., et al. 2014, ApJS, 213, 19
Bloom, J. S., Starr, D. L., Skrutskie, M. F., et al. 2006, ASPC, 351, 751
Blondin, S., Matheson, T., Kirshner, R. P., et al. 2012, AJ, 143, 126
Cutri, R. M., Skrutskie, M. F., van Dyk, S., et al. 2003, The IRSA 2MASS All-Sky Point Source Catalog, NASA/IPAC Infrared Science Archive
de Jaeger, T., Gonzlez-Gaitn, S., Hamuy, M., et al. 2017, ApJ, 835, 166
D’Andrea, C. B., Sako, M., Dilday, B., et al. 2010, ApJ, 708, 661
Dessart, L., Blondin, S., Brown, P. J., et al. 2008, ApJ, 675, 644
Fabricant, D., Cheimets, P., Caldwell, N. & Geary, J. 1998, PASP, 110, 79
Faran, T., Poznanski, D., Filippenko, A. V., et al. 2014, MNRAS, 442, 844
Fransson, C., Ergon, M., Challis, P., et al. 2014, ApJ, 797, 118
Friedman, A. S., PhD thesis, Harvard University
Friedman, A. S., Wood-Vasey, W. M., G. H. Marion, et al. 2015, ApJS, 220, 9
Galbany, L., Gonzlez-Gaitn, S., Phillips, M. M., et al. 2016, AJ, 151, 33
Gall, E. E. E., Kotak, R., Leibundgut, B., et al. arXiv:1705.10806 [astro-ph.CO]
Gall, E. E. E., Polshaw, J., Kotak, R., et al. 2015, A&A, 582, A3
Gal-Yam, A. arXiv:1611.09353 [astro-ph.HE]
Gonz´alez-Gait´an, S., Tominaga, N., Molina, J., et al. 2015, MNRAS, 451, 2212
Guti´errez, C., (2016) Spectral Analysis of Type II Supernovae (Doctoral Thesis). Retrieved from http://repositorio.uchile.cl/handle/2250/141777 Hicken, M., Wood-Vasey, W. M., Blondin, S., et al. 2009,
ApJ, 700, 331
Hicken, M., Challis, P., Kirshner, R. P., et al. 2012, ApJS, 200, 12
Jha, S., Kirshner, R. P., Challis, P., et al. 2006, AJ, 131, 527 Kirshner, R. P. & Kwan, J. 1974, ApJ, 193, 27
Kirshner, R. P. & Kwan, J. 1975, ApJ, 197, 415
Liu, Y. Q., Modjaz, M., Bianco, F. B., & Graur, O. 2016, ApJ, 827, 90
Maguire, K., Kotak, R., Smartt, S. J., et al. 2010 MNRAS, 403, L11
Marion, G. H., Vinko, J., Kirshner, R. P., et al. 2014, ApJ, 781, 69
Matheson, T., Kirshner, R. P., Challis, P., et al. 2008, AJ, 135, 1598
Matheson, T., Blondin, S., Foley, R. J., et al. 2005, AJ, 129, 2352
Modjaz, M., Blondin, S., Kirshner, R. P., et al. 2014, AJ, 147, 99
Modjaz, M., Liu, Y. Q., Bianco, F. B., & Graur, O. 2016, ApJ, 832, 108
Morozova, V., Piro, A. L., & Valenti, S. 2017, ApJ, 838, 28 Pastorello, A., Benetti, S., Brown, P. J., et al. 2015,
MNRAS, 449, 1921
Planck Collaboration: Ade, P. A. R., Aghanim, M., Arnaud, M., et al. 2016, A&A, 594, A13
Poznanski, D., Butler, N., Filippenko, A. V., et al. 2009, ApJ, 694, 1067
Richardson, D., Branch, D., Casebeer, D., et al. 2002, AJ, 123, 745
Riess, A. G., Kirshner, R. P., Schmidt, B. B., et al. 1999, AJ, 117, 707
Riess, A. G., Macri, L. M., Hoffman, S. L., et al. 2016, ApJ, 826, 56
Rodr´ıguez, O., Clocchiatti, A., & Hamuy, M. 2014, AJ, 148, 107
Rodr´ıguez, O., Pignata, G. & Hamuy, M., 2016,
http://sn2016.cl/documents/posters/poster rodriguez.pdf Rubin, A., Gal-Yam, A., De Cia, A., et al.
arXiv:1512.00733 [astro-ph.HE]
Sanders, N. E., Soderberg, A. M., Gezari, S., et al. 2015, ApJ, 799, 208
Schechter, P. L., Mateo, M., & Saha, A. 1993, PASP, 105, 1342
Schmidt, .B, P., Kirshner, R. P., & Eastman, R., G. 1992, ApJ, 395, 366
Schmidt, B., P., Kirshner, R. P., Eastman, R., G., et al. 1994, ApJ, 432, 42
Scolnic, D., Casertano, S., Riess, A., et al. 2015, ApJ, 815, 117
Skrutskie, M. F., Cutri, R. M., Stiening, R., et al. 2006, AJ, 131, 1163
Smartt, S. J., Eldridge, J. J., Crockett, R. M., & Maund, J. R. 2009, MNRAS, 395, 1409
Smith, J. A., Tucker, D. L., Kent, S., et al. 2002, AJ, 123, 2121
Stritzinger, M. D., Phillips, M. M., Boldt, L. N., et al. 2011, AJ, 142, 156
Taddia, F., Stritzinger, M. D., Sollerman, J., et al. 2013, A&A, 555, A10
Tonry, J. L., Stubbs, C. W., Lykke, K. R., et al. 2012, ApJ, 750, 99
Van Dyk, S. D., Cenko, S. B., Poznanski, D., et al. 2012, ApJ, 756, 131
Wood-Vasey, W. M., Friedman, A. S., Bloom, J. S., et al. 2008, ApJ, 689, 377
Valenti, S., Howell, D. A., Stritzinger, M. D., et al. 2016, MNRAS, 459, 3939