HAL Id: hal-02993736
https://hal.archives-ouvertes.fr/hal-02993736
Submitted on 7 Nov 2020
HAL is a multi-disciplinary open access
archive for the deposit and dissemination of
sci-entific research documents, whether they are
pub-lished or not. The documents may come from
teaching and research institutions in France or
abroad, or from public or private research centers.
L’archive ouverte pluridisciplinaire HAL, est
destinée au dépôt et à la diffusion de documents
scientifiques de niveau recherche, publiés ou non,
émanant des établissements d’enseignement et de
recherche français ou étrangers, des laboratoires
publics ou privés.
First detection of stacked X-ray emission from cosmic
web filaments
H. Tanimura, N. Aghanim, A. Kolodzig, M. Douspis, N. Malavasi
To cite this version:
H. Tanimura, N. Aghanim, A. Kolodzig, M. Douspis, N. Malavasi. First detection of stacked X-ray
emission from cosmic web filaments. Astronomy and Astrophysics - A&A, EDP Sciences, 2020, 643,
pp.L2. �10.1051/0004-6361/202038521�. �hal-02993736�
https://doi.org/10.1051/0004-6361/202038521 c H. Tanimura et al. 2020
Astronomy
&
Astrophysics
L
ETTER TO THEE
DITORFirst detection of stacked X-ray emission from cosmic web
filaments
H. Tanimura, N. Aghanim, A. Kolodzig, M. Douspis, and N. Malavasi
Université Paris-Saclay, CNRS, Institut d’Astrophysique Spatiale, Bâtiment 121, 91405 Orsay, France e-mail: [email protected]
Received 28 May 2020/ Accepted 1 September 2020
ABSTRACT
We report the first statistical detection of X-ray emission from cosmic web filaments in ROSAT data. We selected 15 165 filaments at 0.2 < z < 0.6 ranging from 30 Mpc to 100 Mpc in length, identified in the Sloan Digital Sky Survey survey. We stacked the X-ray count-rate maps from ROSAT around the filaments, excluding resolved galaxy groups and clusters above the mass of ∼3 × 10¹³M
as well as the detected X-ray point sources from the ROSAT, Chandra, and XMM-Newton observations. The stacked signal results in the detection of the X-ray emission from the cosmic filaments at a significance of 4.2σ in the energy band of 0.56−1.21 keV. The signal is interpreted, assuming the Astrophysical Plasma Emission Code model, as an emission from the hot gas in the filament-core regions with an average gas temperature of 0.9+1.0−0.6keV and a gas overdensity of δ ∼ 30 at the center of the filaments. Furthermore, we show that stacking the SRG/eROSITA data for ∼2000 filaments only would lead to a &5σ detection of their X-ray signal, even with an average gas temperature as low as ∼0.3 keV.
Key words. cosmology: observations – large-scale structure of Universe – diffuse radiation – X-rays: diffuse background
1. Introduction
The cosmic structure is organized in a complex web-like pat-tern called cosmic web (Bond et al. 1996) made of nodes, filaments, sheets, and voids (i.e., Aragón-Calvo et al. 2010;
Cautun et al. 2013). Numerical simulations predict that the majority of baryons are found in filaments in the form of hot plasma (Cen & Ostriker 1999, 2006; Aragón-Calvo et al. 2010; Cautun et al. 2014; Martizzi et al. 2019): a temperature range of 105−107K and densities of ∼10−100 times the
aver-age cosmic value, called the warm hot intergalactic medium (WHIM). Extensive searches for the WHIM were performed in far-ultraviolet, X-ray, and thermal Sunyaev-Zel’dovich (tSZ) effect (Zeldovich & Sunyaev 1969;Sunyaev & Zeldovich 1970,
1972). However, the measurement is difficult because the
sig-nal is relatively weak and the morphology of the source is com-plex. Some detections of gas in filaments have been reported with X-ray and tSZ observations. But these have been reported mostly in short and dense filaments, for example, between clus-ter pairs (Fujita et al. 2008;Planck Collaboration Int. VIII 2013;
Bonjean et al. 2018; Dietrich et al. 2005; Werner et al. 2008;
Tittley & Henriksen 2001; Alvarez et al. 2018; Sugawara et al. 2017) or extending beyond the virial radius of galaxy clus-ters (Vikhlinin 2013; Eckert et al. 2015; Connor et al. 2018,
2019). Gas residing in filaments can also be studied through absorption lines in the spectrum of active galactic nuclei (AGN;
Nicastro et al. 2018; Kovács et al. 2019). However this has so far been limited to a few lines of sight where very X-ray bright AGNs are aligned with filaments.
Statistical detections of gas in stacked short filaments, on the order of 10 h−1Mpc, have also been reported with tSZ obser-vations (Tanimura et al. 2019; de Graaff et al. 2019). Longer
cosmic filaments on scales of 30−100 Mpc were studied in
Tanimura et al.(2020, hereafter T20) using the catalog of fila-ments detected in the Sloan Digital Sky Survey (SDSS) survey byMalavasi et al.(2020) and hot gas was detected by stacking tSZ measurements. However, additional probes are necessary to break the degeneracy between the gas density and temperature. In this Letter, we study the filaments with the ROSAT maps, which can be used to break the degeneracy and estimate the gas density and temperature. The Letter is organized as follows: we describe data in Sect.2and methodology in Sect.3, followed by results. In Sect.4, we assess a detectability of X-ray emission from gas in filaments by SRG/eROSITA (extended ROentgen Survey with an Imaging Telescope Array,Predehl et al. 2010). We describe possible systematics in Sect.5and end with discus-sion and concludiscus-sions in Sects.6and7.
Throughout this work, we adopt theΛCDM cosmology from
Planck Collaboration XIII (2016) with Ωm = 0.3075, ΩΛ =
0.6910, and H0 = 67.74 km s−1Mpc−1. The quantity M∆ is
the mass enclosed within a sphere of radius R∆ such that the enclosed density is ∆ times the critical density at redshift z. Uncertainties are given as 1σ confidence level.
2. Data
Following T20, we studied the filaments identified in
Malavasi et al. (2020) using the Discrete Persistent Structure Extractor (DisPerSE) algorithm (Sousbie 2011). This method computes the gradient of a density field and, where the gradient is zero, identifies critical points (maxima, minima, saddles, and bifurcations). The DisPerSE algorithm then defines filaments as field lines of constant gradient that connect maxima
Open Access article,published by EDP Sciences, under the terms of the Creative Commons Attribution License (https://creativecommons.org/licenses/by/4.0),
A&A 643, L2 (2020)
and saddles. The critical points are possible locations of galaxy groups and clusters and, for our purpose of studying filaments, the critical points and galaxy clusters were masked in our analy-sis as in T20. In the present analyanaly-sis, we studied 15 165 filaments out of the 24 544 used in T20, the discarded filaments being cov-ered by the larger mask used in this work (see Sect.3.1).
We used the publicly available ROSAT soft X-ray dif-fuse background (SXRB) maps Snowden et al. (1997) cov-ering almost the entire sky. These maps consist of 72 fits files, containing count rates and errors, derived from the 1990−1991 ROSAT survey observations. Additional data were collected in 1997 to fill in the missing parts (Freyberg & Egger 2010). These X-ray maps in HEALpix format are pro-vided1 in six standard energy bands covering 0.1−2 keV
(R1:0.11−0.284 keV, R2:0.14−0.284 keV, R4:0.44−1.01 keV, R5:0.56−1.21 keV, R6:0.73−1.56 keV, and R7:1.05−2.04 keV). We did not use the R3 band because the band has a significant response on both sides of the carbon absorption edge of the posi-tion sensitive proporposi-tional counter (PSPC) window and is in gen-eral not useful, as seen in Fig. 1 inSnowden et al.(1994).
In this study, we also masked detected X-ray point sources. This includes 135 118 point-like sources in the Second ROSAT All-Sky Survey Point Source Catalog (2RXS)2 (Boller et al.
2016), 317 167 X-ray sources in the Chandra Source Catalog (CSC 2.0)3(Evans et al. 2010), and 775 153 sources in the third
generation catalog of X-ray sources from XMM-Newton obser-vatory (3XMM-DR8)4(Rosen et al. 2016).
3. Data analysis
3.1. Measuring the X-ray profiles of the filaments
We measured X-ray profiles of the 15 165 filaments using the ROSAT maps at the filament positions. To remove the contami-nation from galaxy groups and clusters, the galaxy clusters were masked with a radius of 3 × R500, and critical points (maxima
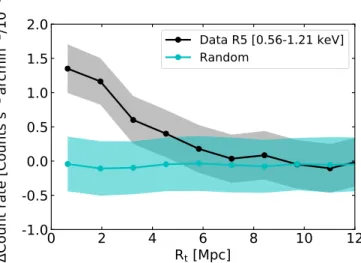
and bifurcation with overdensities larger than 5) were masked with a radius of 10 arcmin, as in T20. Other critical points are underdense regions and not masked. In addition for the present study, which focuses on diffuse X-ray emission, we masked the X-ray point sources with a radius of 2 arcmin (on the order of the resolution of ROSAT PSPC camera and significantly larger than those of Chandra and XMM-Newton). In Sect.5, we investi-gate possible biases due to galaxy groups and clusters as well as X-ray point sources; we find these biases to be minor. After this step, for each filament we extracted the region within 20 Mpc from a filament spine on the X-ray maps and computed a radial profile of the filament. We subtracted from the profile the aver-age value within 10−20 Mpc from the filament spine, considered as a local background signal, which includes the Galactic and extragalactic cosmic X-ray background (CXB) emission. After repeating this step for all the filaments, we obtained a collection of 15 165 “background-subtracted” radial profiles and their aver-age profile is shown in Fig.1(see (i)−(iv) in Sect. 3.1 of T20 for details). We assessed uncertainties by bootstrap resampling (gray in Fig.1) and random sampling (cyan in Fig. 1). For the ran-dom sampling, 15 165 filaments were displaced on the ROSAT maps at random positions in the same way as in T20. The signal-to-noise ratio (S/N) can be estimated by following Eq. (4)
1 http://www.jb.man.ac.uk/research/cosmos/rosat/ 2 http://www.mpe.mpg.de/ROSAT/2RXS 3 http://cxc.cfa.harvard.edu/csc2/ 4 https://www.cosmos.esa.int/web/xmm-newton/xsa# download
0
2
4
6
8
10
12
R
t[Mpc]
-1.0
-0.5
0.0
0.5
1.0
1.5
2.0
Co
un
tr
at
e[
Co
un
ts
s
1ar
cm
in
2/1
0
6]
Data R5 [0.56-1.21 keV]
Random
Fig. 1.Black: average radial X-ray profile of 15 165 filaments in the ROSAT R5 band. The 1σ uncertainties estimated by a bootstrap resam-pling are shown in gray. Cyan: average radial X-ray profile from 1000 random sampling. For each random sampling, 15 165 filaments are dis-placed at random positions on the ROSAT map. The 1σ uncertainties are estimated by computing a standard deviation of the 1000 random sample.
in Sect. 3.3 of T20. The S/Ns at the filament “cores” (within 2 Mpc from the filament spines) result in 0.6σ(R1), 1.2σ(R2), 0.3σ(R4), 4.2σ(R5),1.9σ(R6), and 0.5σ(R7). We evaluated the excess of X-ray signals in two ways: allowing overlaps of dif-ferent filament cores at different redshifts and not allowing the overlaps. The former provides an accumulated X-ray signal in radial directions used to estimate the overall detectability (e.g., in Fig.1). The latter was obtained by masking cores of all the filaments, except the one under consideration, in the redshift range of 0.2 < z < 0.6. This X-ray signal gives a unique X-ray profile for the filaments and we use it for an X-ray spectral analysis to estimate physical properties of gas such as the tem-perature (used in Fig.2). After masking the overlaps of di ffer-ent filamffer-ent cores at different redshifts, the S/Ns are −0.6σ(R1), 0.6σ(R2), 0.8σ(R4), 3.1σ(R5), 1.0σ(R6), and 0.8σ(R7). The negative value of significance means that the data point has a negative value. This could happen because we evaluate the X-ray signal “after subtracting the local background”.
3.2. Gas density and temperature
Using the stacked X-ray count-rate measured at the six energy bands, we performed an X-ray spectral analysis using the Python X-ray spectral analysis package (PyXspec) interface with the X-ray spectral analysis package (XSPEC;Arnaud 1996) to esti-mate the average gas density and temperature at the cores of the 15 165 filaments. The response file, ‘pspcc_gain1_256.rsp’, is provided5. For the model of the X-ray emission, we used the Astrophysical Plasma Emission Code (APEC) model (Smith et al. 2001) with two free parameters: the normalization of surface brightness and temperature. The metallicity of gas was assumed to be 0.2 of the solar value (Anders & Grevesse 1989), based on the measurements in peripheries of intraclus-ter medium (ICM; Mernier et al. 2017,2018) and predictions by hydrodynamic simulations in Martizzi et al. (2019). The
5 https://heasarc.gsfc.nasa.gov/docs/rosat/pspc_
matrices.html
10
810
710
610
510
4 No rm ali ze d co un ts s 1ke V1
Data
Model (APEC)
Random
10
110
0Energy (keV)
2.5
0.0
2.5
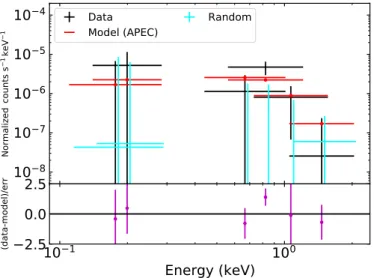
(data-model)/errFig. 2. Top panel: black: excesses of X-ray emission at the cores of 15 165 filaments (<2 Mpc from the filament spines), relative to the back-ground (average X-ray signal at 10−20 Mpc from the filament spines), in the six ROSAT energy bands (R1, R2, R4, R5, R6, and R7). The 1σ uncertainties are estimated by a bootstrap resampling. Cyan: X-ray emission at the cores from 1000 random sampling. The 1σ uncertain-ties are estimated by computing a standard deviation of 1000 random sample. The data points from the random sampling shift slightly to the right on the X-axis for a visualization. Red: X-ray fit to the data with the APEC model (see text for details). Bottom panel: magenta: ratio of data and model at each energy band.
neutral atomic hydrogen (HI) column density in the region of our analysis was estimated to be ∼2 × 1020cm−2from the HI4PI map (HI4PI Collaboration 2016). We used the median redshift of our filaments, z ∼ 0.44, for the fitting. We fit the APEC model to the data obtained by masking the overlaps of different filament cores, with a minimum chi-square method (see Fig.2), and find a surface brightness of (0.06 ± 0.03) × 10−12erg cm−2s−1deg−2at 0.5−2.0 keV with a gas temperature of 0.9+1.0−0.6keV. The reduced χ2value is 0.9. We can calculate the overdensity of the gas in the
filaments for the APEC model, using the filament model in T20 (see Sect. 5.1 in T20). We assumed a cylindrical filament with a density distribution following a β-model with β= 2/3, including the orientation angle of the filaments on the plane of the sky. As in T20, we also assumed a negligible evolution of the overden-sity in filaments in the range of our sample 0.2 < z < 0.6 with a constant electron overdensity, relative to the mean electron den-sity in the Universe. With this model and given the estimated surface brightness, the overdensity of the gas at the center of the filaments was estimated to be 30 ± 15.
Our measurements of gas density and temperature in fila-ments can be compared with those obtained from tSZ in T20, in which filaments in the same lengths (30−100 Mpc) and red-shifts (0.2 < z < 0.6) were used. Our measured gas overdensity at the center of the filaments, δ= 30 ± 15, is consistent with T20, who also found δ = 19.0+27.3−12.1at the center of the filaments with the β model. While our measured gas temperature, 0.9+1.0−0.6keV, is relatively higher than that of T20 (i.e., ∼0.12 ± 0.04 keV), these values are consistent within 1.2σ. Considering that our gas tem-perature is estimated at the cores (<2 Mpc) of the filaments whereas the value in T20 is the average within 5 Mpc, this result may imply that the gas temperature is higher at the cores compared to the outskirts. There was a hint of a radial tem-perature profile in a filament from hydrodynamic simulations byGheller & Vazza(2019). These authors showed that the gas
temperature is constant up to 2 Mpc from the filament core with a temperature of ∼3×10⁶K (∼0.3 keV) and starts to drop beyond
the distance. However, relatively large uncertainties of our tem-perature measurements prevent us from drawing a definitive con-clusion and more sensitive measurements would be needed to confirm it. In the following, we hence evaluate the detectability of the X-ray emission from the gas in the core of filaments we measured with a new X-ray telescope, SRG/eROSITA, also con-sidering a lower temperature gas as shown inGheller & Vazza
(2019) and T20, in the next section.
4. Prospects for filament detection in X-rays
As a successor of ROSAT, the extended ROentgen Survey with an Imaging Telescope Array (SRG/eROSITA;Predehl et al. 2010) will provide a new full-sky X-ray survey thanks to its instrument aboard the Russian Spektrum-Roentgen-Gamma satellite6 (SRG). After completing four years of observations, SRG/eROSITA will have made eight full sky scans, result-ing in a sky-averaged exposure time of ∼2 ks and makresult-ing SRG/eROSITA ∼30 deeper than ROSAT. This will allow for the detection of about three million AGN (Kolodzig et al. 2013) and about 100 000 galaxy clusters (SRG/eROSITA Sci-ence Book: Merloni et al. 2012). In the following, we assess the detectability of X-ray emission from gas in filaments by SRG/eROSITA.
4.1. Simulating X-ray spectrum of SRG/eROSITA
We simulated X-ray energy spectra from gas in all the 15 165 fil-aments as they would be observed by SRG/eROSITA, including their lengths, angles, and redshifts (that determine their surface brightness on the sky and spectral shifts along the energy) via the PyXspec interface with XSPEC. We evaluated the X-ray emis-sion at the cores of the filaments using the same model as in Sect.3.2, with the normalization and temperature from our mea-sured values. We also included masks of galaxy clusters, criti-cal points from DisPerSE and X-ray points sources. We adjusted the mask size of point sources for SRG/eROSITA to 1 arcmin in diameter (Merloni et al. 2012). These masks reduce the effective
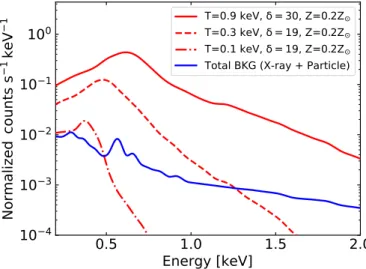
sky areas of the filament cores to ∼1/3. The simulated energy spectra of the 15 165 filaments are stacked as in Fig.B.1and the stacked spectrum is shown as a red solid curve in Fig. 3. The background emission, shown as a blue curve, is simulated based onMerloni et al.(2012).
We also simulated X-ray energy spectra from gas in the fil-aments assuming lower temperatures of 0.3 and 0.1 keV as dis-cussed in Sect.3.2. The normalization of the X-ray emission is calculated based on the filament model in T20, assuming a cylin-drical filament with a density distribution following a β-model with β= 2/3. For the amplitude of the β-model, we used the aver-age core electron overdensity of δ = 19 measured in T20. We also considered inclination angles of the filaments, θ, relative to the plane of the sky, as in T20. This changes the observed ampli-tude of X-ray emission by a factor of 1/cos(θ). The simulated spectra of the 15 165 filaments are stacked as in Fig.B.1and the stacked spectra are shown in Fig.3as red dashed and red dash-dotted curves for the gas temperatures of 0.3 keV and 0.1 keV, respectively.
A&A 643, L2 (2020)
0.5
1.0
1.5
2.0
Energy [keV]
10
410
310
210
110
0No
rm
ali
ze
d
co
un
ts
s
1ke
V
1T=0.9 keV, = 30, Z=0.2Z
T=0.3 keV, = 19, Z=0.2Z
T=0.1 keV, = 19, Z=0.2Z
Total BKG (X-ray + Particle)
Fig. 3.Red: simulated stacked energy spectrum of SRG/eROSITA from
the gas at the cores of the stacked 15 165 filaments. The stacked spec-trum is calculated with overdensity= 30, temperature = 0.9 keV, and metallicity= 0.2 Z and represented as a red solid curve. The stacked
spectrum is also calculated assuming overdensity= 19, tempera-ture= 0.3 keV and metallicity = 0.2 Z and shown as a red dashed curve,
and overdensity= 19, temperature = 0.1 keV and metallicity = 0.2 Z
and shown as a dash-dotted curve. Blue: simulated background energy spectrum of SRG/eROSITA based on the model fromMerloni et al.
(2012).
4.2. Signal-to-noise ratio by stacking filaments
The simulated stacked spectra in Fig.3 allow us to predict the S/Ns of the X-ray emission from the filaments relative to the background, which are summarized in Fig.4. The S/N is evalu-ated in an optimal energy range to maximize the S/N for different temperatures of gas (see Fig.B.1). The results show that we can expect a significant ∼46σ detection for the gas with T = 0.9 keV by stacking the 15 165 filaments. When the gas temperature is lower, the significance drops to ∼10σ for T = 0.3 keV (eval-uated at 0.3−0.8 keV) and to ∼1σ for T = 0.1 keV (evaluated at 0.3−0.5 keV). We also vary the metallicity of gas in filaments considering 0.2 ± 0.1 Z . The result is shown as light red area for
T = 0.9 keV in Fig.4. We find that the effect of the metallicity is small compared to the temperature variations, but not negligible.
5. Systematics
We investigated possible biases on the measurement of the X-ray signals from the filaments in the ROSAT data due to resolved and unresolved galaxy groups and clusters in the foreground and background as in T20. The contribution from resolved galaxy clusters was investigated by varying the radius of the mask. We find that the resolved clusters are well covered by our mask and the contamination to our measurement is minor. In addition, the contamination from unresolved groups and clusters, which is mostly handled by the subtraction of the background signal, was investigated. The potential residual contamination is tested through the random sampling. The result of the random sam-pling is consistent with zero as shown in Fig.1, suggesting that our results are not biased by residual contaminations from unre-solved groups and clusters.
We also considered a bias from unresolved X-ray point sources such as unresolved AGN. We find that the contribu-tion from resolved point sources is minor by comparing the X-ray profiles with and without masking all the point sources
10
110
210
310
4Number of filaments
10
110
010
110
2Signal to noise ratio
T=0.9 keV, =30, Z = 0.2 ± 0.1Z
T=0.3 keV, =19, Z = 0.2Z
T=0.1 keV, =19, Z = 0.2Z
Fig. 4.Signal-to-noise ratios of the X-ray emission from the gas at the cores of filaments, relative to the background, as a function of the number of stacked filaments. Red solid curve: S/N for overdensity = 30, temperature= 0.9 keV and metallicity = 0.2 Z . The S/N is evaluated at
0.5−2.0 keV to maximize it, based on Fig.3. Light red area: uncertain-ties due to the metallicity of (0.2 ± 0.1) Z for overdensity= 30 and
tem-perature= 0.9 keV. Red dashed curve: S/N for overdensity = 19, temper-ature= 0.3 keV and metallicity = 0.2 Z , evaluated at 0.3−0.8 keV. Red
dash-dotted curve: S/N for overdensity = 19, temperature = 0.1 keV and metallicity= 0.2 Z , evaluated at 0.3−0.5 keV. The horizontal black line
indicates a 3σ line.
in AppendixA. This may imply that the contribution from unre-solved point sources is also minor. In our analysis in particu-lar, unresolved point sources at the foreground and background were subtracted by our local background subtraction since they have no positional correlation with filaments; we added these unresolved point sources as noise. However, the contribution of point sources inside filaments could bias our result. Therefore, we tested this by performing the spectral analysis including an additional power-law model assuming that a collection of point sources in filaments has a power-law spectrum. In the test, the spectral index is varied between 1.4 and 1.7. The result of the fitting shows that the contribution of the power-law component is only ∼3 × 10⁻¹⁷erg cm−2s−1deg−2 (0.5−2.0 keV) compared
to ∼6 × 10⁻¹⁴erg cm−2s−1deg−2 (0.5−2.0 keV) of the APEC
component, and we found that the contribution of point sources inside filaments was minor. To complete our analysis of the sys-tematics related to point sources, we tested, using the Akaike’s Information Criterion (AIC) method (Akaike 1973), whether one out of the two models (APEC and power law) can be ruled out statistically. We find that the probability that the APEC model is preferred is 64%. This means that despite a slight preference for the APEC model, both models fit the data almost equally well. In this test, the selection of the model is so far limited by the quality of the data used; more sensitive measurements such as those of SRG/eROSITA would be needed for further assessment.
We also investigated the effect of fitting all stacks with a single median redshift. To check this, we instead performed the model fitting with four APEC models with the redshifts of 0.25, 0.35 0.45, and 0.55 by linking the plasma tempera-tures and normalizations among them. The normalizations were linked with a weight with the relative number of filaments in each redshift bin. Other parameters were fixed. The resulting temperature and surface brightness are ∼0.82 keV and ∼0.05 × 10⁻¹⁴erg cm−2s−1deg−2(0.5−2.0 keV). The values are ∼5% and
∼10% lower for temperature and surface brightness than the val-ues by the fitting with a median redshift, but they are within our measurement uncertainties and not significant.
While we assumed a baseline metallicity of 0.2 Z from the
measurements in peripheries of ICM (Mernier et al. 2017,2018) and predictions by hydrodynamic simulations (Martizzi et al. 2019), the metallicity in cosmic web filaments is not well known. Therefore, we repeated our analysis for 0.1 Z and
0.3 Z . For the former, the average gas temperature in the
fila-ment cores is found to be ∼0.7 keV and the surface brightness ∼0.06 × 10⁻¹²erg cm−2s−1deg−2(0.5−2.0 keV), corresponding
to an average central gas overdensity δ ∼ 38. If the metallicity is 0.3 Z , the gas temperature is ∼ 0.9 keV, the surface brightness is
∼0.06 × 10⁻¹²erg cm−2s−1deg−2(0.5−2.0 keV), and the central
gas overdensity is δ ∼ 27. These values are within the uncertain-ties of our measurement with the baseline metallicity, suggesting that no significant bias is found with the present X-ray data.
6. Discussion
We measure for the first time, with ROSAT maps, the X-ray emission from the cores of large (>30 Mpc) cosmic filaments. Using ROSAT data,Briel & Henry(1995) searched for a X-ray signal from shorter filaments between pairs of galaxy clusters with a tangential distance of ∼20 h−1Mpc on the sky. These
authors accumulated the X-ray photons between the cluster pairs assuming that the filaments between the cluster pairs are almost straight, and they ended up with an upper limit that is two orders of magnitude larger than ours. One reason for the difference between our findings and those ofBriel & Henry(1995) is due to the small number of filaments stacked in that study (∼40), as compared to the stack of ∼15 000 filaments in the present study. As shown in Fig.4, even in the case of SRG/eROSITA data (30 times more sensitive than ROSAT), there should be sta-tistically enough filaments for a significant detection. Another reason may be due to the straight-filament assumption, while those filaments may be mostly curved. This may be supported by the fact that there is no detection of filaments identified by cluster pairs with the tSZ or lensing, when the distance between clusters is larger than ∼15 h−1Mpc, whereas several detections of shorter filaments (∼10 h−1Mpc) have been reported. It
indi-cates the importance of identifying the precise locations of cos-mic web filaments when studying them.
Our result can be compared with predictions of the extra-galactic X-ray emission from hydrodynamic simulations by
Phillips et al. (2001). These authors estimated that the WHIM at z= 0 constitutes about 5−15% of the total CXB at 0.5−2 keV and that the WHIM line emission peaks at 0.5−0.8 keV.
Ursino & Galeazzi(2006) also predicted that the WHIM contri-bution of the total CXB may reach up to 20% in 0.37−0.925 keV, most of which is emitted by filaments at redshifts between 0.1 and 0.6. Our measurements at the ROSAT six energy bands in Fig.2 show an excess in the predicted energy range, which is consistent with the ASCA and ROSAT observations of the CXB inMiyaji et al.(1998).
The analysis of the stacked data in the ROSAT six energy bands indicates that the overdensity of gas is 30 ± 15 at the centers of the filaments assuming a β-model with β= 2/3. To compare to other results mostly drawn for a cylindrical fila-ment with a uniform density distribution, we recalculated the gas overdensity from our measurements assuming a uniform den-sity distribution of gas in cylindrical filaments within the radius of 2 Mpc (the value chosen in the present analysis). We find a value of δ ∼ 8 ± 4. In other measurements, detections of gas
in individual filaments were reported with X-ray and tSZ obser-vations in relatively short (∼10 h−1Mpc) and dense (δ > 150)
filaments. Other statistical studies showed detections of lower-density gas in filaments; most of these detections were still lim-ited to short filaments (∼10 h−1Mpc). The weak-lensing
mea-surements of ∼23 000 filaments with the tangential distance of 6−10 h−1Mpc inEpps & Hudson(2017), the tSZ measurements
of ∼260 000 filaments in Tanimura et al. (2019), and ∼1 mil-lion filaments inde Graaff et al.(2019) with the tangential dis-tance of ∼10 h−1Mpc show that the matter or gas overdensity is δ = 3.2 ∼ 5.5. A study of longer filaments with the length of 30−100 h−1Mpc in T20 also estimated that the gas overdensity
is δ ∼ 6.3, assuming a cylindrical filament with a uniform den-sity distribution of gas in ∼24 000 filaments. Our measured value of gas density from the X-rays is consistent with these statistical studies of filaments.
We also estimate the gas temperature at the cores of the filaments and find 0.9+1.0−0.6keV. Our measurement can be com-pared with other X-ray measurements of individual filaments between cluster pairs or in the outskirts of clusters such as ∼0.3 keV by Suzaku (Hattori et al. 2017), ∼0.4 keV by Chandra and XMM-Newton (Alvarez et al. 2018), and 0.7−2.0 keV by XMM-Newton(Eckert et al. 2015). These measurements are lim-ited to individual, short (∼a few Mpc), and dense (δ > 200) fil-aments. Statistical studies were performed for short filaments (∼10 h−1Mpc) with the tSZ measurements (Tanimura et al. 2019; de Graaff et al. 2019). These studies found gas tem-peratures of ∼0.7 keV and ∼0.3 keV. The study of filaments of 30−100 h−1Mpc length by T20 reported a temperature of ∼0.1 keV. Compared to these statistical studies, our measure-ment of gas temperature shows a relatively higher value. Consid-ering that our gas temperature is estimated at the cores (<2 Mpc) of the filaments, our result may imply that the gas temperature is higher at the cores, compared to the outskirts. On the other hand, the value obtained from the tSZ measurements in the Planck data is averaged over ∼5 Mpc, owing to the limited angular resolu-tion. For a definitive statement on the gas temperature in fila-ments, more sensitive measurements are needed.
7. Conclusions
By stacking ROSAT maps at the positions of ∼15 000 large cos-mic filaments identified with the SDSS galaxies, we detect for the first time their X-ray emission at a significance of 4.2σ in the energy band of 0.56–1.21 keV. The significance in the same band remains significant (3.1σ) even when we mask regions in which filaments at different redshifts overlap on the plane of the sky. While no significant detection is found at other energy bands, this result is predicted by hydrodynamic simula-tion (Phillips et al. 2001;Ursino & Galeazzi 2006), showing that the relative contribution of the WHIM to the total CXB peaks at about 0.4−0.9 keV.
Using the stacked X-ray count rate measured at the ROSAT six energy bands, we perform an X-ray spectral analysis with the APEC model and estimate the average gas density and tem-perature at the cores (<2 Mpc) of the filaments. We find that the average central overdensity is δ= 30 ± 15, assuming a cylindri-cal filament with a density distribution following a β-model with β = 2/3. We compare our measurement of gas density with other statistical measurements with the weak-lensing and the tSZ, and find that they are all consistent. We also estimate the average gas temperature in the filament core region to be 0.9+1.0−0.6keV and find that it is a bit larger than the study of gas in large cos-mic filaments with the tSZ by T20. This may imply that the gas
A&A 643, L2 (2020)
temperature is higher at the cores compared to the outskirts, con-sidering that the gas temperature from X-rays is estimated in a region <2 Mpc from the filament spines whereas the values in the tSZ measurements are the average beyond the distance (∼5 Mpc).
A definitive statement on the gas temperature in filaments from the X-rays necessitates higher quality data such as those from the SRG/eROSITA all-sky survey. As a matter of fact, when we model the emission from cosmic filaments using the gas density and temperature estimated with the ROSAT data, stacked filaments can be detected with very high significance (i.e., ∼4σ for only 100 filaments and up to ∼46σ for a sample of 15 165 filaments as used here). With such high quality data as SRG/eROSITA, we show that we can detect lower-temperature gas of ∼0.3 keV by stacking ∼2000 filaments, which would lead to a&5σ detection.
Acknowledgements. The authors thank an anonymous referee for the useful comments and suggestions. This research has been supported by the fund-ing for the Baryon Picture of the Cosmos (ByoPiC) project from the Euro-pean Research Council (ERC) under the EuroEuro-pean Union’s Horizon 2020 research and innovation programme grant agreement ERC-2015-AdG 695561. The authors acknowledge fruitful discussions with the members of the ByoPiC project (https://byopic.eu/team). This publication has made use of the SZ-Cluster Database (http://szcluster-db.ias.u-psud.fr/sitools/
client-user/SZCLUSTER_DATABASE/project-index.html) operated by
the Integrated Data and Operation Centre (IDOC) at the Institut d’Astrophysique Spatiale (IAS) under contract with CNES and CNRS. Maps are provided in HEALpix (http://healpix.sourceforge.net/) format (Górski et al. 2005).
References
Akaike, H. 1973, Information Theory and an Extension of the Maximum
Likelihood Principle(New York, NY: Springer), 199
Alvarez, G. E., Randall, S. W., Bourdin, H., Jones, C., & Holley-Bockelmann, K. 2018,ApJ, 858, 44
Anders, E., & Grevesse, N. 1989,Geochim. Cosmochim. Acta, 53, 197
Aragón-Calvo, M. A., van de Weygaert, R., & Jones, B. J. T. 2010,MNRAS, 408, 2163
Arnaud, K. A. 1996, in Astronomical Data Analysis Software and Systems V, eds. G. H. Jacoby, & J. Barnes,ASP Conf. Ser., 101, 17
Boller, T., Freyberg, M. J., Trümper, J., et al. 2016,A&A, 588, A103
Bond, J. R., Kofman, L., & Pogosyan, D. 1996,Nature, 380, 603
Bonjean, V., Aghanim, N., Salomé, P., Douspis, M., & Beelen, A. 2018,A&A, 609, A49
Briel, U. G., & Henry, J. P. 1995,A&A, 302, L9
Cautun, M., van de Weygaert, R., & Jones, B. J. T. 2013,MNRAS, 429, 1286
Cautun, M., van de Weygaert, R., Jones, B. J. T., & Frenk, C. S. 2014,MNRAS, 441, 2923
Cen, R., & Ostriker, J. P. 1999,ApJ, 514, 1
Cen, R., & Ostriker, J. P. 2006,ApJ, 650, 560
Connor, T., Kelson, D. D., Mulchaey, J., et al. 2018,ApJ, 867, 25
Connor, T., Zahedy, F. S., Chen, H.-W., et al. 2019,ApJ, 884, L20
de Graaff, A., Cai, Y.-C., Heymans, C., & Peacock, J. A. 2019,A&A, 624, A48
Dietrich, J. P., Schneider, P., Clowe, D., Romano-Díaz, E., & Kerp, J. 2005,
A&A, 440, 453
Eckert, D., Jauzac, M., Shan, H., et al. 2015,Nature, 528, 105
Epps, S. D., & Hudson, M. J. 2017,MNRAS, 468, 2605
Evans, I. N., Primini, F. A., Glotfelty, K. J., et al. 2010,ApJS, 189, 37
Freyberg, M. J., & Egger, R. 1999 inHighlights in X-ray Astronomy, eds. B. Aschenbach, & M. J. Freyberg, 272, 278
Fujita, Y., Tawa, N., Hayashida, K., et al. 2008,PASJ, 60, S343
Gheller, C., & Vazza, F. 2019,MNRAS, 486, 981
Górski, K. M., Hivon, E., Banday, A. J., et al. 2005,ApJ, 622, 759
Hattori, S., Ota, N., Zhang, Y.-Y., Akamatsu, H., & Finoguenov, A. 2017,PASJ, 69, 39
HI4PI Collaboration (Ben Bekhti, N., et al.) 2016,A&A, 594, A116
Kolodzig, A., Gilfanov, M., Sunyaev, R., Sazonov, S., & Brusa, M. 2013,A&A, 558, A89
Kovács, O. E., Bogdán, Á., Smith, R. A. K., Kraft, R. P., & Forman, W. R. 2019,
ApJ, 872, 83
Malavasi, N., Aghanim, N., Douspis, M., Tanimura, H., & Bonjean, V. 2020,
A&A, 642, A19
Martizzi, D., Vogelsberger, M., Artale, M. C., et al. 2019,MNRAS, 486, 3766
Merloni, A., Predehl, P., Becker, W., et al. 2012, ArXiv e-prints [arXiv:1209.3114]
Mernier, F., de Plaa, J., Kaastra, J. S., et al. 2017,A&A, 603, A80
Mernier, F., Biffi, V., Yamaguchi, H., et al. 2018,Space Sci. Rev., 214, 129
Miyaji, T., Ishisaki, Y., Ogasaka, Y., et al. 1998,A&A, 334, L13
Nicastro, F., Kaastra, J., Krongold, Y., et al. 2018,Nature, 558, 406
Phillips, L. A., Ostriker, J. P., & Cen, R. 2001,ApJ, 554, L9
Planck Collaboration XIII. 2016,A&A, 594, A13
Planck Collaboration Int. VIII. 2013,A&A, 550, A134
Predehl, P., Andritschke, R., Böhringer, H., et al. 2010, inSpace Telescopes
and Instrumentation 2010: Ultraviolet to Gamma Ray, SPIE Conf. Ser., 7732,
77320U
Rosen, S. R., Webb, N. A., Watson, M. G., et al. 2016,A&A, 590, A1
Smith, R. K., Brickhouse, N. S., Liedahl, D. A., & Raymond, J. C. 2001,ApJ, 556, L91
Snowden, S. L., McCammon, D., Burrows, D. N., & Mendenhall, J. A. 1994,
ApJ, 424, 714
Snowden, S. L., Egger, R., Freyberg, M. J., et al. 1997,ApJ, 485, 125
Sousbie, T. 2011,MNRAS, 414, 350
Sugawara, Y., Takizawa, M., Itahana, M., et al. 2017,PASJ, 69, 93
Sunyaev, R. A., & Zeldovich, Y. B. 1970,Ap&SS, 7, 3
Sunyaev, R. A., & Zeldovich, Y. B. 1972,Comments Astrophys. Space Phys., 4, 173
Tanimura, H., Hinshaw, G., McCarthy, I. G., et al. 2019,MNRAS, 483, 223
Tanimura, H., Aghanim, N., Bonjean, V., Malavasi, N., & Douspis, M. 2020,
A&A, 637, A41
Tittley, E. R., & Henriksen, M. 2001,ApJ, 563, 673
Ursino, E., & Galeazzi, M. 2006,ApJ, 652, 1085
Vikhlinin, A. 2013,AAS/High Energy Astrophysics Division #13, 401.01 Werner, N., Finoguenov, A., Kaastra, J. S., et al. 2008,A&A, 482, L29
Zeldovich, Y. B., & Sunyaev, R. A. 1969,Ap&SS, 4, 301
Appendix A: Effect of point source
0
2
4
6
8
10
12
R
t[Mpc]
1.0
0.5
0.0
0.5
1.0
1.5
2.0
Co
un
tr
at
e[
Co
un
ts
s
1ar
cm
in
2/1
0
6]
Point sources masked at R5
Point sources not masked at R5
Fig. A.1.Average radial X-ray profiles of 15 165 filaments at R5 band with (black) and without (blue) masking resolved point sources in Sect.2, in addition to the cluster mask (3 × R500+ 10 arcmin). The 1σ
uncertainties of the profiles, when the point sources are masked, are estimated by bootstrap resampling and shown in gray.
Our measurements may be contaminated by signals from unre-solved X-ray point sources. We checked the impact of reunre-solved point sources by comparing the X-ray profiles with and without masking the resolved point sources in Fig.A.1; they are masked in our analysis. The resulting profiles were consistent and this suggests that the impact of the bright resolved point sources is minor.
Appendix B: Stacking of simulated X-ray spectra by SRG/eROSITA
We simulated the X-ray energy spectra of cosmic web fila-ments as they would be observed by SRG/eROSITA, using the APEC model described in Sect.4.1. In the top panel, the spec-tra were calculated with an overdensity of 30, temperature of 0.9 keV, and metallicity 0.2 Z . The stacked spectra (red curves
in Fig.B.1) display the expected signal from the brightest N fil-aments (with N = 10 to 15 165). In the middle panel (bottom panel), the spectra were computed with an overdensity of 19, a temperature of 0.3 (0.1) keV with a metallicity 0.2 Z . The
back-ground emission, shown as a blue curve, was simulated based on
Merloni et al. (2012). For each case, we identified the optimal energy range to maximize the S/N for 15 165 filaments, and we found that it is 0.5–2.0 keV for the gas temperature of 0.9 keV, 0.3–0.8 keV for 0.3 keV, and 0.3–0.5 keV for 0.1 keV, respec-tively; these are shown as a light gray area.
0.5
1.0
1.5
2.0
Energy [keV]
10
410
310
210
110
0No
rm
ali
ze
d
co
un
ts
s
1ke
V
1 15165 filaments (T=0.9 keV, = 30, Z=0.2Z ) 10000 filaments 1000 filaments 100 filaments 10 filamentsTotal BKG (X-ray + Particle)
0.5
1.0
1.5
2.0
Energy [keV]
10
410
310
210
110
0No
rm
ali
ze
d
co
un
ts
s
1ke
V
1 15165 filaments (T=0.3 keV, = 19, Z=0.2Z ) 10000 filaments 1000 filaments 100 filaments 10 filamentsTotal BKG (X-ray + Particle)
0.5
1.0
1.5
2.0
Energy [keV]
10
410
310
210
1No
rm
ali
ze
d
co
un
ts
s
1ke
V
1 15165 filaments (T=0.1 keV, = 19, Z=0.2Z ) 10000 filaments 1000 filaments 100 filaments 10 filamentsTotal BKG (X-ray + Particle)
Fig. B.1.Simulated energy spectra for SRG/eROSITA from the gas at
the cores of filaments. Top panel: the spectra are calculated with an overdensity of 30, a temperature of 0.9 keV, and a metallicity of 0.2 Z .
The stacked spectra (red curves) display the expected signal from the brightest N filaments (with N = 10 to 15 165). Energy spectra are also simulated assuming overdensity of 19, temperature of 0.3 keV and metallicity of 0.2 Z in the middle panel, and overdensity of 19,
tem-perature of 0.1 keV and metallicity of 0.2 Z in the bottom panel. Blue:
simulated background energy spectrum of SRG/eROSITA. The optimal energy ranges to maximize the S/N for 15 165 filaments are shown as a light gray area.