HAL Id: hal-00298930
https://hal.archives-ouvertes.fr/hal-00298930
Submitted on 18 Feb 2008HAL is a multi-disciplinary open access
archive for the deposit and dissemination of sci-entific research documents, whether they are pub-lished or not. The documents may come from teaching and research institutions in France or abroad, or from public or private research centers.
L’archive ouverte pluridisciplinaire HAL, est destinée au dépôt et à la diffusion de documents scientifiques de niveau recherche, publiés ou non, émanant des établissements d’enseignement et de recherche français ou étrangers, des laboratoires publics ou privés.
Measuring perspectives on future flood management on
the Rhine: application and discussion of Q methodology
G. T. Raadgever, E. Mostert, N. C. van de Giesen
To cite this version:
G. T. Raadgever, E. Mostert, N. C. van de Giesen. Measuring perspectives on future flood management on the Rhine: application and discussion of Q methodology. Hydrology and Earth System Sciences Discussions, European Geosciences Union, 2008, 5 (1), pp.437-474. �hal-00298930�
HESSD
5, 437–474, 2008 Measuring flood management perspectives using Q methodology G. T. Raadgever et al. Title Page Abstract Introduction Conclusions References Tables Figures ◭ ◮ ◭ ◮ Back CloseFull Screen / Esc
Printer-friendly Version Interactive Discussion Hydrol. Earth Syst. Sci. Discuss., 5, 437–474, 2008
www.hydrol-earth-syst-sci-discuss.net/5/437/2008/ © Author(s) 2008. This work is distributed under the Creative Commons Attribution 3.0 License.
Hydrology and Earth System Sciences Discussions
Papers published in Hydrology and Earth System Sciences Discussions are under open-access review for the journal Hydrology and Earth System Sciences
Measuring perspectives on future flood
management on the Rhine: application
and discussion of Q methodology
G. T. Raadgever, E. Mostert, and N. C. van de Giesen
Water Resources Management, Delft University of Technology, P.O. Box 5048, 2600 GA Delft, The Netherlands
Received: 17 January 2008 – Accepted: 17 January 2008 – Published: 18 February 2008 Correspondence to: G. T. Raadgever ([email protected])
HESSD
5, 437–474, 2008 Measuring flood management perspectives using Q methodology G. T. Raadgever et al. Title Page Abstract Introduction Conclusions References Tables Figures ◭ ◮ ◭ ◮ Back CloseFull Screen / Esc
Printer-friendly Version Interactive Discussion
Abstract
An overview of stakeholder perspectives promises to be useful in the agenda setting phase of water management policy processes. This paper compares different methods to measure perspectives, and identifies Q methodology as a structured method that al-lows for unbiased analysis. It is one of the first water management papers about Q 5
methodology, and it presents a detailed discussion of the practical possibilities and limitations of the method, using future flood management in the Rhine basin as a case study. The application shows that there are three different stakeholder perspectives that are shared within groups of respondents: A) “Anticipation and institutions”, B) “Space for flooding” and C) “Knowledge and engineering”. The paper concludes that 10
Q methodology can be used in practice to comprehensively elicit individual perspec-tives, to aggregate them in an objective way, and to identify major knowledge gaps and divergent goals. Because the method requires quite some skills and time from the an-alyst, and the sorting task may be difficult for the respondents, it is most appropriate for in-depth analysis. Additional research is required on how to use stakeholder perspec-15
tives in the development of mutual understanding and consensus in water management policy processes.
1 Introduction
Many water management problems are characterized by insufficient technical knowl-edge and disagreement between stakeholders about the goals to achieve. Finding 20
“the right solutions for the right problems” then requires the exchange of knowledge and opinions, production of new technical knowledge, and negotiation of joint goals. In order to effectively set the agenda for these activities, it is essential to identify the available technical knowledge and (perceived) knowledge gaps, the consensus about management goals, and the conflicting values and interests (cf. Gray, 1989). Because 25
HESSD
5, 437–474, 2008 Measuring flood management perspectives using Q methodology G. T. Raadgever et al. Title Page Abstract Introduction Conclusions References Tables Figures ◭ ◮ ◭ ◮ Back CloseFull Screen / Esc
Printer-friendly Version Interactive Discussion them in the early stages of policy formulation. In addition, an overview of stakeholder
perspectives can facilitate explicit discussion and critical reflection on the rationality behind stated positions, including assumptions and uncertainties. In other words, per-spectives can be used to start an interactive learning process, which may result in better mutual understanding and consensus between stakeholders (Pahl-Wostl and 5
Hare, 2004; Ridder et al., 2005).
This article explains how Q methodology can be used to measure perspectives in water management and gives a detailed assessment of its practical possibilities and limitations. As illustration of the method and input to the assessment, the article elicits and analyzes stakeholder perspectives in a water management case study, in which 10
researchers, policymakers, and other stakeholders from Germany and the Netherlands jointly explore long-term scenarios for flood management for the Rhine. Section 2 dis-cusses different methods for eliciting perspectives and identifies Q methodology as most useful for structured elicitation and analysis. Section 3 describes the method in more detail. Although Q methodology has previously been used in a number of environ-15
mental management studies (e.g. Steelman and Maguire, 1999), only three examples from water management could be found in literature (Focht, 2002; Gabr, 2004; Webler and Tuler, 2006), which do not discuss the practical benefits and limitations in detail. Sections 4, 5, and 6 describe the practical application of Q methodology, present the perspectives that were identified, and analyze them. The article ends with a discussion 20
of the practical possibilities and limitations of Q methodology for measuring individual and shared perspectives in water management.
2 Elicitation methods
A perspective is a cognitive representation of the external reality and the position of the individual in this reality, as seen by the individual. It is similar to the concepts “mental 25
model” (Doyle and Ford, 1998; Kolkman et al., 2005) and “(issue) frame” (Dewulf et al., 2004). A perspective concerns the preferred management options, as well as the,
HESSD
5, 437–474, 2008 Measuring flood management perspectives using Q methodology G. T. Raadgever et al. Title Page Abstract Introduction Conclusions References Tables Figures ◭ ◮ ◭ ◮ Back CloseFull Screen / Esc
Printer-friendly Version Interactive Discussion often implicit, line of argument underlying this preference, which consists of general
values, specific interests, and technical, political and process knowledge.
A number of methods can be used for identifying individual perspectives. In knowledge engineering, these have traditionally been used to elicit expert knowledge, but they can also be used for obtaining local and experiential knowledge (cf. Evans, 5
1988), values and interests. Interviewing, questionnaires, cognitive mapping, card sort-ing, and protocol analysis are shortly discussed below, to enable an evaluation of the relative benefits of Q methodology. Although the presented methods cover a large part of the available elicitation approaches, there are many combinations of these methods and many other methods in use (e.g. see Rugg and McGeorge, 1997 for an overview 10
of various sorting methods).
Interviewing (e.g. Denzin and Lincoln, 2000) is the most common of the knowledge elicitation techniques. Interviewing can take the form of a two-way open dialogue or of questioning. An open dialogue allows to explore issues and to maintain flexibility in the issues discussed. Questionnaires are less flexible, as the questions have to be 15
prepared in advance, but they can – in written form – more easily be spread under a large number of respondents, and the results can be analyzed statistically.
Although not so often used, “contrived” techniques such as cognitive mapping and card sorting can be very effective and efficient for systematic elicitation and analysis (Burton et al., 1990; Evans, 1988), in particular when they are used in combination 20
with interviewing. Cognitive or mental mapping is a method that uses specific interview techniques to elicit how an individual perceives a given situation (Eden, 1988; Rid-der et al., 2005). A cognitive mapping exercise usually results in a conceptual model that represents the relevant factors in the situation and relations between them. In-dividual conceptual models can be used as a basis for group model building (Hare, 25
2003; Vennix, 1996). Card sorting is a technique in which the respondent is asked to sort cards, on which elements of the analyzed system are written, into meaningful categories. This procedure can be repeated with different sorting criteria. The sorting criterion and categories may be chosen by the interviewer, the interviewee or a mixture
HESSD
5, 437–474, 2008 Measuring flood management perspectives using Q methodology G. T. Raadgever et al. Title Page Abstract Introduction Conclusions References Tables Figures ◭ ◮ ◭ ◮ Back CloseFull Screen / Esc
Printer-friendly Version Interactive Discussion of both (Pahl-Wostl and Hare, 2004; Rugg and McGeorge, 1997).
Finally, protocol analysis can be used to elicit procedural knowledge about structures and patterns in cognitive processes. The method includes asking subjects to state out loud what they think when performing a certain cognitive task, and analyzing the verbalizations (Burton et al., 1990; Evans, 1988).
5
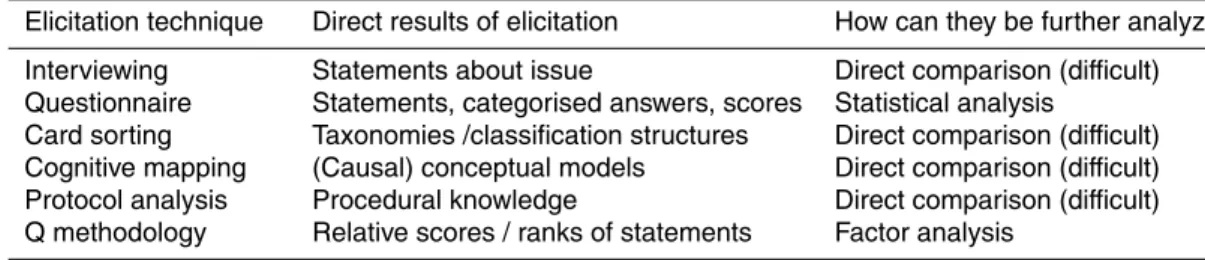
The choice of a method should depend on the goals to be achieved and the subjects concerned. In general, it is recommended to use multiple, complementary methods, for identification and analysis of perspectives. To identify major knowledge gaps and conflicts of interest and to support presentation and discussion of perspectives, it is useful to summarize the main differences and similarities between individual perspec-10
tives. However, as can be seen in Table 1, most elicitation methods do not support this type of analysis well. Questionnaire results can be used for testing whether stake-holder attributes can explain attributes of their perspectives, but only Q methodology supports an objective and reproducible grouping of perspectives.
3 Q methodology
15
Because this article is one of the first water management articles in which Q methodology is applied and evaluated, this section gives an extensive introduction to the method. Q methodology (Brown, 1980; McKeown and Thomas, 1988; Stephenson, 1953) is an appropriate method to systematically elicit individual perspectives and to analyze them using quantitative correlation analysis to obtain shared perspectives. A 20
strength of the method is that it does not require shared perspectives, or groups of subjects that share them, to be known or hypothesized in advance (Donner, 2001). Q methodology can be used to outline areas of consensus and conflict between per-spectives in a structured way (cf. Steelman and Maguire, 1999), and for suggesting strategies for resolution of conflicts (Focht, 2002). Q methodology differs from other 25
survey methods in its aim to measure, correlate and group subjective perspectives across a small, selected sample of individuals. The method does not generate
correla-HESSD
5, 437–474, 2008 Measuring flood management perspectives using Q methodology G. T. Raadgever et al. Title Page Abstract Introduction Conclusions References Tables Figures ◭ ◮ ◭ ◮ Back CloseFull Screen / Esc
Printer-friendly Version Interactive Discussion tions between objective attributes that are abstracted from individual subjects and can
be generalized to a larger population (Steelman and Maguire, 1999), such as the rela-tion between gender, age and child wish. The five basic steps in a Q methodological study (cf. Donner, 2001; van Exel and de Graaf, 2005) are described below.
3.1 Collection of all possible statements about the issue at hand (the “concourse”) 5
The concourse of statements can be collected by means of, for example, interview-ing or studyinterview-ing policy documents, newspapers or scientific literature. The concourse should be broad and contain elements of the perspectives of all stakeholders. The statements should stay close to their original wording.
3.2 Selection of most relevant statements (the “Q set”) 10
The selection of the most relevant statements from the concourse is a crucial activity in Q methodology. It can be done according to a fixed structure, either imposed on, or emerging from, the concourse, or in a more intuitive way. The number of statements in the Q set usually varies between 40 and 60, depending on the complexity of the issue at stake and on the time the respondents may be willing to spend. The Q set 15
should be broad and clear enough to activate the tacit criteria or underlying values of all respondents and to give the researcher insight in them (Donner, 2001). No matter what effort is undertaken, obtaining a balanced set remains ‘more an art than a science’ (Brown, 1980). Finally, the statements should be edited, randomly numbered, and either printed on separate cards – for face to face Q sorting interviews – or included in 20
an online Q sorting tool.
3.3 Selection of respondents (the “P set”)
The P set should be a structured sample of relevant stakeholders who may be ex-pected to have clear and distinct viewpoints. The P set should maximize the likelihood
HESSD
5, 437–474, 2008 Measuring flood management perspectives using Q methodology G. T. Raadgever et al. Title Page Abstract Introduction Conclusions References Tables Figures ◭ ◮ ◭ ◮ Back CloseFull Screen / Esc
Printer-friendly Version Interactive Discussion that all major perspectives on the issue are included (Brown, 1980). The number of
respondents is usually between 20 and 40.
3.4 Ranking of statements by respondents (Q sorting)
After completion of the P set, the Q sorting can start. Respondents are instructed to rank the statements according to some rule or question, for example according to how 5
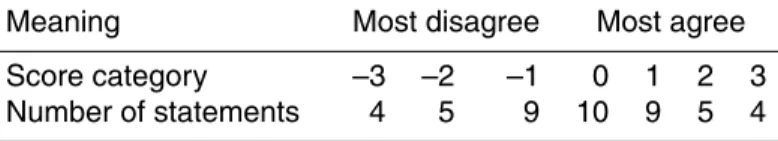
much they agree with them. The statements have to be ranked into score categories representing a gliding scale, for example from strong agreement to strong disagree-ment. The number of statements that has to be assigned to each category is usually fixed, reflecting the shape of a quasi-normal distribution (see Table 2). During the rank-ing process, the respondents have to carefully compare the statements relatively to 10
each other. This is assumed to decrease the risk of arbitrary or biased sorting, for ex-ample under influence of the respondent’s mood at the time of sorting, and to increase the repeatability of the sort. It is recommended to follow up the Q sorting with an in-terview in which the respondents can explain why they assigned certain statements to the most extreme categories. This supports the interpretation of factors in the last step 15
of Q methodology.
3.5 Analysis and interpretation
Software tools, such as the PQMethod software (freely available from http://www.
qmethod.org), can support analysis of obtained Q sorts (individual scoring patterns) using factor analysis. Factor analysis is a statistical data reduction technique used to 20
explain as much of the variability among the observed Q sorts as possible in terms of a few unobserved scoring patterns called factors. “Factor” is thus the more technical term for “shared perspective” and both terms are used interchangeably in the remain-der of this paper. PQMethod calculates the eight factors with the highest explanatory value and presents the ratio of the total variance between the Q sorts that each factor 25
HESSD
5, 437–474, 2008 Measuring flood management perspectives using Q methodology G. T. Raadgever et al. Title Page Abstract Introduction Conclusions References Tables Figures ◭ ◮ ◭ ◮ Back CloseFull Screen / Esc
Printer-friendly Version Interactive Discussion in the analysis. Each factor should at least explain more of the total variance than a
single Q sort (Donner, 2001). Other criteria for the choice of the number of factors are the number of Q sorts determining each factor, and the number and internal logic of the distinguishing statements in each factor. These can be determined only after further analysis, which consequently has to be repeated several times for different numbers of 5
factors.
After choosing the number of factors, PQMethod can clarify the structure of the fac-tors by objectively maximizing variance between each of them using Varimax rotation. Subjective, manual factor rotation could be used when the analyst aims to confirm a certain prior idea or theory (van Exel and de Graaf, 2005). After factor rotation, 10
PQMethod calculates the correlation between individual Q sorts and factors, the factor loadings. Based on this information, the analyst has to choose which subgroups of Q sorts will ultimately define each factor. Q sorts are chosen as defining variables when they have statistically significant and clean loading on that factor. The absolute value of factor loading, and difference with loadings on other factors, should be above certain 15
statistical thresholds. Then, ultimate factor scores are calculated, as an average of the determining Q sorts weighted by their factor loadings. PQMethod produces several outputs that are useful for further analysis. Essential are contention statements, for which scores significantly differ between the factors, and consensus statements, for which scores do not differ significantly. The logic of each factor should be interpreted 20
by the analyst and each factor should be named. Finally, and maybe most importantly, the results have to be disseminated and processed in a proper way.
4 Application in flood management case study
As part of the research projects ACER (http://ivm5.ivm.vu.nl/adaptation/project/acer) and NeWater (http://www.newater.info), a scenario study is carried out concerning 25
transboundary flood management in the German and Dutch parts of the Rhine basin (See Appendix A). A central stakeholder group in the study is the Dutch-German
Work-HESSD
5, 437–474, 2008 Measuring flood management perspectives using Q methodology G. T. Raadgever et al. Title Page Abstract Introduction Conclusions References Tables Figures ◭ ◮ ◭ ◮ Back CloseFull Screen / Esc
Printer-friendly Version Interactive Discussion ing Group on Flood Management (AG). Aims of the scenario study are to support
ex-change of perspectives and expert knowledge and to develop a shared vision on flood management until 2050. Stakeholder workshops are organized to identify relevant au-tonomous developments, desired future situations, and possible management strate-gies. Moreover, outcomes of different strategies under different external scenarios will 5
be assessed, using atmospheric, hydrological and hydrodynamic modeling.
In preparation of the first workshop in September 2006, a literature study, 23 ex-ploratory, semi-structured interviews, and a Q sorting questionnaire were conducted. The interviews provided a rich concourse of statements on future flood management. For the Q set we selected 46 statements, on which opinions seemed to diverge, con-10
cerning four issues: current or general situation, autonomous developments, manage-ment strategies, and desired situation in 2050. The statemanage-ments were translated into German and Dutch and included in an online tool, which was set up using free web-based software (available at:http://q.sortserve.com).
Different groups of respondents were invited by email to fill in the Q sorting question-15
naire at different moments in time. In each case, the respondents were instructed to sort the statements according to how much they agreed with them, using the scoring categories and number of statements as displayed in Table 2. Members of the AG were asked to perform a Q sort in September 2006. Between September 2006 and February 2007, other stakeholders that had been interviewed, German and Dutch wa-20
ter management scientists, members of the Union of Dutch River Municipalities (VNR), and members of the German Hochwassernotgemeinschaft Rhein (local governments, citizens and businesses) were invited to fill in the questionnaire. Introductory ques-tions about the background of the respondent were added, as well as the concluding request to explain why statements were sorted in a certain way. In April 2007, a num-25
ber of participants of the second stakeholder workshop, including stakeholders from upstream Bundesl ¨ander, filled in the questionnaire. In September and October 2007, the last set of Q sorts was performed by members of the expert working group on flood management of the International Commission for the Protection of the Rhine (ICPR).
HESSD
5, 437–474, 2008 Measuring flood management perspectives using Q methodology G. T. Raadgever et al. Title Page Abstract Introduction Conclusions References Tables Figures ◭ ◮ ◭ ◮ Back CloseFull Screen / Esc
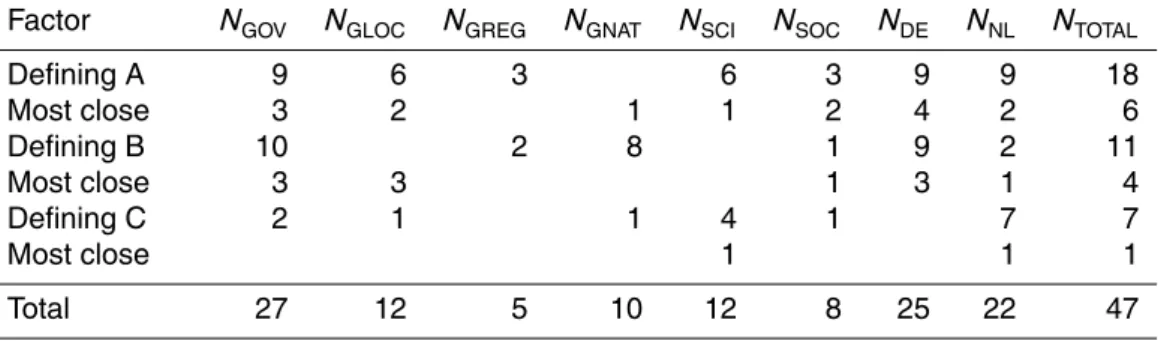
Printer-friendly Version Interactive Discussion In total, 47 people responded to the Q sorting questionnaire, with a good balance
between Dutchmen and Germans (See Table 3). More than half of the respondents work for governmental organizations – at local, regional, or national level – and about one fourth for universities. NGOs, citizens, businesses and German scientists were relatively underrepresented.
5
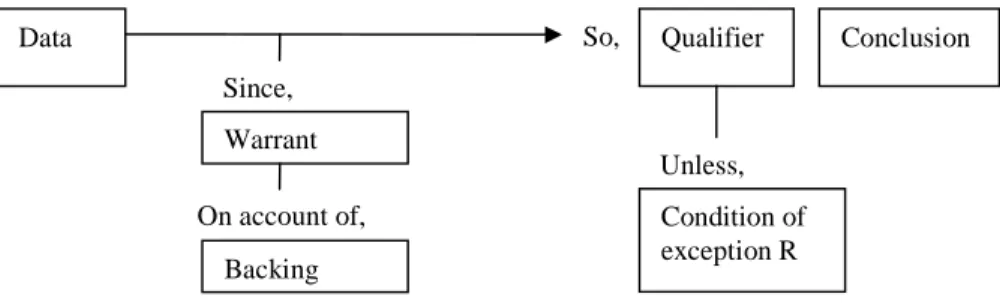
After obtaining Q sorts and identifying factors shared by subgroups of the P set, the factors were analyzed using argumentation theory. According to this theory (Toulmin, 1958), a good argument consists of a claim or conclusion, data supporting this claim, and a warrant linking the data with the claim. Claims should be accompanied by a qualifier, such as “probably” or “certainly”, and conditions of exception. A warrant can 10
be supported by a backing, which can be an argument in itself (See Fig. 1). We applied this structure at a macro level, to represent policy perspectives. At the policy level, the claim concerns the measures to employ, and the warrants and backings concern the effectiveness and efficiency of measures, the perceived problems and goals, as well as the underlying political or ideological values (cf. Fischer, 1995; Hoppe and Peterse, 15
1998). Micro level argumentative structures may be useful to ground claims that are made within the elements of the macro level argument structure.
5 Results
The results reflect a basis of agreement and allowed to identify three distinct shared perspectives, which are determined by in total 36 respondents and explain 43 percent 20
of the total variance between the individual sorts. Table 3 gives an indication of dif-ferences between the groups of people that determine each factor. Appendix B gives an overview of all statements and factor scores, starting with the statement on which there is most consensus and ending with the most contentious statement. Consensus means here that one factor score, which is the weighted average statement score of 25
the respondents that determine the factor, is (almost) equal to the other factor scores. It does not mean that all individual respondents agree. This section first describes the
HESSD
5, 437–474, 2008 Measuring flood management perspectives using Q methodology G. T. Raadgever et al. Title Page Abstract Introduction Conclusions References Tables Figures ◭ ◮ ◭ ◮ Back CloseFull Screen / Esc
Printer-friendly Version Interactive Discussion basis of agreement between the shared perspectives by summarizing the consensus
statements. Next, it presents the factors: A) “Anticipation and institutions”, B) “Space for flooding” and C) “Knowledge and engineering”. For each factor, the argumentation structure has been reconstructed, using the highest and lowest scoring statements (−3, −2, +2 or +3) for that factor and the statements that most clearly distinguish it 5
most from other factors. For the analysis, statements related to preferred strategies have been treated as claims, and statements concerning the effectiveness and effi-ciency of measures, the current situation and autonomous developments as grounds (Figs. 2–4).
5.1 Agreement between perspectives 10
Five statements do not significantly distinguish between any pair of shared perspec-tives (See Table 4). The shared perspecperspec-tives agree on the point that it is not really important to pay more attention to smaller floods and local issues. Furthermore, there is agreement between the factors that flood management should not become more decentralized and controlled by local government, but that it is useful to involve NGOs 15
and the public more actively. Concerning flood management strategies, the opinion is shared that creating space between the river dikes is not a sufficient strategy un-til 2050. In addition, socio-economic developments in flood prone areas should be mitigated through spatial planning and construction regulation. Although not statisti-cally significant, the factors agree that it would not be acceptable when in 2050 current 20
high safety levels could not be guaranteed anymore, and that awareness of and pre-paredness for floods is more important than a feeling of safety among citizens and businesses. In line with this, the factors agree that it is important to develop better disaster management plans.
HESSD
5, 437–474, 2008 Measuring flood management perspectives using Q methodology G. T. Raadgever et al. Title Page Abstract Introduction Conclusions References Tables Figures ◭ ◮ ◭ ◮ Back CloseFull Screen / Esc
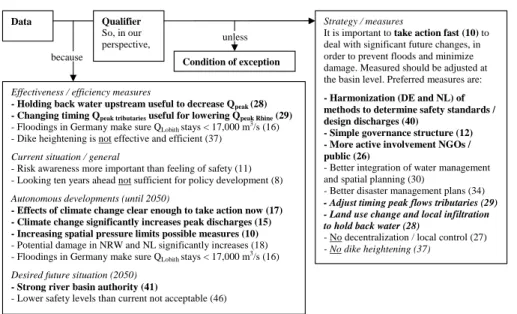
Printer-friendly Version Interactive Discussion 5.2 Perspective A “Anticipation and institutions”
A large group of respondents from different backgrounds, but with relatively many from local governments (See Table 3), think along the line of the argument that we named “Anticipation and institutions” (See Fig. 2). This group expects many signifi-cant autonomous developments that will increase both the probability and the potential 5
damage of floods and that will limit the options for future measures. Although climate change will significantly increase peak discharges, floods in Germany will prevent dis-charges of more than 17 000 m3/s at the German Dutch border (Lobith). The potential damage in flood-prone areas will increase significantly and increasing spatial pres-sure will lead to a decreasing range of possible meapres-sures. All in all, it is important to 10
act quickly, and to cooperate at river basin level. Appropriate physical measures are holding back water in the basin through land use changes and local infiltration, and ad-justing timing of peak flows from main tributaries. Dike heightening is not considered effective and efficient. Most proposed measures are, however, of institutional character. They include transboundary harmonization of methods to determine safety standards, 15
creating a simple governance structure and a strong river basin authority, and better integration of water and spatial planning.
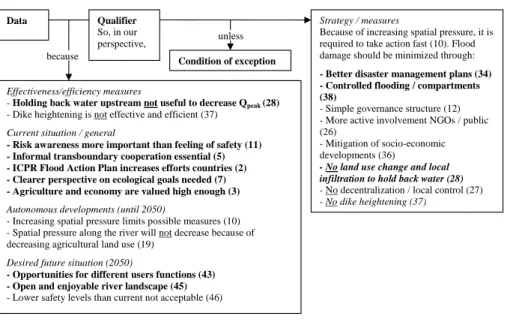
5.3 Perspective B “Space for flooding”
Perspective B, which we named “Space for flooding”, is determined mostly by high-level (national) German governmental actors (See Fig. 3). As in perspective A, the 20
message is that action needs to be taken fast, because spatial pressure along the river is increasing. Furthermore, factor B focuses on the current situation. The factor consid-ers the ICPR Flood Action plan useful to increase the effort that riparian countries put into flood management, and it considers informal cooperation essential for transbound-ary flood management. Concerning other user functions, perspective B indicates that 25
agriculture and economy are already valued high enough and that a clearer perspec-tive on ecological goals is needed. Whether this means that ecology should receive
HESSD
5, 437–474, 2008 Measuring flood management perspectives using Q methodology G. T. Raadgever et al. Title Page Abstract Introduction Conclusions References Tables Figures ◭ ◮ ◭ ◮ Back CloseFull Screen / Esc
Printer-friendly Version Interactive Discussion more or less attention is not clear. In the vision for 2050, the Rhine offers opportunities
for a broad range of user functions and the river landscape is open and enjoyable to live and recreate in. The strategies concentrate on minimizing potential damage by controlled flooding and compartmentalization, and by mitigating socio-economic devel-opments through land use planning and construction regulation. As perspective A, this 5
perspective is in favor of a simple governance structure and considers dike heightening not to be effective and efficient. It expresses, however, that holding back water in the basin is not useful for decreasing peak discharges in the Rhine.
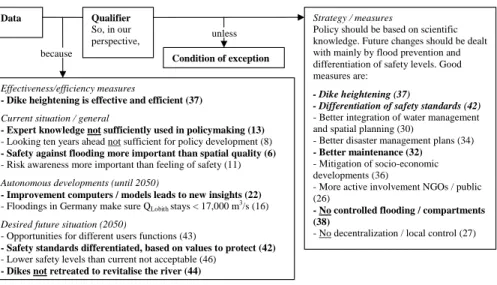
5.4 Perspective C “Knowledge and engineering”
Perspective C (Fig. 4), which we named “Knowledge and engineering”, is fully de-10
termined by seven Dutch respondents, of which most are scientist. This perspective claims that expert knowledge should play a larger role in policymaking, and that a long-term perspective should be developed, aimed at establishing safety against flooding more than at improving spatial quality. Factor C expects an improvement of computer technology, simulation models and insight in the behavior of the river system between 15
now and 2050. Furthermore, it expects that the discharge at Lobith will remain lower than 17 000 m3/s, because of flooding in Germany. In the desired future situation, the Rhine offers opportunities for a broad range of user functions. It is not desired to retreat dikes and revitalize the river. The proposed strategies are focused at flood prevention by engineering. Dike heightening is considered an effective and efficient measure, 20
in combination with better maintenance of existing rivers, floodplains and dikes. In addition, damage in case of flooding should be reduced by differentiation of safety standards, mitigation of socio-economic developments, and integration of water man-agement and spatial planning. This factor argues against development of emergency flood detention areas to control flooding.
HESSD
5, 437–474, 2008 Measuring flood management perspectives using Q methodology G. T. Raadgever et al. Title Page Abstract Introduction Conclusions References Tables Figures ◭ ◮ ◭ ◮ Back CloseFull Screen / Esc
Printer-friendly Version Interactive Discussion
6 Analysis
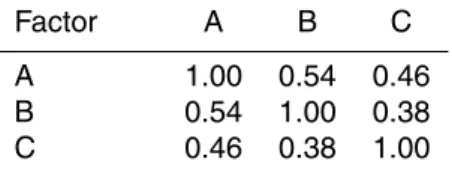
The correlation scores in Table 5 give some insight in the controversy between the shared perspectives. The fact that all pairs of factors are positively correlated, with correlation coefficients above 0.38, indicates that there are no large controversies in the respondent group. The lowest correlation that could be found between an individ-5
ual and a shared perspective was circa −0.2, which also indicates little controversy. The highest correlation can be found between factor A and B, which is no surprise be-cause both emphasize the need for fast action and advocate many similar measures. A difference between the perspectives is that A emphasizes influence of autonomous developments, including climate change, whereas B focuses more on the current sit-10
uation. Perspective C has a relatively low correlation with other factors, because it focuses on other developments (knowledge) and not on the need to act quickly, and proposes a strategy that other factors oppose (dike heightening). It follows that at least two key issues need to be discussed in order to develop more consensus: the need for fast and pro-active actions and the extent to which different types of measures will be 15
used.
Predominantly technical points on which the shared perspectives do not agree, in-clude effects of climate change on peak discharges, influence of new technology and insights on water management, and development of spatial pressure along the river. Furthermore, the perspectives do not agree on the efficiency and effectiveness of the 20
following measures: dike heightening, holding back water in the basin, and adjusting timing of peak flows from tributaries.
Q statements and argumentative structures in Figs. 2–4 represent claims and war-rants, but no backings and data to support them and no qualifiers and conditions of exception. In reality, many of the claims and warrants can be related to previously 25
performed research. An example of an influential report was the research into the transboundary effects of extreme floods on the Niederrhein (Lammersen, 2004), indi-cating that due to flooding in Germany the peak discharge at Lobith can currently not
HESSD
5, 437–474, 2008 Measuring flood management perspectives using Q methodology G. T. Raadgever et al. Title Page Abstract Introduction Conclusions References Tables Figures ◭ ◮ ◭ ◮ Back CloseFull Screen / Esc
Printer-friendly Version Interactive Discussion exceed 15 500 m3/s and is not expected to exceed 16 500 m3/s under future climate
change.
Divergent goals are the result of different general values, worldviews or political and ideological rationality, and specific, local interests, which are reflected in stakeholder perspectives (cf. Fischer, 1995; Sabatier, 1998). We were not able to identify specific 5
interests, as the Q sorting questionnaire concerned the long-term future at basin scale and was filled in by only few NGOs and residents. General values were elicited indi-rectly. Asking directly for values may result in not very reliable, artificial answers, as values are implicit rather than explicit and enacted rather than applied. Nonetheless, after interpretation, the shared perspectives could be explained in terms of underlying 10
values. In all perspectives, safety seems to be a central value that should be protected now and in the future. Dominance of safety may be caused by dominance of technical flood management experts in the P set. Furthermore, all factors aim for more active involvement of NGOs and the public. However, it is unclear whether public participation is seen as a means for empowerment and direct democracy, or as a means to educate 15
the public and obtain support for management, which would be compatible with a gov-ernment and science centered worldview (cf. Mostert, 2005; Webler and Tuler, 2006). In addition to shared goals, the factors have divergent goals:
– Besides safety, the main values underlying perspective A seem to be that a strong
anticipation of future change is necessary, and that countries sharing a basin 20
should take collective actions.
– In perspective B, minimizing current government investments seems to be a
cen-tral value. The factor anticipates only changes in spatial pressure, and proposes to assign emergency flood detention areas to ensure safety, which requires little government investments.
25
– Perspective C positively values a long-term economic approach. It argues to invest in well-known, cost-efficient engineering measures and it relies on
HESSD
5, 437–474, 2008 Measuring flood management perspectives using Q methodology G. T. Raadgever et al. Title Page Abstract Introduction Conclusions References Tables Figures ◭ ◮ ◭ ◮ Back CloseFull Screen / Esc
Printer-friendly Version Interactive Discussion development of knowledge and technology. Furthermore, factor C suggests
spa-tial differentiation of safety standards based on values to protect, which may im-prove efficiency of flood protection.
7 Practical possibilities and limitations of Q methodology
In this section, we discuss assumptions and interpretations made during the application 5
of Q methodology, the quality of resulting individual perspectives, representativeness of shared perspectives, efficiency of the application, and possibilities for further analysis. 7.1 Objectivity of Q methodology
Among the promises of Q methodology are that it can be used to explicitly identify indi-vidual perspectives and to objectively identify shared perspectives, using quantitative 10
techniques. This proved to be correct. From the application it occurred, however, that the analyst has to make some choices as well. Results depend directly on the analyst’s selection of statements, including formulation and translation, to include in the Q set, and stakeholders to include in the P set. Ideally, all important stakeholder groups and all different perspectives should be reflected in the P and Q sets, but there are practical 15
limitations as to their size. Inadvertently, important stakeholders and perspectives may be missed, and, moreover, who decides on what is “important”? Here, the general political and ideological values of the researcher may exert some influence. The same is true for the researcher’s choice of the number of factors to use, the names given to the factors, and the reconstruction of the argumentation structures. In the case study, 20
more than three statistically significant factors could be identified, but the three pre-sented factors gave a meaningful summary of the variety of perspectives. The analysis of five or more factors resulted in a set in which some of the factors did not contain sufficiently distinguishing statements to be meaningful. In the analysis of four factors, two of them appeared to be too similar to make a clear distinction.
HESSD
5, 437–474, 2008 Measuring flood management perspectives using Q methodology G. T. Raadgever et al. Title Page Abstract Introduction Conclusions References Tables Figures ◭ ◮ ◭ ◮ Back CloseFull Screen / Esc
Printer-friendly Version Interactive Discussion 7.2 Validity of individual perspectives
The validity of elicited perspectives depends on the willingness of respondents to re-flect openly on their perspectives. The validity cannot be directly tested, but in order to get some feeling for it, individual perspectives obtained using different methods can be compared. Besides interviews and Q methodology, a cognitive mapping exercise was 5
performed in the case study. In preparation of the first workshop, interview results of the workshop participants were translated in individual cognitive maps and during the workshop participants elaborated the perspectives captured in the cognitive maps. In sum, eight respondents to the Q sort were also interviewed and four of them partici-pated in the cognitive mapping exercise. For each individual we assessed how many 10
of the statements that received the scores −3, −2, +2 or +3 in the Q sort were also reflected in the interview and cognitive map. On average, 30% of these statements were reflected in the interviews and 40% in the cognitive maps and about 50% were not reflected in either of them. Thus, Q sorting identifies much more aspects as rele-vant than the aspects respondents come up with themselves. This points to the fact 15
that Q methodology is not only an elicitation technique, but it forces respondents to reflect on a broad range of aspects. The remaining 10–20% of the most relevant Q sort statements seemed to be contradicted in the interviews and cognitive maps. Pos-sible explanations for this are that individual perspectives changed between different elicitation moments or that the analyst interpreted statements in a different way than 20
the interviewee. In addition, the interviews and cognitive maps included some claims, and in particular some detailed explanations, that were not evident in the Q sorts. 7.3 Representativeness of shared perspectives
Representativeness of the set of shared perspectives is determined by the variety of measured individual perspectives, and the way in which these perspectives are ag-25
gregated. It benefits from including a similar number of stakeholders from all relevant stakeholder groups in the P set. In the case study, the P set was, for practical
rea-HESSD
5, 437–474, 2008 Measuring flood management perspectives using Q methodology G. T. Raadgever et al. Title Page Abstract Introduction Conclusions References Tables Figures ◭ ◮ ◭ ◮ Back CloseFull Screen / Esc
Printer-friendly Version Interactive Discussion sons, limited to only a few groups of stakeholders, mainly governments and scientists
on both sides of the border and few citizens, businesses and NGOs. Due to limited re-sponse, some groups, such as German scientists, were underrepresented. The groups do not form statistically significant population samples, which is also not the aim of Q methodology.
5
By aggregating a large number of individual perspectives in a small number of shared perspectives, communication, comprehension, and comparison become easier. How-ever, some of the individual nuances, and richness of the overview, get lost. For ex-ample, in the case study, the three perspectives explain only 43% of total variance between perspectives. Only 36 of the 47 individual perspectives have a statistically 10
significant and clean factor loading, or correlation with a factor. Of the remaining indi-vidual perspectives, three do not have a significant loading on any of the factors. To restore some of the richness of the overview, these non-significantly loading Q sorts could be analyzed further.
7.4 Efficiency of Q methodology 15
The efficiency of Q methodology can be expressed in time spent by the analyst and respondents. A new Q analyst should do some reading in order to be introduced in the methodology (e.g. Donner, 2001; van Exel and de Graaf, 2005). The method re-quires careful interpretation of sophisticated statistical results (Rugg and McGeorge, 1997). Furthermore, the analyst should spend considerable time preparing a con-20
course through literature study and/or interviews, selecting Q and P sets, administering the Q sorting, and analyzing the results.
For respondents, the time for executing the Q sorting task varies between fifteen minutes and one hour, dependent on the number of statements and the way of sorting. Using an online tool instead of face-to-face Q sorting interviews, allowed respondents 25
to perform the sort in about half an hour, at any convenient time. Furthermore, it significantly reduced the time researchers had to invest. Disadvantages of an online set-up are the potentially lower response rate and limited possibilities to explain
partic-HESSD
5, 437–474, 2008 Measuring flood management perspectives using Q methodology G. T. Raadgever et al. Title Page Abstract Introduction Conclusions References Tables Figures ◭ ◮ ◭ ◮ Back CloseFull Screen / Esc
Printer-friendly Version Interactive Discussion ipants how to perform the task. Moreover, it is more difficult to ask respondents why
they sorted statements in a particular way. However, there is no apparent difference in reliability and validity of computer- and interview-based Q sorts (van Tubergen and Olins, 1979 in van Exel and de Graaf, 2005). Although we used an online tool, some respondents in the case study complained about the time and effort required to itera-5
tively put a fixed number of statements in each score category, and about the fact that their perspective could not be expressed using such a fixed distribution (cf. Rugg and McGeorge, 1997, who see this as a major disadvantage of Q sorting). This could be solved by allowing respondents to distribute statements over categories as they want, without prescribing the shape of the distribution (e.g. Steelman and Maguire, 1999). In 10
that case respondents are, however, not stimulated to evaluate their agreement with one statement relatively to their agreement with another, and accuracy of the elicited perspectives will be less.
The way in which Q sorting is administered should be chosen carefully, as it can influence both quality of results and effectiveness of application. Online surveys are in 15
general more time and cost-efficient, whereas in direct Q sorting interviews participants communicate more directly to the analyst, which makes a valid interpretation of Q sorts less difficult and time-consuming (cf. Steelman and Maguire, 1999).
7.5 Possibilities for further analysis and follow-up activities
In the case study, the Q sorting results were fed back to respondents through a report, 20
and presentations at the second stakeholder workshop. Aspects on which the shared perspectives disagree point to knowledge gaps and divergent goals. Additional re-search is needed to analyze how exactly different perspectives should be fed back into the water resources management policy and research process, in order to develop bet-ter mutual understanding and consensus (e.g. Jasanoff, 1990; Maasen and Weingart, 25
2005). To give some preliminary ideas, follow-up activities may include 1) confronting stakeholders with disagreement between perspectives, 2) discussing underlying data, including uncertainties, qualifiers and conditions of exception, 3) gathering available
HESSD
5, 437–474, 2008 Measuring flood management perspectives using Q methodology G. T. Raadgever et al. Title Page Abstract Introduction Conclusions References Tables Figures ◭ ◮ ◭ ◮ Back CloseFull Screen / Esc
Printer-friendly Version Interactive Discussion knowledge and conducting further research to fill in knowledge gaps, and 4) discussing
differences in values and interests, and negotiating joint goals. It is assumed that these steps need to be executed in parallel and need to be iterated. In the case study, it is fur-thermore planned to conduct another Q sorting questionnaire, after the third workshop, to evaluate whether, and on which aspects, changes in perspectives occurred.
5
8 Conclusions
This article explored the practical possibilities and limitations of Q methodology by mea-suring perspectives in a flood management case study. Q methodology proved to be an effective tool for measuring perspectives, allowing for structured elicitation of individual perspectives, and identification of shared perspectives and groups of respondents that 10
share these perspectives. Q methodology can gain from combining it with other tools. In the case study, interviews played an important role in developing a relevant Q set. Furthermore, analysis gained from the use of argumentation theory for reconstructing argumentation patterns. This resulted in the identification of areas of consensus, as well as three shared perspectives on future flood management: A) “Anticipation and 15
institutions”, B) “Space for flooding”, and C) “Knowledge and engineering”. By ana-lyzing the shared perspectives, major knowledge gaps and divergent goals could be identified.
Practical application shows that, although Q methodology uses a quantitative tech-nique for identifying shared perspectives, the analyst has to make some interpretations 20
as well. Because Q methodology forces respondents to consider a broad set of state-ments, resulting perspectives are more comprehensive than those elicited using other methods. However, Q methodology is a time-intensive method for analysts, and may be difficult and time-consuming for respondents. Therefore, it is most appropriate for in-depth analysis. Additional research is needed to analyze how to use stakeholder 25
perspectives in a learning process among policymakers, researchers and other stake-holders.
HESSD
5, 437–474, 2008 Measuring flood management perspectives using Q methodology G. T. Raadgever et al. Title Page Abstract Introduction Conclusions References Tables Figures ◭ ◮ ◭ ◮ Back CloseFull Screen / Esc
Printer-friendly Version Interactive Discussion
Appendix A
Flood management in the Netherlands and Northrhine-Westphalia
The Rhine is a large river with a basin of almost 200 000 km2 that is shared by nine European countries. Originating in the Swiss Alps, the river runs through Germany and 5
the Netherlands into the North Sea. The Rhine river has a combined rainfall-snowmelt driven flow regime, but peak discharges occur in winter, originating from precipitation in Germany and France (Silva et al., 2004). In 1993 and 1995, floods in the Rhine basin caused significant damage in Germany, and during the 1995 flood 250,000 Dutch people were evacuated for safety’s sake. The highest discharge measured during these 10
floods was 12 600 m3/s at the German-Dutch border. In Northrhine-Westphalia (NRW) and the Netherlands (NL) strong dikes have been constructed to protect the land from flooding. Safety standards vary between a maximum yearly probability of flooding of about 1:200 in the south of NRW to 1:10 000 in the west of NL. At the Dutch-German border the river system should be able to safely discharge 15 000 m3/s.
15
In NL flood protection on the large rivers is the responsibility of the national Min-isterie van Verkeer en Waterstaat. In NRW the Landesministerium f ¨ur Umwelt und Naturschutz, Landwirtschaft und Verbraucherschutz is not responsible for flood pro-tection, but influences it through financing the work done by local Deichpflichtigen. In the German-Dutch Working Group on Flood Management (AG), a broad range of gov-20
ernmental actors from NRW and NL exchange knowledge and conduct joint research. In February 2007 they reflected on 10 years of good cooperation and signed a new work plan for the years 2007–2012. Focus points in this plan include studying the consequences of climate change and spatial and socioeconomic changes (Provincie Gelderland et al., 2007)
25
Two rationales for taking flood management measures are to comply with current safety standards or to account for future changes. Climate change may increase future peak discharges of the Rhine. Social and economic changes may increase potential
HESSD
5, 437–474, 2008 Measuring flood management perspectives using Q methodology G. T. Raadgever et al. Title Page Abstract Introduction Conclusions References Tables Figures ◭ ◮ ◭ ◮ Back CloseFull Screen / Esc
Printer-friendly Version Interactive Discussion damage of flooding and may decrease available space for additional retention areas.
NL and NRW both developed flood management policies that embrace the idea of giv-ing back space to the river, instead of heightengiv-ing dikes. They established a set of flood management measures that should be implemented until 2015 (Landesministerium f ¨ur Umwelt und Naturschutz Landwirtschaft und Verbraucherschutz, 2006; Rijkswater-5
staat, 1998). In NRW, planned measures consist of renovation and relocation of dikes and creating controlled retention areas. In NL, focus lies on excavation of floodplains, establishment of bypasses and local relocation of dikes (cf. Silva et al., 2004). Interna-tional agreements such as the Flood Action Plan of the InternaInterna-tional Commission for the Protection of the Rhine (Internationale Kommission zum Schutz des Rheins, 1998) 10
and the (draft) EU Flood Directive (Dworak and G ¨orlach, 2005; European Commission, 2004) may direct flood management as well, or at least stimulate additional effort.
HESSD
5, 437–474, 2008 Measuring flood management perspectives using Q methodology G. T. Raadgever et al. Title Page Abstract Introduction Conclusions References Tables Figures ◭ ◮ ◭ ◮ Back CloseFull Screen / Esc
Printer-friendly Version Interactive Discussion
References Appendix A
Dworak, T. and G ¨orlach, B.: Flood risk management in Europe – the development of a common EU policy, Int. J. River Basin Management, 3, 97–103, 2005.
5
European Commission: Flood risk management: Flood prevention, protection and mitigation, Brussels, 2004.
Internationale Kommission zum Schutz des Rheins: Aktionsplan Hochwasser, Rotterdam, 10
1998.
Landesministerium f ¨ur Umwelt und Naturschutz Landwirtschaft und Verbraucherschutz: Bericht an den Ausschuss f ¨ur Umwelt und Naturschutz, Landwirstschaft und Verbraucher-schutz des Landes Nordrhein-Westfalen ¨uber das HochwasserVerbraucher-schutzkonzept f ¨ur den Zeitraum 15
bis 2015, 2006.
Provincie Gelderland, Ministerie Verkeer en Waterstaat, and Landesministerium f ¨ur Umwelt und Naturschutz Landwirtschaft und Verbraucherschutz NRW: Gemeinsame Erkl ¨arung f ¨ur die Zusammenarbeit im nachhaltigen Hochwasserschutz f ¨ur den Zeitraum 2007 bis 2012, 2007. 20
Rijkswaterstaat: Flood Defences Act, Policy Creating space for the river, Rijkswaterstaat Directie Weg- en Waterbouw, Delft, 1998.
Silva, W., Dijkman, J. P. M., and Loucks, D. P.: Flood management options for the Netherlands, 25
HESSD
5, 437–474, 2008 Measuring flood management perspectives using Q methodology G. T. Raadgever et al. Title Page Abstract Introduction Conclusions References Tables Figures ◭ ◮ ◭ ◮ Back CloseFull Screen / Esc
Printer-friendly Version Interactive Discussion
Appendix B
Factor Q-sort values for statements sorted by consensus vs. disagreement (variance across normalized factor scores)
Nr. Statements Factor values
A B C
24 Creating space for the river by removal of obstacles, floodplain excavation and dike relocation is a sufficient strategy for flood management until 2050.
–1 –1 –1
36 Socio-economic developments in flood prone areas should not be mitigated through spatial planning and construction regulation.
–1 –3 –2
14 It is important to pay more attention to smaller floods and local issues, instead of extreme floods.
–1 0 –1
27 Flood management should become more decentralised and controlled by local government bodies.
–2 –2 –2
26 It is not useful to involve non-governmental organisations and the public more actively in flood management decision-making.
–3 –2 –2
8 Looking ten years ahead in the development of flood management policies is suf-ficient.
–3 –1 –3
45 In 2050 the river landscape should be open and enjoyable to live and recreate in. 1 2 1 20 There will be large changes in the administrative structure of flood management
until 2050.
0 –1 –1
18 The potential damage in the flood prone areas in Northrhine-Westphalia and the Netherlands will not significantly increase until 2050.
–2 –1 –1
46 It would be acceptable when in 2050 the current high safety levels could not be guaranteed anymore.
–3 –2 –3
15 Climate change will significantly increase peak discharges at the Lower Rhine be-tween now and 2050.
2 1 0
35 Soft measures like offering compensation or options for insurance are good possi-bilities to cover residual potential flood damage.
–1 0 0
31 Downstream countries should search for and finance measures in upstream coun-tries, when this provides more effective or efficient solutions.
HESSD
5, 437–474, 2008 Measuring flood management perspectives using Q methodology G. T. Raadgever et al. Title Page Abstract Introduction Conclusions References Tables Figures ◭ ◮ ◭ ◮ Back CloseFull Screen / Esc
Printer-friendly Version Interactive Discussion
Continued.
12 A simple governance structure, with clear and little overlapping tasks and respon-sibilities, is beneficial for flood management.
3 2 1
30 A better integration of water management and spatial planning is essential to solve future flood management problems.
3 1 2
16 Floodings in Germany will prevent the occurrence of Rhine discharges larger than 17 000 m3/s at Lobith until 2050.
2 1 2
23 The water sector will gain in importance relatively to other sectors (e.g. agriculture, spatial planning) between now and 2050.
1 0 1
25 In the next decades, bypasses (e.g. “green rivers”) have to be realised to safely accommodate increasing peak discharges.
0 0 –1
32 Existing dikes, rivers and floodplains should be better maintained. 0 0 2 2 The ICPR Flood Action Plan is useful because it stimulates countries to put
addi-tional effort in flood management.
0 2 1
1 The priority of flood management on the political agenda is currently too low. 1 –1 1 34 It is important to develop better disaster management plans that thoroughly
con-sider the logistics of potential evacuations.
2 3 2
7 It is necessary to develop a clearer perspective on the desired state of “nature”, e.g. clearer ecological goals.
0 2 0
33 The Rhine countries should develop more controlled retention polders and opti-mise their use for the whole Rhine basin.
1 0 –1
21 The European Union Flood Directive will significantly increase the influence of downstream countries on flood management in upstream countries.
–1 –1 0
4 Current safety standards in the Netherlands and Northrhine-Westphalia are ade-quate.
–1 0 0
10 Because the range of possible flood management measures is decreasing due to increasing spatial pressure, it is important to take action fast.
3 2 1
43 In 2050 the Rhine should still offer plenty of opportunities to a broad range of (user) functions.
1 3 3
3 Agriculture and other economic activities are not valued high enough in current flood management.
HESSD
5, 437–474, 2008 Measuring flood management perspectives using Q methodology G. T. Raadgever et al. Title Page Abstract Introduction Conclusions References Tables Figures ◭ ◮ ◭ ◮ Back CloseFull Screen / Esc
Printer-friendly Version Interactive Discussion
Continued.
11 It is more important that citizens and businesses feel safe than that they are aware of and prepared for possible flooding.
–2 –3 –3
42 In 2050 safety standards should be differentiated, based on the values to be pro-tected in a certain area.
1 0 3
19 Spatial pressure along the river will decrease between now and 2050, as agricul-tural land use decreases.
–1 –3 0
22 Improvement of computer technology and models between now and 2050 will lead to new, valuable insights in the behaviour of the river system.
0 1 3
9 The Dutch five-yearly review of the design discharge guarantees that flood preven-tion stays up to date in an efficient way.
–1 1 –1
39 At locations where technical flood prevention measures are difficult to establish, flooding should be accepted.
–1 1 0
5 Informal cooperation is essential for success in transboundary flood management. 0 3 1 29 Adjusting the timing of peak flows from the main tributaries can hardly contribute
to preventing peak flows on the Lower Rhine.
–2 0 0
40 A harmonised approach to determine design discharges and safety standards in the Netherlands and Germany should be operational in 2050.
3 0 1
13 Scientific and expert knowledge are currently not well enough adopted in policy formulation and decision-making.
0 –1 2
41 In 2050 ideally a strong river basin authority has been established. 2 –1 –1
6 Spatial quality is as important as safety against flooding. 0 1 –2
17 Because the effects of climate change on peak discharges are still unclear and contradictory, it is better to wait than to take action now.
–3 –1 0
38 Residual flood risk should be reduced by controlled flooding (e.g. emergency flood detention areas) and compartmentalisation.
1 3 –2
44 In 2050 the dikes should have been retreated, and the river should be revitalised and meandering.
1 1 –3
28 Holding back the water through land use changes and local infiltration upstream in the Rhine basin is useful to decrease peak discharges on the Niederrhein.
2 –3 1
HESSD
5, 437–474, 2008 Measuring flood management perspectives using Q methodology G. T. Raadgever et al. Title Page Abstract Introduction Conclusions References Tables Figures ◭ ◮ ◭ ◮ Back CloseFull Screen / Esc
Printer-friendly Version Interactive Discussion
Acknowledgements. The authors would like to thank all respondents for their cooperation and
emphasize that this article does not represent any official position, and involves interpretation by the authors. Furthermore the authors are grateful for the help of G. Becker (VU IVM) and others that contributed to setting up the Q sort. The research for this article was executed under the projects NeWater (Contract no 511179, 6th EU framework program) and ACER. The 5
authors would like to thank the European Commission and the Water Resources Centre Delft for the financial support received.
References
Beers, P. J.: Negotiating common ground – tools for multidisciplinary teams, Open Universiteit Nederland, 2005.
10
Brown, S. R.: Political subjectivity: Application of q methodology in political science, Yale Uni-versity Press, New Haven, 1980.
Burton, A. M., Shadbolt, R., Rugg, G., and Hedgecock, A. P.: The efficacy of knowledge elici-tation techniques: A comparison across domains and levels of expertise, Knowl. Acquis., 2, 167–178, 1990.
15
Denzin, N. K. and Lincoln, Y. S.: Handbook of qualitative research, 2nd Ed., Sage, Thousand Oaks, 2000.
Dewulf, A., Craps, M., and Dercon, G.: How issues get framed and reframed when different communities meet: A multi-level analysis of a collaborative soil conservation initiative in the Ecuadorian Andes, J. Community Appl. Soc., 14, 177–192, 2004.
20
Donner, J. C.: Using q-sorts in participatory processes: An introduction to the methodology, Social analysis: Selected tools and techniques, Social Development Papers No. 36, The World Bank, Social Development Department, Washington DC, 2001.
Doyle, J. K. and Ford, D. N.: Mental models concepts for system dynamics research, Syst. Dynam. Rev., 14, 3–29, 1998.
25
Eden, C.: Cognitive mapping: A review, European Journal of Operational Research, 36, 1–13, 1988.
Evans, J. S. T.: The knowledge elicitation problem – a psychological perspective, Behav. Inform. Technol., 7, 111–130, 1988.
Fischer, F.: Evaluating public policy, Nelson-Hall, Chicago, 1995. 30
Focht, W.: Assessment and management of policy conflict in the Illinois River watershed in oklahoma: An application of q methodology, Int. J. Public Admin., 25, 1311–1349, 2002.
HESSD
5, 437–474, 2008 Measuring flood management perspectives using Q methodology G. T. Raadgever et al. Title Page Abstract Introduction Conclusions References Tables Figures ◭ ◮ ◭ ◮ Back CloseFull Screen / Esc
Printer-friendly Version Interactive Discussion Folke, K., Hahn, T., Olsson, P., and Norberg, J.: Adaptive governance of social-ecological
systems, Annu. Rev. Env. Resour., 30, 441–473, 2005.
Gabr, H. S.: Perception of urban waterfront aesthetics along the Nile in Cairo, Egypt, Coast Manage., 32, 155–171, 2004.
Global Water Partnership – Technical Advisory Committee: Integrated water management, 5
Stockholm, 2000.
Gray, B.: Collaborating: Finding common ground for multiparty problems, Jossey-bass man-agement series, Jossey-Bass, San Francisco, 1989.
Hare, M.: A guide to group model building – how to help stakeholders participate in building and discussing models in order to improve understanding of resource management, Seecon 10
Deutschland GmbH, Osnabr ¨uck, 2003.
Hisschem ¨oller, M.: Participation as knowledge production and the limits of democracy, in: Democratisation of expertise? Exploring novel forms of scientific advice in political decision-making, edited by: Maasen, S. and Weingart, P., Sociology of the sciences, 24, Springer, Dordrecht, 189–208, 2005.
15
Holling, C. S.: Adaptive environmental assessment and management, International series on applied systems analysis 3, edited by: International Institute for Applied Systems Analysis, Wiley, Chichester, 1978.
Hoppe, R. and Peterse, A.: Bouwstenen voor argumentatieve beleidsanalyse, Elsevier Bedrijf-sinformatie, ’s-Gravenhage, 1998.
20
Jasanoff, S.: The fifth branch; science advisers as policymakers, Harvard University Press, Cambridge, Mass., 1990.
Kolkman, M. J., Kok, M., and van der Veen, A.: Mental model mapping as a new tool to analyse the use of information in decision-making in integrated water management, Phys. Chem. Earth, 30, 317–332, 2005.
25
Lammersen, R.: Grensoverschrijdende effecten van extreem hoogwater op de Nieder-rhein, Rijkswaterstaat, RIZA, Landesumweltamt NRW, Bundesanstalt f ¨ur Gew ¨asserkunde, D ¨usseldorf, 2004.
Maasen, S. and Weingart, P.: Democratization of expertise? Exploring novel forms of scientific advice in political decision-making, Sociology of the sciences 24, Springer, Dordrecht, 2005. 30
Margerum, R. D.: Integrated environmental management: The foundations for successful prac-tice, Environ. Manage., 24, 151–166, 1999.
applica-HESSD
5, 437–474, 2008 Measuring flood management perspectives using Q methodology G. T. Raadgever et al. Title Page Abstract Introduction Conclusions References Tables Figures ◭ ◮ ◭ ◮ Back CloseFull Screen / Esc
Printer-friendly Version Interactive Discussion tions in the social sciences 66, Sage, Newbury Park, 1988.
Mitchell, B.: Integrated water management; international experiences and perspectives, Bel-haven Press, London, 1990.
Mitchell, B.: Integrated water resources management, institutional arrangements, and land-use planning, Environ. Plann. A, 37, 1335–1352, 2005.
5
Mostert, E.: Public participation and ideology, in: Partizipation, ¨Offentlichkeitsbeteiligung, Nachhaltigkeit; Perspektiven der politischen ¨Okonomie, edited by: Feindt, P. H. and Newig, J., Metropolis Verlag, Marburg, 163–179, 2005.
Pahl-Wostl, C.: The implications of complexity for integrated resources management, Interna-tional Congress Complexity and Integrated Resources management, Osnabr ¨uck, 2004. 10
Pahl-Wostl, C. and Hare, M.: Processes of social learning in integrated resources management, J. Community Appl. Soc., 14, 193–206, 2004.
Ridder, D., Mostert, E., Wolters, H. A., Cernesson, F., Echavarren, J. M., Enserink, B., Kranz, N., Maestu, J., Maurel, P., Otter, H., Patel, M., Schlussmeier, B., Tabar ´a, D., and Taillieu, T.: Learning together to manage together – improving participation in water management, 15
Druckhaus Bergmann, Osnabr ¨uck, 2005.
Rugg, G., and McGeorge, P.: The sorting techniques: A tutorial paper on card sorts, picture sorts and item sorts, Expert Syst., 14, 80–93, 1997.
Sabatier, P. A.: The advocacy coalition framework: Revisions and relevance for Europe, J. Eur. Public Policy, 5, 98–130, 1998.
20
Steelman, T. A., and Maguire, L. A.: Understanding participant perspectives: Q-methodology in national forest management, J. Policy Anal. Manag., 18, 361–388, 1999.
Stephenson, W.: The study of behavior: Q-technique and its methodology, University of Chicago Press, Chicago, 1953.
Toulmin, S. E.: The uses of argument, Cambridge University Press, Cambridge, 1958. 25
van Exel, N. J. A. and de Graaf, G.: Q methodology: A sneak preview, 2005.
van Tubergen, G. N., and Olins, R. A.: Mail vs personal interview administration for q sorts: A comparative study, Operant subjectivity, 2, 51–59, 1979.
Vennix, J. A. M.: Group model building, Wiley, Chichester, 1996.
Webler, T. and Tuler, S.: Four perspectives on public participation process in environmental 30
assessment and decision making: Combined results from 10 case studies, Policy Stud. J., 34, 699–722, 2006.
HESSD
5, 437–474, 2008 Measuring flood management perspectives using Q methodology G. T. Raadgever et al. Title Page Abstract Introduction Conclusions References Tables Figures ◭ ◮ ◭ ◮ Back CloseFull Screen / Esc
Printer-friendly Version Interactive Discussion
Table 1. Elicitation techniques, direct results and possibilities for further analysis.
Elicitation technique Direct results of elicitation How can they be further analyzed? Interviewing Statements about issue Direct comparison (difficult) Questionnaire Statements, categorised answers, scores Statistical analysis
Card sorting Taxonomies /classification structures Direct comparison (difficult) Cognitive mapping (Causal) conceptual models Direct comparison (difficult) Protocol analysis Procedural knowledge Direct comparison (difficult) Q methodology Relative scores / ranks of statements Factor analysis
HESSD
5, 437–474, 2008 Measuring flood management perspectives using Q methodology G. T. Raadgever et al. Title Page Abstract Introduction Conclusions References Tables Figures ◭ ◮ ◭ ◮ Back CloseFull Screen / Esc
Printer-friendly Version Interactive Discussion
Table 2. Example of fixed quasi-normal distribution of statements over score categories.
Meaning Most disagree Most agree
Score category –3 –2 –1 0 1 2 3
HESSD
5, 437–474, 2008 Measuring flood management perspectives using Q methodology G. T. Raadgever et al. Title Page Abstract Introduction Conclusions References Tables Figures ◭ ◮ ◭ ◮ Back CloseFull Screen / Esc
Printer-friendly Version Interactive Discussion
Table 3. Number of respondents (N) per category (SCI=Science, GOV=Government, GLOC=Local GOV, GREG=Regional GOV, GNAT=National GOV, SOC=Society (NGO, citizen and business), DE=Germany and NL=the Netherlands) and per shared perspective.
Factor NGOV NGLOC NGREG NGNAT NSCI NSOC NDE NNL NTOTAL
Defining A 9 6 3 6 3 9 9 18 Most close 3 2 1 1 2 4 2 6 Defining B 10 2 8 1 9 2 11 Most close 3 3 1 3 1 4 Defining C 2 1 1 4 1 7 7 Most close 1 1 1 Total 27 12 5 10 12 8 25 22 47
HESSD
5, 437–474, 2008 Measuring flood management perspectives using Q methodology G. T. Raadgever et al. Title Page Abstract Introduction Conclusions References Tables Figures ◭ ◮ ◭ ◮ Back CloseFull Screen / Esc
Printer-friendly Version Interactive Discussion
Table 4. Factor values for consensus statements (that do not distinguish between any pair of
factors).
Consensus statements (Shortened, non-significant at P>0.01) Factor values
A B C
Creating space for the river is a sufficient strategy for flood management until 2050 (24)
–1 –1 –1
Socio-economic developments in flood prone areas should not be mitigated (36) –1 –3 –2 It is important to pay more attention to smaller floods and local issues (14) –1 0 –1 Flood management should be decentralised and controlled by local government (27) –2 –2 –2 It is not useful to involve NGOs and the public more actively in decision-making (26) –3 –2 –2