HAL Id: hal-00304865
https://hal.archives-ouvertes.fr/hal-00304865
Submitted on 2 Jun 2006
HAL is a multi-disciplinary open access
archive for the deposit and dissemination of
sci-entific research documents, whether they are
pub-lished or not. The documents may come from
teaching and research institutions in France or
abroad, or from public or private research centers.
L’archive ouverte pluridisciplinaire HAL, est
destinée au dépôt et à la diffusion de documents
scientifiques de niveau recherche, publiés ou non,
émanant des établissements d’enseignement et de
recherche français ou étrangers, des laboratoires
publics ou privés.
redistribution in an open tropical rainforest,
south-western Amazonia (Rondônia, Brazil)
S. Germer, H. Elsenbeer, J. M. Moraes
To cite this version:
S. Germer, H. Elsenbeer, J. M. Moraes. Throughfall and temporal trends of rainfall redistribution
in an open tropical rainforest, south-western Amazonia (Rondônia, Brazil). Hydrology and Earth
System Sciences Discussions, European Geosciences Union, 2006, 10 (3), pp.383-393. �hal-00304865�
www.hydrol-earth-syst-sci.net/10/383/2006/ © Author(s) 2006. This work is licensed under a Creative Commons License.
Earth System
Sciences
Throughfall and temporal trends of rainfall redistribution in an
open tropical rainforest, south-western Amazonia (Rondˆonia,
Brazil)
S. Germer1, H. Elsenbeer1, and J. M. Moraes2
1Institute of Geoecology, University of Potsdam, Potsdam, Germany 2CENA, University of S˜ao Paulo, Piracicaba, S.P., Brazil
Received: 9 November 2005 – Published in Hydrol. Earth Syst. Sci. Discuss.: 19 December 2005 Revised: 9 March 2006 – Accepted: 17 March 2006 – Published: 2 June 2006
Abstract. Throughfall volumes and incident rainfall were
measured between 23 August and 2 December 2004 as well as from 6 January to 15 April 2005 for individual rain events of differing intensities and magnitudes in an open tropical rainforest in Rondˆonia, Brazil. Temporal patterns of through-fall spatial variability were examined. Estimated interception was compared to modeled interception obtained by apply-ing the revised Gash model in order to identify sources of throughfall variability in open tropical rainforests.
Gross precipitation of 97 events amounted to 1309 mm, 89±5.6% (S.E.) of which reached the forest floor as through-fall. The redistribution of water within the canopy was highly variable in time, which we attribute to the high den-sity of babassu palms (Orbignya phalerata), their seasonal leaf growth, and their conducive morphology. We identi-fied a 10-min rainfall intensity threshold of 30 mm h−1above which interception was highly variable. This variability is amplified by funneling and shading effects of palms. This interaction between a rainfall variable and vegetation char-acteristics is relevant for understanding the hydrology of all tropical rainforests with a high palm density.
1 Introduction
Interception of rainwater accounts for that amount of rainfall intercepted by the canopy, which is evaporated during events or after rainfall ceased. The remaining rainfall reaches the forest floor either as throughfall or stemflow. As intercepted water does no longer participate in near-surface hydrological processes (Savenije, 2004), precise knowledge of its
magni-Correspondence to: S. Germer
tude is essential for our understanding and modeling of these processes.
Interception studies were conducted in different climatic regions and forest types, such as temperate broad-leaf (Xiao et al., 2000; Liu et al., 2003) and conifer forests (Huber and Iroume, 2001; Link et al., 2004), lowland tropical rainforests (Dykes, 1997; Schellekens et al., 1999), and tropical mon-tane forests (Holder, 2004; Munishi and Shear, 2005). In-terception is estimated by applying a variety of empirical, physically-based, and analytical models. The physically-based Rutter model (Rutter et al., 1971) and the analytical Gash model (Gash, 1979; Gash et al., 1995) are two of the most widely used interception models. Estimates of inter-ception in tropical forests are influenced by a high spatial variability of throughfall (Jackson, 1971; Lloyd and Mar-ques, 1988). This variability seems to be caused by canopy features such as leaf or woody frame properties (Herwitz, 1987). Hall (2003) showed that there is a positive correlation between LAI (leaf area index) and interception, but that inter-ception can vary broadly due to different leaf properties for canopies with the same LAI. Other studies focused on the ef-fect of differing percentage of canopy cover, but found only a weak relationship between throughfall and canopy cover (Tob´on Marin et al., 2000; Loescher et al., 2002). Others investigated throughfall amount as a function of distance to tree trunks (Ford and Deans, 1978; Beier et al., 1993; Schroth et al., 1999), but found this distance to be a poor predic-tor (Keim et al., 2005). Herwitz and Slye (1992) found that neighboring canopy tree crowns can receive different depths of gross rainfall, resulting in a variable pattern of throughfall due to inclined rainfall and shading effects of nearby trees.
Keim et al. (2005) investigated the temporal persistence of spatial patterns of throughfall and found them to be sta-ble for three forest stands with different canopy complexities
in the Pacific Northwest, USA. Details of canopy intercep-tion, in particular within the tropics, are still not well under-stood. To our knowledge temporal variability of spatial pat-terns of throughfall in tropical rainforests has not been stud-ied before. The results of such a study, however, are expected to lead to a better understanding of the interception process within these environments, in particular for event based stud-ies conducted over several month.
Our objectives were a) to quantify throughfall in an open tropical rainforest with high palm density, b) to identify any temporal patterns of throughfall spatial variability, and c) to determine the conditions under which this variability com-plicates the estimation of interception.
2 Material and methods
2.1 Site and climate
The study site Rancho Grande is located about 50 km south of Ariquemes (10◦180S, 62◦520W, 143 m a.s.l.) in the Brazil-ian state of Rondˆonia, which is situated in the southwestern part of the Amazon basin.
The area is part of a morphostructural unit known as “Southern Amazon Dissected Highlands” (Planalto Dis-secado Sul da Amazˆonia, Peixoto de Melo et al., 1978), which is characterized by a very pronounced topography with an altitudinal differential of up to 150 m: remnant ridges of Precambrian basement rock, made up of gneisses and granites of the Xingu (Leal et al., 1978) or Jamari Complex (Isotta et al., 1978), are separated by flat valley floors of vary-ing width. Soil orders associated with this morphostructural unit are Ultisols, Oxisols, and Inceptisols and Entisols (Soil Survey Staff, 1999) on steep slopes and along streams, re-spectively.
The vegetation at this terra firme study site consists of primary open tropical rainforest (Floresta Ombr´ofila Aberta) with a large number of palm trees. In Rondˆonia open trop-ical rainforest amounts to 55% of the total vegetation area (Pequeno et al., 2002). It is characterized by a discontinu-ous upper canopy of up to 35 m height with emergent trees up to 45 m tall, permitting the sun light to reach the under-story and thereby facilitating a dense undergrowth. Roberts et al. (1996) determined a LAI of 4.6 for an open tropi-cal rainforest at the ecologitropi-cal reserve “Reserva Jaru” about 100 km east of Rancho Grande, compared to a LAI of 6.1 for a dense tropical rainforest measured 60 km north from Manaus. For trees with DBH (diameter at breast height) >5 cm, the tree density is 813 ha−1including 108 palms, and 520 ha−1for DBH>10 cm, including 81 palms. Among the 94 species with DBH>5 cm (89 species with DBH>10 cm) the most abundant are Pama verdadeira (Brosimum
gau-dichaudii, Moraceae) and Breu rosa (Protium sp., Burs-eraceae). The most common palm species in this region
are Paxiuba bariguda (Iriartea deltoidea), followed by the
babassu palm (Orbignya phalerata, local name: babac¸u) with a density of 36 full-grown and 115 young individuals per hectare.
The climate of Rondˆonia is tropical wet and dry (K¨oppen’s Aw). The mean annual temperature is about 27◦C. Varia-tions in mean monthly temperature maxima and minima are on average 12.4◦C, ranging from 10.6◦C in March to 15.7◦C in August. Mean annual precipitation is 2300 mm with a marked dry period from July through September. On aver-age, 144 days with rainfall are registered per year, 133 of which fall into the rainy season lasting from October to June. On average, 20 rain days per month occur during the peak of the rainy season, from December through March. The seasonal variation in average daily relative humidity levels ranges from 65% in July to 80% in December (averages of the years 1984–2003, Schmitz, personal communication).
2.2 Experimental design and data analysis
Throughfall and gross rainfall were measured on event basis between 23 August and 2 December 2004 as well as from 6 January to 15 April 2005, whilst stemflow was measured from 27 January up to 20 March 2005.
2.2.1 Gross rainfall
A tipping bucket rain gauge (Hydrological Services P/L, Liv-erpool Australia) with a resolution of 0.254 mm and a Camp-bell logger recorded 5-min rainfall intensity values on a pas-ture about 400 m from the forest. In order to characterize events, we selected for each event the contiguous 10 and 60 min with the highest rainfall intensities to calculate the maximum 10 min intensities (I10max) and maximum 60 min intensities (I60max) in mm h−1. We did not include events with a duration of less than 10 and 60 min, respectively.
In addition, incident rainfall was measured with three trough-type collectors. One was read manually and the other two were connected to one single tipping bucket logged by a Hobo Event Logger (Onset) with a resolution of 0.51 mm. The collectors, installed on support 1 m above ground, were made out of 150 mm diameter PVC pipes, which were con-nected via flexible tubes to 20 L plastic canisters. The total collecting area per collector was 980 cm2(70 cm * 140 cm). To avoid splash losses a orifice with a width (70 mm) smaller than the diameter was cut out of the PVC pipes. The rain-fall quantity data of the trough-type collectors was only used to calibrate the trough collector volumes with volumes mea-sured by the automatic weather station (calibration factor: 1.1, R2=0.99).
In order to qualify for an event, at least 0.5 mm of rainfall must have been recorded in half an hour. Events are sepa-rated by at least two hours without rain.
2.2.2 Throughfall
Throughfall quantities per event were measured manually with 20 collectors (10 collectors between 26 August and 1 September 2004) as described above, which were leveled and cleaned of litter after each event. The measured through-fall was corrected by the calibration factor described previ-ously.
The collectors were distributed throughout a heavily in-strumented catchment with a maximum distance of 170 m between collectors. Their sites were chosen at random, but with a view towards minimizing disturbance instead of a strictly random distribution with random relocation of col-lectors (Lloyd and Marques, 1988); Helvey and Patric (1965) recommended such a random relocation, but only for inter-ception studies on a weekly or monthly basis but not on an event basis as in our case. Even so, we attempted to cover the small-scale variability in vegetation.
Two hours after every event or alternatively the next morn-ing for events which ended after 09:00 PM, we emptied the collectors and quantified the throughfall with graduated cylinders of three different sizes. For events with less or equal to 5 mm, between 5 and 15 mm and events bigger or equal to 15 mm graduated cylinders of 100 ml, 500 ml and 1000 ml were used, respectively.
Throughfall values per event were tested for normality us-ing the Shapiro-Wilk-Test (Shapiro and Wilk, 1965). As throughfall was not normally distributed for 24% of the events, the median of all collectors was used to estimate throughfall per event.
To determine whether high or low throughfall areas per-sist between events, Keim et al. (2005) used the standardized throughfall, ˜Ti,j, for each sample point i:
˜ Ti,j =
Ti,j− ¯Tj
sTj
, (1)
where Ti,j is the throughfall at sampling point i of event j ,
¯
Tj is the mean throughfall for a given event j , and sTj its standard deviation. We used the same equation, but with the median and its standard deviation (Sachs, 1984) instead of the mean and its standard deviation.
2.2.3 Stemflow
Stemflow or the rainfall diverted to trunk, pt, was collected
along the catchment perimeter, which resulted in a maximum distance between sample trees of 300 m. Aluminum col-lectors with an inner diameter of 3–4 cm were fitted around trunks at breast hight (1.3 m above the forest floor) in a down-ward spiral. Polythene inlays were sealed to the trunks, and flexible tubes diverted the water to canisters standing on the forest floor. Stemflow was measured for 24 randomly se-lected trees in three different DBH classes (5–10 cm, 10– 20 cm and >20 cm) and for one palm class with 8 large aborescent babassu palms. The stemflow, Sj, per class j in
mm for individual storms n was determined using the equa-tion applied by Hanchi and Rapp (1997):
[Sj]n= [vj]n∗Fj∗10−4, (2)
where vjis the median stemflow in liter per class j and event
nand Fj is the number of trees per hectare and class j . The
stemflow percentage of incident rainfall was then calculated for each class and each storm. The median stemflow per-centages per class were summed up, to obtain median stem-flow for our study site. The instrumentation and measure-ment procedure of stemflow is described in more detail in a parallel work Werther (2005)1. For our study, we used an av-erage value for stemflow of 8.0% of incident rainfall for all events.
2.3 The revised Gash model 2.3.1 Model description
In cases of low data availability a simple regression equation is often used to describe interception:
I = aPG+b , (3)
where I is the interception in mm of incident rain, PGis the
gross rainfall and a and b are the regression coefficients. Un-like the regression equation, the original Gash model (Gash, 1979) is based on a simple but realistic approach to describe the interception process, and yet is characterized by a low data requirement. The revised Gash model (Gash et al., 1995) is an adaptation of the original model to account for stands with sparse canopies.
The original and the revised Gash model assume that the two major factors which control the evaporation of inter-cepted rainfall are 1) the duration of evaporation from the sat-urated canopy per event plus the associated evaporation rate and 2) the canopy saturation capacity as well as the number of times the saturated canopy is dried out completely after an event.
The amount of rainfall needed to completely saturate the canopy, P0
G, is expressed by Gash et al. (1995) as
PG0 = −RSc Ec ln " 1 − Ec R # , (4)
where R is the mean rainfall rate and Ecis the mean
evap-oration rate from the canopy. The canopy capacity per unit area of cover, Sc=S/c, is the amount of water remaining on
the saturated canopy after rainfall and throughfall ceased. To get an estimate for the mean rainfall rate falling onto the saturated canopy, R is calculated for all hours exceed-ing a certain threshold of hourly rainfall. We adopted a value of 0.5 mm h−1 in accordance to Gash (1979), Lloyd et al. (1988) and Schellekens et al. (1999).
1Werther, L.: Stemflow in an open tropical rainforest in
Rondˆonia, Brazil, M.Sc. Thesis, University of Potsdam, Potsdam, unpublished, 2005.
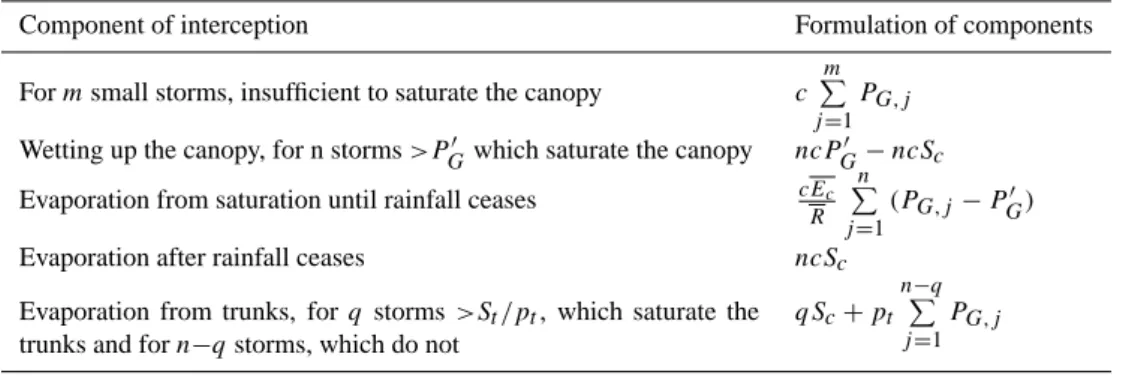
Table 1. The components of the revised interception model according to Gash (1995).
Component of interception Formulation of components For m small storms, insufficient to saturate the canopy c
m
P
j =1
PG,j
Wetting up the canopy, for n storms >PG0 which saturate the canopy ncPG0 −ncSc
Evaporation from saturation until rainfall ceases cEc R
n
P
j =1
(PG,j−PG0)
Evaporation after rainfall ceases ncSc
Evaporation from trunks, for q storms >St/pt, which saturate the
trunks and for n−q storms, which do not
qSc+pt n−q
P
j =1
PG,j
Interception is calculated in several steps by dividing the rainfall events into three phases. The first considers the stage before the canopy is saturated, with PG<PG0, the second
cov-ers the part of the rainfall event when the canopy is satu-rated, and the last stage refers to the evaporation after the rain ceased. This trichotomy leads towards the five equations summarized in Table 1. Total interception is calculated as the sum of these different components. According to Gash (1979) and Lloyd et al. (1988), we calculated mean rainfall intensity for all hours with PGgreater 0.5 mm h−1; however,
the difference to all hours of rainfall is not great due to the short and intense rainfall events typical for this climate.
Gash (1979) suggested to determine Ec by regressing
in-terception on gross rainfall, as the regression coefficient pro-vides Ec/R. Due to the high varaiability of throughfall, Ec
could not be determined by this method in our study. Instead we adopted the value of 0.21 mm h−1found by Lloyd (1988) for central Amazonia, which appears to be typical for tropical forests (Hall, 2003).
2.3.2 Forest parameters
Canopy interception parameters are usually estimated by gross rainfall and throughfall data collected on an event or weekly basis (Leyton et al., 1967; Gash and Morton, 1978; Rowe, 1983; Jetten, 1996), compensating short-term vari-ability. The canopy capacity is often determined by the method of Leyton et al. (1967), where in a plot of through-fall versus rainthrough-fall a line with a slope of one is drawn pass-ing through events with maximum throughfall. The inter-cept with the gross rainfall axis is interpreted as the value for canopy storage.
This method however, is not suitable for forests with a high spatial variability of throughfall. Instead, we em-ployed a slightly modified version of the method of Lloyd et al. (1988). For each collector, we regressed throughfall on gross precipitation for events with 1.5≤PG≤15.0 mm.
Be-cause of outliers and high-leverage points, we used a robust regression method based on Tukey’s beweight (Hoaglin et al., 2000). To ensure the drying out of the canopy, only events
separated by dry periods of at least 6 h were considered in these calculations. It is assumed that for the small events used for this approach evaporation can be ignored. Stemflow, however, can’t be neglected for this kind of forest (Werther, 2005)1. In contrast to Lloyd et al. (1988), we defined for each collector a regression of throughfall over the difference of gross rainfall and the stemflow proportion
T = a(PG−pt ∗PG) + b (5)
with a as the slope of the regression and b the intercept. The canopy capacity per ground area, S, is determined as the mean intercept of the regression lines with the x-axis. The standard deviation of S was calculated using the mean stan-dard deviation of b for all collectors.
We estimated the free throughfall coefficient, p, with dig-ital photographs taken on January 15, 2005. At each of three equidistant points in the catchment, we laid out two 10-m long transects normal to each other, along which we took black-and-white pictures of the canopy, with a camera mounted on a level, in one meter intervals, resulting in a total of 60 pictures. An image editing program was used to find the center of the images to verify if the center was covered by the canopy or not, which yielded a proportion of canopy cov-erage, c, and hence the free throughfall coefficient p=1−c.
3 Results and discussion
3.1 Gross rainfall
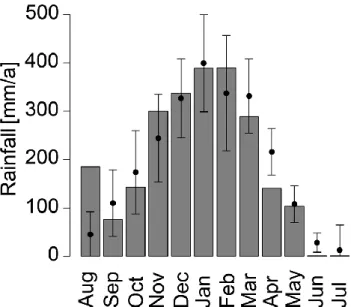
The total incident rainfall at Rancho Grande from August 2004 to July 2005 was 2286 mm a−1, being in line with the mean annual rainfall amount of the previous 20 years of 2300 mm a−1. The month of August, however, was far wet-ter than the average (Fig. 2), due to an early start of the rainy season. In addition, April and June were much drier than the respective 20-year average.
We collected 97 events over the two monitoring peri-ods (Aug–Dec and Jan–Apr), with a total of gross precip-itation of 1309 mm. Rainfall intensity for all measured
Fig. 1. Monthly rainfall data from August 2004 to July 2005. The
solid circles and the vertical lines are the mean and standard error, respectively for the period 1984–2003.
events and all hours with intensities >0.5 mm h−1averaged 6.66 mm h−1. The highest values for I10max and I60max were 100.61 mm h−1and 57.91 mm h−1, respectively. Du-rations shorter than 1 h were found for 44% of the events. 3.2 Throughfall
All throughfall results are summarized in Table 2. A sam-ple size n of less than 20 (less than 10 for events between 26 August and 1 September 2004) implies loss of data for indi-vidual collectors. The total measured throughfall volume of the whole study period was 1175 mm or 89.8±5.6% (S.E.) of incident rainfall. This percentage is in line with results of other studies. Ubarana (1996) reported 87% of observed total throughfall for Reserva Jaru site within about 100 km of our site. These values fall within the range of throughfall values reported for rainforests in the Amazon basin with 78–91% (Lloyd and Marques, 1988; Elsenbeer et al., 1994; Filoso et al., 1999; Tob´on Marin et al., 2000), in Asia of about 80% (Sinun et al., 1992; Dykes, 1997) or Africa with 92–97% (Chuyong et al., 2004).
For 18 events throughfall volumes of more than 100% of PG were measured and throughfall plus the proportional
stemflow volumes of the incident rainfall exceeded rainfall volumes in 25 cases, resulting in negative values for inter-ception. Despite two cases in August negative values did occur more frequently from November onwards. Since neg-ative values for average interception per event can only be expected for some special forest types, e.g. mountain cloud forests (Holder, 2004), there is either an underestimation of rainfall or an overestimation of throughfall quantities for these events. Our own manual rainfall measurements next to
Fig. 2. Plot of normalized throughfall, ˜T, for the whole period. Each circle represents the event throughfall volume at a single col-lector, normalized to zero median and unit variance for that event. The collectors are plotted on the horizontal axis and ranked by their means, ˜T, which are connected by the black curve.
the automatic rain gauge, however, preclude the former pos-sibility. Therefore, these negative values are likely to result from an effect induced by not only the spatial variability of throughfall, but also the temporal variability of throughfall in individual collectors as discussed hereafter.
Throughfall amounts vary highly among collectors due to drip points and caps above the collectors (Loescher et al., 2002). The plot of normalized throughfall, ˜T (Fig. 2) is ranked by mean ˜T per collector. Since each dot represents one throughfall observation at a single collector, the plot shows the temporal variability of throughfall for each tor. Several collectors registered frequently more (e.g. collec-tors 14 or 20) or less (e.g. colleccollec-tors 2 or 13) than the median throughfall per event, as indicated by the deviation from the horizontal axis. None of the collectors deviated, however, persistently in either direction. The temporal variability in some of our collectors was up to three times as high as in others (e.g. collectors 7 and 19). In contrast to our results, Keim et al. (2005) found a much lower temporal variability for coniferous and deciduous stands in the Pacific Northwest, USA, which we attribute to the differences in homogeneity of the two forest types.
Figure 2 does not show whether the variability of single collectors is temporally stable. By plotting throughfall per event as a percentage of PGover time for each collector
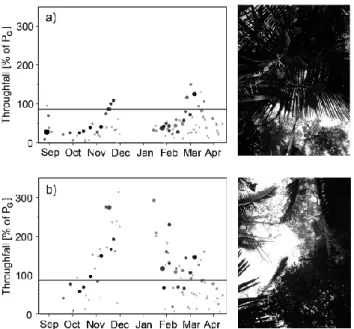
sepa-rately, a temporal trend in some of the collectors becomes ev-ident. Figure 3 shows two impressive examples of this tem-poral variability of throughfall proportions, for two collec-tors, 2 and 19. For the latter, maximum throughfall percent-ages of over 300% were registered. In both cases, throughfall rises sharply from early October towards December. Dur-ing the second study period (Jan–Apr), the same trend can be observed for collector no. 2 and a decreasing trend for collector no. 19. For both periods, collector no. 2 (Fig. 3a) shows a pattern only for large, high intensity events, while collector no. 19 (Fig. 3b) shows a pattern regardless of event size or intensity. The photographs in Fig. 3 were taken up-right from the middle of the collectors, showing the canopy
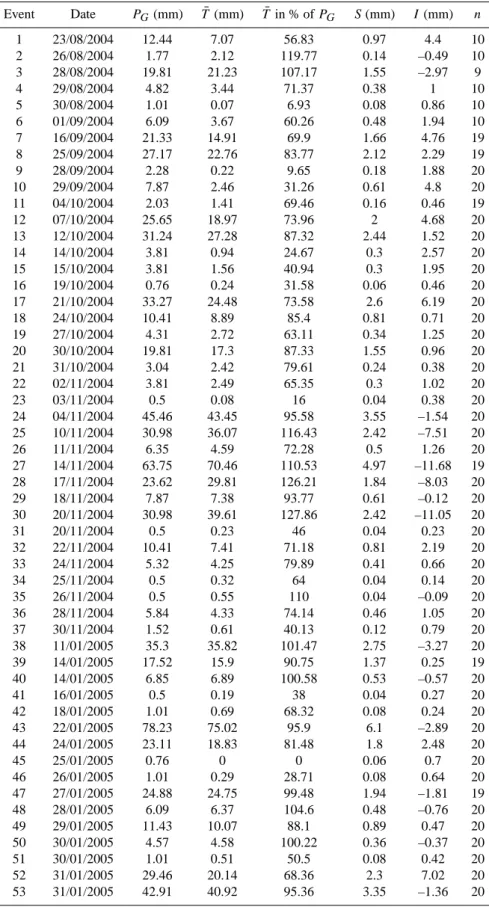
Table 2. Summary of events, PG: observed gross precipitation; ¯T: median throughfall of n collectors; S: estimated stemflow; I : interception; n: number of collectors. Event Date PG(mm) T¯ (mm) T¯ in % of PG S(mm) I(mm) n 1 23/08/2004 12.44 7.07 56.83 0.97 4.4 10 2 26/08/2004 1.77 2.12 119.77 0.14 –0.49 10 3 28/08/2004 19.81 21.23 107.17 1.55 –2.97 9 4 29/08/2004 4.82 3.44 71.37 0.38 1 10 5 30/08/2004 1.01 0.07 6.93 0.08 0.86 10 6 01/09/2004 6.09 3.67 60.26 0.48 1.94 10 7 16/09/2004 21.33 14.91 69.9 1.66 4.76 19 8 25/09/2004 27.17 22.76 83.77 2.12 2.29 19 9 28/09/2004 2.28 0.22 9.65 0.18 1.88 20 10 29/09/2004 7.87 2.46 31.26 0.61 4.8 20 11 04/10/2004 2.03 1.41 69.46 0.16 0.46 19 12 07/10/2004 25.65 18.97 73.96 2 4.68 20 13 12/10/2004 31.24 27.28 87.32 2.44 1.52 20 14 14/10/2004 3.81 0.94 24.67 0.3 2.57 20 15 15/10/2004 3.81 1.56 40.94 0.3 1.95 20 16 19/10/2004 0.76 0.24 31.58 0.06 0.46 20 17 21/10/2004 33.27 24.48 73.58 2.6 6.19 20 18 24/10/2004 10.41 8.89 85.4 0.81 0.71 20 19 27/10/2004 4.31 2.72 63.11 0.34 1.25 20 20 30/10/2004 19.81 17.3 87.33 1.55 0.96 20 21 31/10/2004 3.04 2.42 79.61 0.24 0.38 20 22 02/11/2004 3.81 2.49 65.35 0.3 1.02 20 23 03/11/2004 0.5 0.08 16 0.04 0.38 20 24 04/11/2004 45.46 43.45 95.58 3.55 –1.54 20 25 10/11/2004 30.98 36.07 116.43 2.42 –7.51 20 26 11/11/2004 6.35 4.59 72.28 0.5 1.26 20 27 14/11/2004 63.75 70.46 110.53 4.97 –11.68 19 28 17/11/2004 23.62 29.81 126.21 1.84 –8.03 20 29 18/11/2004 7.87 7.38 93.77 0.61 –0.12 20 30 20/11/2004 30.98 39.61 127.86 2.42 –11.05 20 31 20/11/2004 0.5 0.23 46 0.04 0.23 20 32 22/11/2004 10.41 7.41 71.18 0.81 2.19 20 33 24/11/2004 5.32 4.25 79.89 0.41 0.66 20 34 25/11/2004 0.5 0.32 64 0.04 0.14 20 35 26/11/2004 0.5 0.55 110 0.04 –0.09 20 36 28/11/2004 5.84 4.33 74.14 0.46 1.05 20 37 30/11/2004 1.52 0.61 40.13 0.12 0.79 20 38 11/01/2005 35.3 35.82 101.47 2.75 –3.27 20 39 14/01/2005 17.52 15.9 90.75 1.37 0.25 19 40 14/01/2005 6.85 6.89 100.58 0.53 –0.57 20 41 16/01/2005 0.5 0.19 38 0.04 0.27 20 42 18/01/2005 1.01 0.69 68.32 0.08 0.24 20 43 22/01/2005 78.23 75.02 95.9 6.1 –2.89 20 44 24/01/2005 23.11 18.83 81.48 1.8 2.48 20 45 25/01/2005 0.76 0 0 0.06 0.7 20 46 26/01/2005 1.01 0.29 28.71 0.08 0.64 20 47 27/01/2005 24.88 24.75 99.48 1.94 –1.81 19 48 28/01/2005 6.09 6.37 104.6 0.48 –0.76 20 49 29/01/2005 11.43 10.07 88.1 0.89 0.47 20 50 30/01/2005 4.57 4.58 100.22 0.36 –0.37 20 51 30/01/2005 1.01 0.51 50.5 0.08 0.42 20 52 31/01/2005 29.46 20.14 68.36 2.3 7.02 20 53 31/01/2005 42.91 40.92 95.36 3.35 –1.36 20
Table 2. Continued. Event Date PG(mm) T¯ (mm) T¯ in % of PG S(mm) I(mm) n 54 04/02/2005 15.24 4.75 31.17 1.19 9.3 20 55 05/02/2005 8.89 5.44 61.19 0.69 2.76 20 56 06/02/2005 1.27 0.52 40.94 0.1 0.65 20 57 08/02/2005 43.43 38.62 88.92 3.39 1.42 20 58 09/02/2005 14.73 13.77 93.48 1.15 –0.19 20 59 11/02/2005 37.84 24.34 64.32 2.95 10.55 20 60 13/02/2005 2.54 1.93 75.98 0.2 0.41 20 61 15/02/2005 2.03 1.54 75.86 0.16 0.33 20 62 17/02/2005 30.22 27.24 90.14 2.36 0.62 20 63 17/02/2005 4.57 3.66 80.09 0.36 0.55 20 64 18/02/2005 2.28 1.31 57.46 0.18 0.79 20 65 19/02/2005 30.48 24.07 78.97 2.38 4.03 20 66 21/02/2005 0.76 0.66 64.71 0.08 0.28 20 67 21/02/2005 23.36 24.03 102.87 1.82 –2.49 20 68 23/02/2005 33.27 50.5 151.79 2.6 –19.83 19 69 24/02/2005 3.04 0.57 18.75 0.24 2.23 20 70 26/02/2005 1.52 0.82 53.95 0.12 0.58 20 71 27/02/2005 31.75 24.39 76.82 2.48 4.88 20 72 28/02/2005 17.27 18.52 107.24 1.35 –2.6 20 73 01/03/2005 8.12 5.74 70.69 0.63 1.75 20 74 02/03/2005 11.68 13.86 118.66 0.91 –3.09 20 75 04/03/2005 6.09 4.02 66.01 0.48 1.59 20 76 05/03/2005 57.66 61.56 106.76 4.5 –8.4 20 77 07/03/2005 6.09 1.67 27.42 0.48 3.94 20 78 07/03/2005 3.04 1.65 54.28 0.24 1.15 20 79 10/03/2005 6.09 4.43 72.74 0.48 1.18 19 80 11/03/2005 2.79 1.72 61.65 0.22 0.85 20 81 13/03/2005 1.77 1.61 90.96 0.14 0.02 20 82 14/03/2005 21.84 20.37 93.27 1.7 –0.23 20 83 16/03/2005 16.75 14.41 86.03 1.31 1.03 20 84 17/03/2005 10.66 12.65 118.67 0.83 –2.82 20 85 18/03/2005 8.38 6.82 81.38 0.65 0.91 20 86 20/03/2005 2.03 2.71 133.5 0.16 –0.84 20 87 20/03/2005 4.57 3.57 78.12 0.36 0.64 20 88 21/03/2005 1.01 0.72 71.29 0.08 0.21 20 89 23/03/2005 3.04 0.61 20.07 0.24 2.19 20 90 28/03/2005 33.52 30.21 90.13 2.61 0.7 20 91 01/04/2005 1.77 1.22 68.93 0.14 0.41 20 92 02/04/2005 14.47 12.06 83.34 1.13 1.28 20 93 03/04/2005 4.82 3.48 72.2 0.38 0.96 20 94 04/04/2005 2.54 1.31 51.57 0.2 1.03 20 95 05/04/2005 4.57 2.53 55.36 0.36 1.68 19 96 06/04/2005 0.76 0.25 32.89 0.06 0.45 20 97 10/04/2005 4.57 2.73 59.74 0.36 1.48 20 Total: 1307.90 1175.36 102.2 31.1
structures at the respective site. Eleven out of twenty collec-tors showed temporal trends (collector no. 2,3, 5, 7, 8, 10, 12, 15, 17, 19 and 20) in throughfall proportions. Among the nine remaining collectors without any temporal trends, five collectors (no. 6, 9, 11, 13 and 18) did not have palm leaves above them. Only one collector (no. 12) without palm tree
parts above it showed a slight temporal effect in the begin-ning of the first study period. Nevertheless, the results show that strong temporal patterns of throughfall volumes were ob-served beneath palms. Individual palm leaves can act as a natural gutter thanks to the typical, convex form of the peti-oles, which enables them to collect more water than some
Fig. 3. Temporal patterns of throughfall percentages of incident
rainfall for two collectors standing only 5 m apart from each other. Each event is represented by a dot whose diameter is proportional to rainfall amount. Varying colours from light grey to black illustrate low and high rainfall intensity (I10max) values, respectively. The
photographs on the right site show the vegetation above these two collectors.
trees of the understory. The water is either diverted to the stems or is funneled towards drip points. As babassu palm leaves grow, they do not just increase in size, but move ver-tically and horizontally within the canopy due to their own weight gain. If the palm leaves move, the associated drip points move as well and collectors at fixed positions may record a temporal pattern of throughfall percentages. As the growing season of babassu palms falls within the rainy sea-son (Andersea-son, 1983), these temporal patterns start in Octo-ber and become more obvious with the beginning of Novem-ber.
These observations suggest a significant redistribution of water within the canopy and a temporal pattern of this re-distribution. Because this redistribution is linked to babassu palms, our findings are pertinent to the understanding of the hydrology of palm-dominated tropical rainforests. Such forests are wide-spread from the eastern to southwestern re-gion of the Amazon basin (Kahn and Granville, 1992). In some regions, this invasive plant forms pure populations in regenerating forest gaps or in abandoned pastures (Lorenzi, 2002). Regional forest surveys do not include subterranean-stemmed palms, whose leaves may reach a length of 9 m. Several authors (Jordan, 1978; Lloyd and Marques, 1988; Manfroi et al., 2004) found that small trees growing in the un-derstory of forests often produce more stemflow than emer-gent trees with a greater DBH. Consequently, the juvenile palm leaves may be at least as important as leaves from adult
Table 3. Canopy parameters used for interception modeling.
Parameter Value
SC(canopy capacity per unit cover area) (mm) 0.74±0.44
c(canopy cover) 0.97
PG0 (PGneeded to saturate the canopy) (mm) 0.33
EC(mean evaporation rate) (mm h−1) 0.21
R(mean rainfall rate) (mm h−1) 6.66
pt (rainfall diverted to trunk) 0.08
St (trunk storage capacity) (mm) 0.22
palms concerning the redistribution and uneven input of rain-fall to the forest floor. A high density of juvenile palms in the understory as we found for an open tropical rainforest has been reported from other authors for dense rainforests, with individuals reaching heights of 2–4 m in Colombian Amazo-nia (Tob´on Marin et al., 2000) or 4–5 m in Central Brazilian Amazonia (Lloyd and Marques, 1988). More research with an appropriate sampling design is required to evaluate the importance of small palms in redistributing water and pro-ducing locally high inputs of throughfall to the forest floor. 3.3 The revised Gash model
Table 3 summarizes the meteorological and canopy input parameters for the interception modeling. Beside canopy cover, the most sensitive parameter in the original and re-vised Gash model is the canopy capacity per unit cover area, Sc. The value of 0.74±0.44 mm (S.E.) for Sc for our site
does not differs from the 1.03 mm reported for the Reserva Jaru, Rondˆonia (Ubarana, 1996) or from the 1.15 mm found by Schellekens et al. (1999) for a lowland tropical rainforest in Puerto Rico. But it is lower than the 1.25 mm and 1.16– 1.55 mm reported for other sites in Amazonia (Ubarana, 1996; Tob´on Marin et al., 2000, respectively).
We found a free throughfall coefficient, p, of 0.03, which is in line with the range of values (0.03 to 0.08) obtained by photographic techniques (Lloyd et al., 1988; Ubarana, 1996). These values differ clearly from those determined by more subjective methods (Leyton et al. 1967), which range from 0.23 to 0.32 (Jackson, 1975; Elsenbeer et al., 1994; Schellekens et al., 1999). According to the definition of free throughfall as the amount of water falling through the canopy without striking it, the photographic techniques seem to es-timate this proportion better than the other methods, that are influenced by that part of throughfall striking the canopy but reaching the forest floor before the canopy is saturated.
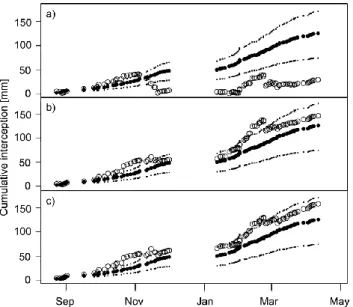
Figure 4 shows the modeled cumulative interception and that calculated from median throughfall (further referred to as “calculated interception”) for all events. As discussed in the previous section, negative interception was observed due to the occasional overestimation of average throughfall.
Fig. 4. Cumulative totals of calculated (open circles) and estimated
(solid circles) interception for (a) all collectors (n=20), (b) collec-tors not showing temporal patterns of throughfall percentages (n=9) and for (c) collectors without obvious influence of the palm species
Orbignya phalerata (n=6). The dots indicate the uncertainty of the
modeled interception resulting from the uncertainty in SC.
Beside this overestimation, it is clear from Fig. 4a that the curves of modeled and calculated interception values show a similar increase up to the beginning of November, when the number of events with negative interception increased and the growing season of the babassu palm started. If the assumption is true that the redistribution of rainfall water within the canopy due to the babassu palms is responsible for the difference of the curves of modeled and calculated values, then these differences should not be observed for through-fall medians from collectors with no obvious palm influence or for all collectors which do not show any temporal trends. Figures 4b and c show a better agreement between calcu-lated and modeled values, due to higher calcucalcu-lated intercep-tion from mid-November on. The modeled intercepintercep-tion does not change within Fig. 4, as the forest parameters used in the model are mean values for our study site. The better fit for collectors without temporal patterns (Fig. 4b) is plausible be-cause the excluded collectors tend towards higher throughfall which is most obvious for collectors 7, 17 and 19 (Fig. 2). In addition, the increase of calculated cumulative interception is greater if fewer collectors with palm influence (14, 4, 0 in Figs. 4a, b and c, respectively) are used for the calculations. But the crucial point is that the curves in Figs. 4b and c still show the same trends of calculated interception. Hence, this pattern is unlikely to be induced, but rather amplified, by the presence or absence of drip points associated with palms.
In order to identify causes for the trends in calculated interception, we examined the dependency of interception on rainfall intensity. I10max instead of I60max was used
Fig. 5. The relationship between calculated interception and
maxi-mum 10 min rainfall intensity (I10max).
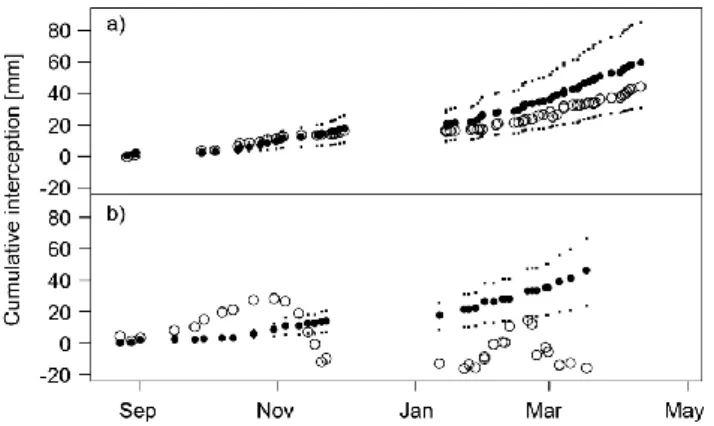
for this purpose, to include the maximum possible number of events. The relationship of calculated interception and I10max (Fig. 5) reveals a rainfall intensity threshold of about 30 mm h−1, beyond which interception values show consid-erable scatter. When cumulative calculated and modeled terception are plotted separately for events with rainfall in-tensities below and above this threshold (Figs. 6a and b, re-spectively), the calculated cumulative curve for low intensi-ties shows a uniform trend and falls within the limits of un-certainty of the estimated values. In contrast, the calculated interception for high intensity events shows a variable trend and exceeds the uncertainty limits of the modeled values. As the calculated interception is inferred from the through-fall median, we conclude that for high intensity events it is not adequate to estimate the average throughfall from ran-domly distributed collectors. Instead, the spatial pattern of drip points and hence of throughfall must be known to esti-mate a weighted throughfall mean. Such a weighted through-fall mean might improve the estimation of interception also at low rainfall intensities.
It should be kept in mind that any discrepancy between modeled and actual interception derives from the uncertainty not only of SC, but also of mean evaporation. Schellekens
et al. (1999), using the original Gash model, reported good predictability of cumulated throughfall for a maritime dense tropical rainforest in Puerto Rico as long as the value of Ew/R was derived from the regression of interception and
event rainfall. Although some of their events exceeded our 10-min rainfall intensity threshold (Schellekens, private communication), the authors did not report high negative in-terception values for single events. Lloyd et al. (1988) stated that the original Gash model performed adequately for a dense tropical rainforest in Central Amazonia, although they did get negative values for interception, which they attributed to the low number of collectors and high spatial variability.
Fig. 6. Cumulative totals of calculated (open circles) and estimated
(solid circles) interception for maximum 10 min rainfall intensities
(a) I10max≤30 mm h−1and (b) I10max>30 mm h−1including all
collectors (n=20). The dots indicate the uncertainty of the modeled interception resulting from the uncertainty in SC.
It would be interesting to know if the negative interception values found by Lloyd et al. (1988) were associated to maxi-mum 10-min intensities greater than 30 mm h−1.
4 Conclusions
Tropical rain forest are the most difficult forest type in which to measure throughfall, stemflow and consequently to deter-mine interception. We calculated a total measured through-fall volume of 89.8±5.6% of incident rainthrough-fall.
The results of our experiment suggest furthermore that in open tropical rainforests with high palm densities, the palms play an important role in generating dynamic spatial vari-ability of throughfall. At our study site, the babassu palm
(Orbignya phalerata) is the most important species
respon-sible for high redistribution of rainfall within the canopy due to their conducive morphology and their high stem density. The spatial pattern of water input to the forest floor shows temporal patterns, which appear to be controlled by babassu palms and their leaf growth. Furthermore, the relationship of 10-min rainfall intensity and interception revealed a thresh-old of 30 mm h−1above which the calculated interception is highly variable. A comparison of calculated and modeled interception showed that this variability can be greatly ampli-fied by funneling and shading effects of palms (Fig. 4). We conclude that for high intensity events it is not possible to estimate interception from median throughfall. If the spatial pattern of throughfall is known, a weighted mean throughfall might yield better results.
As the babassu palm is common throughout the Amazon basin (Kahn and Granville, 1992) in upland as well as in sea-sonal swamp forests, the role of pronounced redistribution of rainfall within the canopy due to these palms should be considered in future research. As the high intensity events responsible for the large variability in throughfall tend to be
of high magnitude as well, our results are relevant for the hydrology not only of open tropical rainforest dominated by palms, but perhaps as well for dense tropical rainforest with a high density of juvenile palms in the understory.
Acknowledgements. This study was partially supported by the US
National Science grant no. DEB-0315656 and the LBA program grant NCC5-285 to the Marine Biological Laboratory. H. Elsenbeer and J. de Moraes were supported by PROBRAL, a DAAD and CAPES-financed program. We all want to thank the Schmitz family for logistical support and the opportunity to work on their land. Edited by: N. Romano
References
Anderson, A. B.: The biology of Orbignya martiana (Palmae), trop-ical dry forest dominant in Brazil, Ph.D., University of Florida, Gainesville, Florida, 1983.
Beier, C., Hansen, K., and Gundersen, P.: Spatial variability of throughfall fluxes in a spruce forest, Environ. Pollut., 81, 257– 267, 1993.
Chuyong, G. B., Newbery, D. M., and Songwe, N. C.: Rainfall in-put, throughfall and stemflow of nutrients in a central African rain forest dominated by ectomycorrhizal trees, Biogeochem., 67, 73–91, 2004.
Dykes, A. P.: Rainfall interception from a lowland tropical rainfor-est in Brunei, J. Hydrol., 200, 260–279, 1997.
Elsenbeer, H., Cassel, D. K., and Zuniga, L.: Throughfall in the terra firme forest of western Amazonia, J. Hydrol., 32, 30–45, 1994.
Filoso, S., Williams, M. R., and Melack, J. M.: Compostion an deposition of throughfall in a flooded forest archipelago (Negro River, Bazil), Biogeochem. 45, 169–195, 1999.
Ford, E. and Deans, J.: The effects of canopy structure on stem-flow, throughfall and interception loss in a young Sitka spruce plantation, J. Appl. Ecol., 15, 905–917, 1978.
Gash, J. H. C.: An analytical model of rainfall interception by forests, Q. J. Roy. Meteo. Soc., 105, 43–55, 1979.
Gash, J. H. C. and Morton, A. J.: An application of the Rutter Model to the estimation of the Interception Loss from Thetford Forest, J. Hydrol., 38, 49–58, 1978.
Gash, J. H. C., Lloyd, C. R., and Lachaud, G.: Estimating sparse forest rainfall interception with an analytical model, J. Hydrol., 170, 79–86, 1995.
Hall, R.: Interception loss as a function of rainfall and forest types: stochastic modelling for tropical canopies revisited, J. Hydrol., 280, 1–12, 2003.
Hanchi, A. and Rapp, M.: Stemflow determination in forest stands, Forest Ecol. Manag., 97, 231–235, 1997.
Helvey, J. D. and Patric, J. H.: Design criteria for interception stud-ies, Int. Assoc. Hydrol. Sci. Bull., 67, 131–137, 1965.
Herwitz, S. A.: Raindrop impact and water flow on the vegetative surfaces of trees and the effects on stemflow and throughfall gen-eration, Earth Surf. Proc. Land., 12, 425–432, 1987.
Herwitz, S. R. and Slye, R. E.: Spatial variability in the interception of inclined rainfall by a tropical rainforest canopy, Selbyana 13, 62–71, 1992.
Hoaglin, D. C., Mosteller, F., and Tukey, J.: Understanding Robust and Exploratory Data Analysis, Wiley, New York, 2000. Holder, C. D.: Rainfall interception and fog precipitation in a
trop-ical montane cloud forest of Guatemala, Forest Ecol. Manag., 190, 373–384, 2004.
Huber, A. and Iroume, A.: Variability of annual rainfall partitioning for different sites and forest covers in Chile, J. Hydrol., 248, 78– 92, 2001.
Isotta, C. A. L., Carneiro, J. M., Kato, H. T., and Barros, R. J. L.: Projeto Prov´ıncia Estan´ıfera de Rondˆonia, in: Porto Velho: DNPM/CPRM, 1978.
Jackson, I. J.: Problems of throughfall and interception assessment under tropical forest, J. Hydrol., 12, 234–254, 1971.
Jackson, I. J.: Relationships between rainfall parameters and inter-ception by tropical rainforest, J. Hydrol., 24, 215–238, 1975. Jetten, V. G.: Interception of tropical rainforest: performance of
a canopy water balance model, Hydrol. Process., 10, 671–685, 1996.
Jordan, C. F.: Stem flow and nutrient transfer in a tropical rain for-est, Oikos, 31, 257–263, 1978.
Kahn, F. and Granville, J.-J. d.: Palms in Forest Ecosystems of Amazonia, Springer, Berlin, 1992.
Keim, R. F., Skaugset, A. E., and Weiler, M.: Temporal Persis-tence of Spatial Patterns in Throughfall, J. Hydrol. 314, 263–274, 2005.
Leal, J. W. L., Silva, G. H., dos Santos, D. B., Texeira, W., Lima, M. I. C., Fernandes, C. A. C., and Pinto, A. d. C.: Geologia – Folha SC. 20, in: Projeto Radambrasil, Porto Velho, 219–355, 1978. Leyton, L., Reynolds, E. R. C., and Thompson, F. B.: Rainfall
inter-ception in forest and moorland, in: Forest hydrology: proceed-ings of a national science foundation advanced science seminar, edited by: Sopper, W. E. and Lull, H. W., Oxford, Pergamon Press, 163–178, 1967.
Link, T. E., Unsworth, M., and Danny, M.: The dynamics of rain-fall interception by a seasonal temperate rainforest, Agr. Forest Meteorol., 124, 171–191, 2004.
Liu, W. Y., Fox, J. E. D., and Xu, Z. F.: Nutrient budget of a mon-tane evergreen broad-leaved forest at Ailao Mountain National Nature Reserve, Yunnan, southwest China, Hydrol. Process., 17, 1119–1134, 2003.
Lloyd, C. R. and Marques, A. O.: Spatial variability of through-fall and stemflow measurements in Amazonian rainforest, Agr. Forest Meteorol., 42, 63–73, 1988.
Lloyd, C. R., Gash, J. H. C., Shuttleworth, W. J., and Marques, F. A. O.: The measurement and modelling of rainfall interception by Amazonian rain forest, Agr. Forest Meteorol., 42, 277–294, 1988.
Loescher, H. W., Powers, J. S., and Oberbauer, S. F.: Spatial vari-ation of throughfall volume in an old-growth tropical wet forest, Costa Rica, J. Trop. Ecol., 18, 397–407, 2002.
Lorenzi, H.: Brazilian Trees: A Guide to the Identification and Cultivation of Brazilian Native Trees, Instituto Plantarum, Nova Odessa, SP, 2002.
Manfroi, O. J., Koichiro, K., Nobuaki, T., Masakazu, S., Nakagawa, M., Nakashizuka, T., and Chong, L.: The stemflow of trees in a Bornean lowland tropical forest, Hydrol. Process., 18, 2455– 2474, 2004.
Munishi, P. K. T. and Shear, T. H.: Rainfall interception and parti-tioning in afromontane rain forests of the Eastern Arc Mountains,
Tanzania: Implications for water conservation, J. Trop. For. Sci., 17, 355–365, 2005.
Peixoto de Melo, D., da Costa, R. C., and Natali Filho, T.: Geomor-fologia – Folha SC. 20, in: Projeto Radambrasil, Porto Velho, 187–250, 1978.
Pequeno, P. L. d. L., Vieira, A. H., and Martins, E. P.: Des-matamento e biodiversidade – uma pequena vis˜ao do estado de Rondˆonia, on: http://www.arvore.com.br/artigos/htm 2002/ ar2208 2.htm, 2002.
Roberts, J. M., Cabral, O. M. R., Costa, J. P. R., McWilliam, A.-L. C., and S´a, T. D. A.: An overview of the leaf area index and physiological measurements during ABRACOS, in: Amazonian Deforestation and Climate, edited by: Gash, J. H. C., Nobre, C. A., Roberts, D. A., and Victoria, R. L., Chichester, Wiley & Sons Ltd, 287–306, 1996.
Rowe, L. K.: Rainfall interception by an evergreen beech forest, Nelson, New Zealand, J. Hydrol., 66, 143–158, 1983.
Rutter, A. J., Kershaw, K. A., Robins, P. C., Morton, J.: A predic-tive model of rainfall interception in forests: I. Derivation of the model from observations in a plantation of Corsican pine, Agr. Forest Meteorol., 9, 367–380, 1971.
Sachs, L.: Applied statistics: a handbook of techniques, Springer, New York, 1984.
Savenije, H. H.: The importance of interception and why we should delete the term evapotranspiration from our vocabulary, Hydrol. Process., 18, 1507–1511, 2004.
Shapiro, S. S. and Wilk, M. B.: An analysis of variance test for normality (complete samples), Biometrika, 52:, 591–611, 1965. Schellekens, J., Scatena, F. N., Bruijnzeel, L. A., and Wickel, A. J.:
Modelling rainfall interception by a lowland tropical rain forest in northeastern Puerto Rico, J. Hydrol., 225, 168–184, 1999. Schroth, G., Da Silva, L. F., Wolf, M.-A., Teixeira, W. G., and
Zech, W.: Distribution of throughfall and stemflow in multi-strata agroforestry, perennial monoculture, fallow and primary forest in central Amazonia, Brazil, Hydrol. Process., 13, 1423– 1436, 1999.
Sinun, W., Meng, W. W., Douglas, I., and Spencer, T.: Throughfall, stemflow, overland flow and throughflow in the Ula Segama rain forest, Sabah, Malaysia, Philosophical Transactions of the Royal Society, Series B, 335, 389–395, 1992.
Soil Survey Staff: Soil Taxonomy – A Basic Sysstem of Soil Clas-sification for Making and Interpreting Soil Surveys, US Govern-ment Printing Office, Washington, DC, 1999.
Tob´on Marin, C., Bouten, W., and Sevink, J.: Gross rainfall and its partitioning into throughfall, stemflow and evaporation of inter-cepted water in four forest ecosystems in western Amazonia, J. Hydrol., 237, 40–57, 2000.
Ubarana, V. N.: Observations and modelling of rainfall interception at two experimental sites in Amazonia, in: Amazonian Defor-estation and Climate, edited by: Gash, J. H. C., Nobre, C. A., Roberts, D. A., and Victoria, R. L., Chichester, Wiley & Sons Ltd, 151–162, 1996.
Xiao, Q., McPherson, E. G., Ustin, S. L., and Grismer, M. E.: A new approach to modeling tree rainfall interception, J. Geophys. Res., 105, 173–188, 2000.