HAL Id: hal-00299518
https://hal.archives-ouvertes.fr/hal-00299518
Submitted on 8 May 2008
HAL is a multi-disciplinary open access
archive for the deposit and dissemination of
sci-entific research documents, whether they are
pub-lished or not. The documents may come from
teaching and research institutions in France or
abroad, or from public or private research centers.
L’archive ouverte pluridisciplinaire HAL, est
destinée au dépôt et à la diffusion de documents
scientifiques de niveau recherche, publiés ou non,
émanant des établissements d’enseignement et de
recherche français ou étrangers, des laboratoires
publics ou privés.
using dendrochronology: the Cerro Ventana event in
Northern Patagonia, Argentina
A. Casteller, M. Christen, R. Villalba, H. Martínez, V. Stöckli, J. C. Leiva, P.
Bartelt
To cite this version:
A. Casteller, M. Christen, R. Villalba, H. Martínez, V. Stöckli, et al.. Validating numerical
simula-tions of snow avalanches using dendrochronology: the Cerro Ventana event in Northern Patagonia,
Argentina. Natural Hazards and Earth System Science, Copernicus Publications on behalf of the
European Geosciences Union, 2008, 8 (3), pp.433-443. �hal-00299518�
www.nat-hazards-earth-syst-sci.net/8/433/2008/ © Author(s) 2008. This work is licensed under a Creative Commons License.
and Earth
System Sciences
Validating numerical simulations of snow avalanches using
dendrochronology: the Cerro Ventana event in Northern Patagonia,
Argentina
A. Casteller1,2, M. Christen2, R. Villalba1, H. Mart´ınez3, V. St¨ockli2, J. C. Leiva1, and P. Bartelt2
1Instituto Argentino de Nivolog´ıa, Glaciolog´ıa y Ciencias Ambientales IANIGLA, CCT Mendoza, CONICET, C.C. 330,
5500 Mendoza, Argentina
2WSL, Swiss Federal Institute for Snow and Avalanche Research SLF, Fl¨uelastrasse 11, CH-7260 Davos Dorf, Switzerland 3IDEPRN, Facultad de Ingenier´ıa UNCuyo, CONICET, C.C. 405, 5500 Mendoza, Argentina
Received: 6 December 2007 – Revised: 24 April 2008 – Accepted: 24 April 2008 – Published: 8 May 2008
Abstract. The damage caused by snow avalanches to prop-erty and human lives is underestimated in many regions around the world, especially where this natural hazard re-mains poorly documented. One such region is the Argen-tinean Andes, where numerous settlements are threatened al-most every winter by large snow avalanches. On 1 Septem-ber 2002, the largest tragedy in the history of Argentinean mountaineering took place at Cerro Ventana, Northern Patag-onia: nine persons were killed and seven others injured by a snow avalanche. In this paper, we combine both numerical modeling and dendrochronological investigations to recon-struct this event. Using information released by local gov-ernmental authorities and compiled in the field, the avalanche event was numerically simulated using the avalanche dynam-ics programs AVAL-1D and RAMMS. Avalanche character-istics, such as extent and date were determined using den-drochronological techniques. Model simulation results were compared with documentary and tree-ring evidences for the 2002 event. Our results show a good agreement between the simulated projection of the avalanche and its reconstructed extent using tree-ring records. Differences between the ob-served and the simulated avalanche, principally related to the snow height deposition in the run-out zone, are mostly at-tributed to the low resolution of the digital elevation model used to represent the valley topography. The main contribu-tions of this study are (1) to provide the first calibration of numerical avalanche models for the Patagonian Andes and (2) to highlight the potential of Nothofagus pumilio tree-ring
Correspondence to: A. Casteller
records to reconstruct past snow-avalanche events in time and space. Future research should focus on testing this combined approach in other forested regions of the Andes.
1 Introduction
In Argentina and other countries located in middle to high latitudes in the Southern Hemisphere, the risk associated with snow avalanches in mountainous regions is highly sig-nificant; however, avalanche hazard maps are rare. A few ski resorts and heavily-traveled mountain passes are exceptions to this rule (Leiva and Mart´ınez, 1998, 2006). Three main factors explain this lack of avalanche hazard assessments: (1) few or incomplete avalanche cadastres; (2) scarce, fragmen-tary and non-homogeneous weather and snow accumulation records (Masiokas et al., 2006); and (3) avalanche dynamics calculations have seldom been used to predict hazard zones.
One way to circumvent the uncertainty of avalanche haz-ard zones is to apply numerical models to predict avalanche runout. Numerical avalanche models developed in Europe, such as AVAL-1D and RAMMS, are currently being tested in key sites in the Andes (Leiva et al., 2007, 2008). How-ever, their final implementation is hampered by the scarcity of calibration data. In addition to the crucial step of ac-curately identifying avalanche release areas (Maggioni and Gruber, 2003), friction parameters used by the models must be adjusted to local terrain and snow conditions (Furdada et al., 2002). This calibration process can be conducted re-gionally by simulating snow-avalanche events for which the location and dimension of the release area are known and
Studied avalanche track Cerro Ventana (1910 m a.s.l.) N
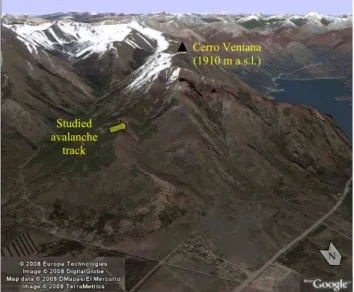
Fig. 1. Three dimensional satellite image of the study site at Cerro
Ventana, in the vicinity of the city of San Carlos de Bariloche, R´ıo Negro. The yellow arrow indicates the investigated avalanche track. Image source: Google Earth (permission request # 242431704).
the exact position of the run-out zone has been determined. However, this information is generally missing for the An-des. One possibility for overcoming this problem is to apply dendrochronological methods.
Dendrochronology is a powerful tool for reconstruct-ing the past occurrence of natural hazards, such as snow avalanches (e.g. Burrows and Burrows, 1976; Carrara, 1979), debris flows (e.g. Hupp, 1984; Bollschweiler et al., 2007) and rockfall activity (e.g. Butler et al., 1986; Stoffel et al., 2005). Tree-ring based records of past avalanche activity extend in many cases for several centuries and have annual resolution. These dendrochronological archives are very useful for es-tablishing avalanche chronologies in undocumented areas or to complement chronologies in areas with short or fragmen-tary records.
In this study we couple numerical models and den-drochronological analyses in order to reconstruct the avalanche event related to the largest tragedy in the history of Argentinean mountaineering: on 1 September 2002, nine people were killed and seven injured when a large snow avalanche released at Cerro Ventana, near the city of San Carlos de Bariloche. A detailed study of the event was conducted by local governmental authorities to identify the causes of the accident. As a result, an accurate determina-tion of the locadetermina-tion and size of the avalanche release area, the height of the snow removed at several points across the release area, and the length and width of the entire avalanche were documented. Daily records of temperature and precip-itation, together with snow-profile data, were obtained from a nearby ski resort for the days immediately before and after the event. This information, which is required for running
Month J F M A M J J A S O N D M e a n mo n th ly p re ci p it a ti o n ( m m ) 0 20 40 60 80 100 120 140 160 180 Me a n mo n th ly te m p e ra tu e ( °C ) 0 2 4 6 8 10 12 14 16
Fig. 2. Mean monthly precipitation (1984–2001) and mean monthly
temperature (1984–2000), measured in the city of San Carlos de Bariloche, 7.9 km northeast of the study area. Source: Instituto
Na-cional de Tecnolog´ıa Agropecuaria.
numerical avalanche simulations, is not available for most events recorded along the Andes.
In addition, the avalanche track is partly forested by
Nothofagus pumilio trees, which allowed us to recover
complementary spatial and temporal information regarding avalanche activity at the site based on different tree-ring in-dicators, including: (a) scars, (b) abrupt growth changes, (c) eccentricity variations in the wood and (d) tree mortality. Documentary and dendrochronological evidences were used in combination to adjust the friction coefficients applied in the numerical avalanche simulations, thus validating for the first time avalanche models in the Patagonian Andes. More-over, the opportunity to test different sampling strategies and tree-ring indicators of Nothofagus pumilio in an avalanche-documented site allowed us to prove the potential of this tree species for reconstructing past avalanche events.
2 Study area
The studied avalanche track is located on the southeast-facing slope of Cerro Ventana (also known as Cerro de la
Ventana; 1910 m a.s.l.), 7.9 km southeast from the city of
San Carlos de Bariloche, R´ıo Negro, Argentina (Fig. 1). The site (41◦12′36′′S, 71◦22′32′′W) is 20 km west of the
forest-steppe ecotone and 43 km east of the continental di-vide, which in this sector of the Andes is coincident with the border between Argentina and Chile.
Total annual precipitation (1984–2001) and mean annual temperature (1984–2000), both measured by the Instituto
Nacional de Tecnolog´ıa Agropecuaria in San Carlos de
Bar-iloche, are 801 mm and 8.5◦C, respectively (Fig. 2).
Sixty-two percent of the total precipitation occurs between May and August; at elevations above 1000–1100 m this precipita-tion typically occurs as snow.
Austrocedrus chilensis (D. Don) Pic. Sern. et Bizzarri
is the dominant tree species at lower-elevations in the Cerro Ventana. Further up on the slopes, Nothofagus antarctica (G. Forster) Oerst. and particularly Nothofagus pumilio (Poepp. et Endl.) Krasser dominate. At the avalanche
run-out area and especially within the margins of the veg-etated avalanche track, N. pumilio becomes the dominant or even exclusive tree species. The treeline at Cerro Ven-tana is located at approximately 1800 m. According to Holtmeier (1973) and Norton and Sch¨onenberger (1984),
Nothofagus trees exists close to treeline in a small, stunted,
krummholz-type form.
Concerning the geology, the Cerro Ventana corresponds structurally to an Oligocene folding (Paleogene period, Cenozoic), where the Ventana formation outcrops. This for-mation is composed of lavas and andesitic, rhyolitic and basaltic pyroclastic rocks. Marine and continental conglom-erates and sandstones containing invertebrate and plant fos-sils are also present in the local stratigraphy.
The avalanche track at the release area has a slope an-gle of 39.7◦, which is well-within the 28◦–50◦slope-angle
range that defines a potential avalanche release zone (Perla and Martinelli, 1978; Salm, 1982). The mean slope angles measured along the avalanche track and at the run-out zone are 23◦ and 19◦, respectively. Another small release area,
which flows into the same corridor, is located to the east of our zone (Fig. 3). However, as no historical records exist for past avalanches in this area, our research focuses on the west-ernmost release zone. The tragic 2002 avalanche released 120 m below the summit of Cerro Ventana. According to an evaluation committee composed of local governmental au-thorities and several avalanche experts (Bustos et al., 2003), the avalanche was triggered by overburden on a wet slab of snow. The avalanche incorporated the hikers in the flow and transported them approximately 450 m into a narrow corri-dor. Field observations provided by members of the rescue team indicated that the amount of snow deposited in the run-out zone of the avalanche reached 7 m.
The climatic conditions of the days preceding the 2002 avalanche are crucial for understanding the causes of the event. First, precipitation in the form of rain occurred at high altitudes (i.e. above 2000 m) two days before the ac-cident. Second, air temperatures measured at the elevation of the release area remained above 0◦C during 50 consecutive
hours prior to the accident. Together, these factors resulted in a highly unstable snow pack. Snow profiles conducted at 1600 m (31 August) and 1980 m (5 September) at the Cerro Catedral ski resort indicate the presence of a weak snow layer 40 cm below the surface and a crust within the first few cen-timeters of the surface, further confirming the instability of the snow pack prior to the event.
3 Material and methods
3.1 Dendrochronological sampling procedures
To test the utility of N. pumilio for reconstructing the 2002 Cerro Ventana event we sampled seven trees exhibiting clear evidence of past avalanche disturbance, such as broken
a b
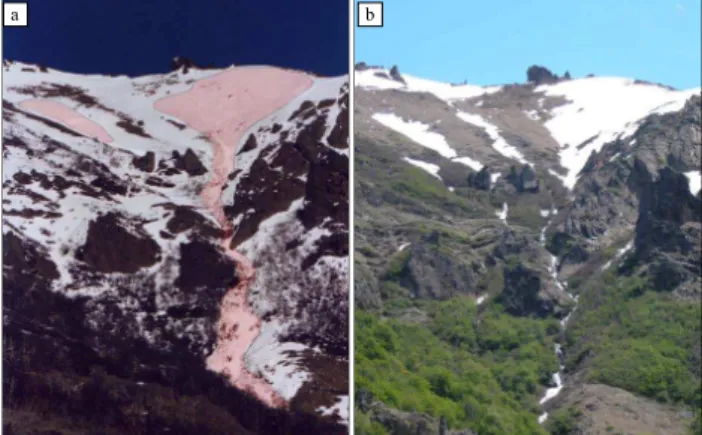
Fig. 3. Photographs of the studied avalanche track taken (a) in
September 2002 a few days after the event and (b) in November 2005, when most of the dendroecological sampling was carried out. In photograph a) the area affected by the studied avalanche has been demarcated. To the left-hand side in the same image, another avalanche released spontaneously almost at the same time as the main avalanche, but did not reach the channeled sector of the track.
branches and scarred trunks, in March 2004. We revisited the site in November 2005 and sampled 32 additional trees lo-cated in several sectors of the avalanche track using two dif-ferent sampling strategies. First, we sampled trees with clear external evidence of past avalanches along the track (“selec-tive sampling”), which allowed us to capture as much den-drochronological information as possible about recent and past avalanche events (Table 1). Second, we sampled all trees, regardless of their condition, in a rectangular plot per-pendicular to the run-out zone of the 2002 event (“plot sam-pling”), which permitted us to determine both the proportion of trees growing in a particular area containing evidence of past events and the variation in damage intensity along the sampling plot. We did not sample trees above the run-out area of the 2002 event as we only found very young trees, most of which were distant from the avalanche track. The sampling sectors included the track and borders of the 2002 event (at the altitude of the run-out area), a section of the valley below the 2002 event run-out area, and a control area approximately 150 m east of the avalanche track (Table 1). The control area has an aspect, altitude and steepness similar to that of the run-out zone of the avalanche, but exhibits no signs of disturbance. A diagram of the avalanche track, in-cluding the accumulation (or release), transition and run-out zones, is provided in Fig. 4.
3.2 Dendrochronological analyses
All samples were prepared following standard den-drochronological techniques (Stokes and Smiley, 1968). With the exception of the increment cores taken from the control area, cross sections were collected along the track as they provide a more accurate and complete record of past
Table 1. Nothofagus pumilio trees sampled at Cerro Ventana. Two sampling designs were used: “selective sampling” and “plot sampling”,
and both designs included sectors of the track and borders of the avalanche. A control area located approximately 150 m east of the avalanche track, which has an aspect, altitude and steepness similar to that of the studied avalanche track was also studied.
Sampling design Sector Number of trees sampled Dead trees Cross sections Increment cores
Selective sampling track 12 0 13 0
border 3 0 4 0
Plot sampling track 18 4 21 0
border 6 0 9 0
– control 11 0 0 22
Total 50 4 47 22
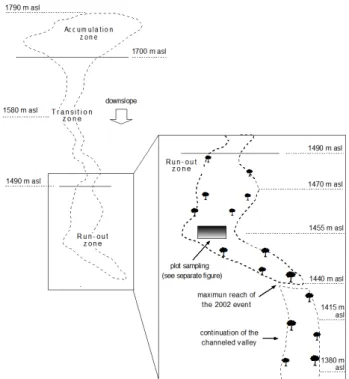
Fig. 4. Scheme of the studied avalanche track at Cerro Ventana.
The contour line of the avalanche was established from a 2-D digi-talization of the affected area, as documented in a photograph taken one day after the event (Fig. 3a). The sampling procedure was con-ducted in the run-out zone of the 2002 event and in a section of the valley downslope. Two sampling designs were used: “selective sampling” and “plot sampling”.
avalanche events (Carrara, 1979; Casteller et al., 2007). Sam-ples were dated following Schulman’s (1956) convention for the Southern Hemisphere, assigning to each tree ring the year in which radial growth started. On each cross section, a total of four radii were measured: one in the upslope direction, one in the downslope direction and two opposite radii per-pendicular to the slope. Tree-ring widths were measured to the nearest 0.01 mm. Individual tree-ring series were cross-dated against a master chronology developed from trees in
the control area. To detect dating errors (i.e. missing or false rings) the cross-dating quality was evaluated using the pro-gram COFECHA (Holmes, 1983) and the graphical function of the program TSAP-Win (Rinn, 1996). The master tree-ring chronology from the control sector was developed using the program ARSTAN (Cook, 1985).
For each cross-dated sample we assessed: (1) the years for exposed and hidden (i.e. overgrown by the stem) scar for-mations (e.g. Mears, 1975; Dub´e et al., 2004), (2) abrupt growth changes (e.g. Butler, 1985; Rayback, 1998) and (3) changes in eccentricity (e.g. Schweingruber, 1996; Casteller et al., 2007). We calculated abrupt growth changes with the program IMPACT (Grissino-Mayer et al., 1997), which uses tree-ring measurement series to compare mean growth be-fore and after a disturbance. We selected a time span start-ing three years before and endstart-ing two years after the event. The changes in radial tree growth that we used as thresholds to define positive and negative abrupt growth changes were 200% and 30%, respectively. Changes in eccentricity were calculated using the annual eccentricity index (Iex; Schwein-gruber, 1996), using a threshold of 100% to define significant values.
Iex = tree − ring widths upslope side tree − ring widths downslope side 3.3 Avalanche simulations
We used the numerical avalanche dynamics models AVAL-1D (Bartelt et al., 1999; Christen et al., 2002) and RAMMS (Christen et al., 2005; Christen et al., 2007; Gruber and Bartelt, 2007) to simulate the 2002 Cerro Ventana avalanche event. AVAL-1D is a one-dimensional, well-calibrated, and state-of-the-art tool in avalanche hazard mapping that tracks the motion of an avalanche from initiation to runout. The track profile and the flow width must be specified. RAMMS (Rapid Mass Movements) is a two-dimensional model that simulates avalanche motion in complex three-dimensional terrain. Unlike AVAL-1D, the flow width in RAMMS is not specified, but determined by the model. Therefore, it is especially valuable in non-canalized terrain, where the pre-definition of the flow width is difficult to determine. In order
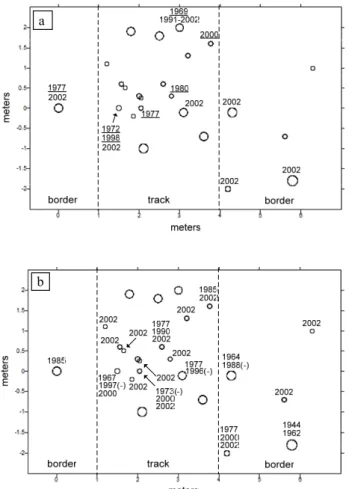
a
b
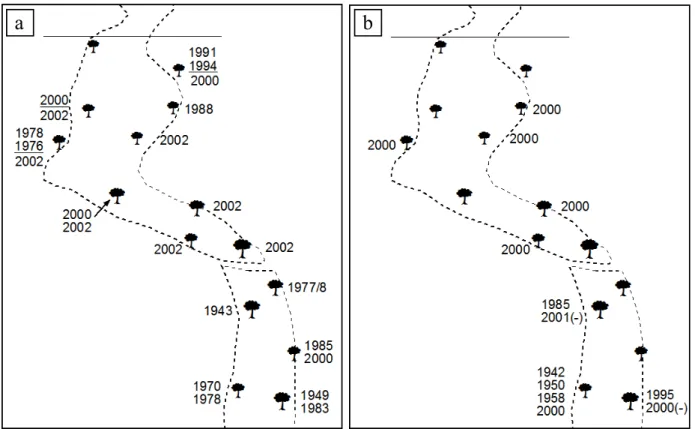
Fig. 5. Detail of the run-out zone of the 2002 avalanche event and a section of the valley downslope (see Fig. 4), in which the spatial
distribution of the sampled trees is shown. Figure (a) indicates for each tree the years with scars and eccentricity variations (the latter underlined), whereas figure (b) shows the years with positive and negative (the latter indicated with a minus sign) abrupt growth changes.
Table 2. Changes in radial growth for selected trees in the track and borders of the sampling plot. The calculations were done with the
program IMPACT using time spans starting three years before and ending two years after the 2002 event. The orientation of each analyzed radius in relation to the slope is indicated.
Plot sector Sample code Growth variation (%) Radius orientation Observations Border ve01 37,7 Downslope branch
Track
ve07 464,7 Side ve08 529,8 Side
ve11 633,9 Side branch ve12 461,6 Upslope ve13 380,1 Side ve17 14,9 Side ve20 445,8 Side Border ve21 469,1 Side ve22 95,7 Side ve22b 444,6 Side
to take advantage of the strengths of both numerical models (one-dimensional and two-dimensional), we simulated the Cerro Ventana event using both AVAL-1D and RAMMS.
AVAL-1D predicts run-out distances, flow velocities and impact pressures of both flowing and powder snow
avalanches at every point of a specified avalanche track. The flowing avalanche model solves a system of differential equa-tions, describing the depth-averaged conservation of mass and momentum equations using an upwinded finite differ-ence scheme (Sartoris and Bartelt, 2000). The flow rheology
a
b
Fig. 6. Spatial distribution of the trees sampled in the plot (see
Fig. 4). Figure (a) shows the years with scars and eccentricity vari-ations (the latter underlined), whereas figure (b) indicates the years with positive and negative (the latter indicated with a minus sign) abrupt growth changes for each tree. The symbols for the trees are proportional to the diameter of the trunks at their base.
is a hydraulics-based model and divides avalanche frictional resistance into a dry Coulomb-type friction µ and a viscous resistance ξ , which varies with the square of the flow ve-locity. The model has been adjusted using forest parameters identified by Bartelt and St¨ockli (2001), who showed how the dry Coulomb and viscous friction varied as a function of avalanche size and forest interaction mechanisms (branch bending, trunk fracture and tree uprooting). Required input parameters for AVAL-1D are: (1) distance-altitude (x − y) profile of the avalanche path, (2) avalanche width along the path, (3) release area and release height, and (4) friction pa-rameters. The area and mean altitude values of the release area were 17 100 m2and 1715 m a.s.l., respectively, and the observed snow height was 0.6 m. The width of the avalanche was estimated from site observations. The friction parame-ters µ and ξ were chosen according to the Swiss Guidelines (Salm et al., 1990) for wet snow avalanches, but then modi-fied to account for forest interaction. The software package
RAMMS combines three-dimensional process modules for snow avalanches, debris flows and rockfalls with protection and visualization modules. Because the system is linked to a GIS environment, RAMMS is a powerful tool for hazard mitigation studies in mountainous regions that are affected by gravity driven, rapid mass movements. The avalanche module predicts avalanche run-out distances, flow velocities and impact pressures in general three-dimensional terrain us-ing a finite volume scheme to solve the shallow water equa-tions. Required input parameters for RAMMS are: (1) a dig-ital elevation model (DEM), (2) information about size, loca-tion and snow height of the release area, (3) fricloca-tion parame-ters, and (4) a geo-referenced map or aerial photo to overlay the DEM. The simulations with RAMMS were based on a 30 m digital terrain model generated from ASTER satellite data. An accurate estimation of the size and location of the avalanche release area, which is critical for a good simula-tion, was achieved by (1) interpreting photographs taken a few days after the September 2002 event, and (2) from DEM and satellite images interpretations. A polygon shape file of the release area was created using GIS software. The same value of 0.6 m was used as release height. Different friction parameter combinations were analyzed to find a best fit for the Cerro Ventana event.
4 Results
4.1 Dendrochronological approach
4.1.1 Selective sampling of avalanche-impacted trees along the track
We found tree-ring evidence of the 2002 Cerro Ventana event on seven out of the ten trees sampled along the run-out zone of the avalanche (Fig. 5). In all cases, the evidence was in the form of scars; we did not observe eccentricity variations or abrupt growth changes (AGC) in these trees related to the 2002 event. As was expected, no dendrochronological evi-dence of the 2002 event was recorded below its lower altitu-dinal limit of 1440 m (Fig. 4). Tree-ring evidences consider-ing all fifteen sampled trees along the track suggest the oc-currence of avalanches prior to year 2002. In particular, clear signs of avalanche disturbance were recorded for the year 2000 consisting of three scars, a marked change in eccen-tricity and seven AGC (both positive and negative; Fig. 5). Other years with less frequent avalanche indicators are 1943, 1949, 1978, 1985 and 1991. The trees recording avalanche activities during these years are distributed at altitudinal lev-els ranging from 1380 m to 1490 m a.s.l. (Fig. 4).
4.1.2 Plot sampling perpendicular to the avalanche track Tree-ring evidences of the 2002 avalanche event were recorded in nineteen out of the twenty-four sampled trees: seven trees had scars and thirteen exhibited positive AGC.
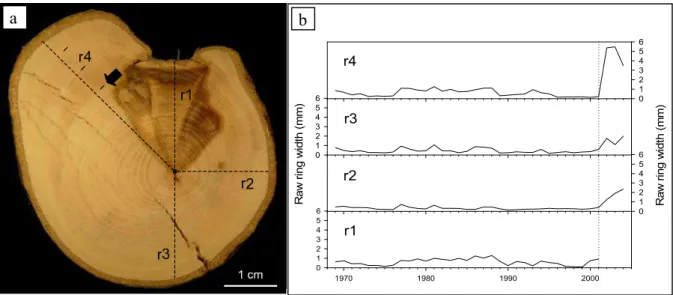
a
r1 1970 1980 1990 2000 0 1 2 3 4 5 6 R a w r in g w id th ( m m ) 0 1 2 3 4 5 6 R a w r in g w id th ( mm) 0 1 2 3 4 5 6 0 1 2 3 4 5 6 r2 r3 r4b
Fig. 7. (a) Cross section of N. pumilio showing evidence of the 2002 avalanche event. Four radii were measured: r1 is oriented upslope, r3
is oriented downslope, and r2 and r4 are oriented to each side. In figure (b) the ring widths of the four radii are displayed. The last year of undisturbed growth is 2001 (dotted line). The scar occurring in 2002 caused a growth termination on r1 and subsequent abrupt growth changes on the rest of the radii.
Table 3. Input parameters and results of the AVAL-1D simulations. The observed values of the 2002 event are provided at the base of the
table for comparison.
Simulation Release height (m), Max height Max velocity Stopping altitude Mass above
µand ξ (ms−2) (m) (ms−1) (m a.s.l.) 1440 m a.s.l. (%)
1 0.6/ 0.42/400 3.20 9.45 1436 87 2 0.6/0.42/700 2.95 12.40 1420 75 3 0.6/0.42/1000 2.50 14.70 1407 64 4 0.6/0.44/400 3.35 9.20 1443 93 5 0.6/0.44/700 3.15 12.10 1427 85 6 0.6/0.44/1000 2.80 14.35 1419 75 7 0.6/0.47/400 3.30 8.90 1451 96 8 0.6/0.47/700 3.20 11.65 1440 92 9 0.6/0.47/1000 3.00 13.80 1432 87 10 1.85/0.47/700 6.40 18.40 1395 65 11 1.85/0.47/400 6.15 14.50 1415 79 Observed values Release height 0.6 m 7.0 – 1440 100
One individual exhibited both types of disturbance (Fig. 6). Variations in eccentricity related to the 2002 event were not observed. Four of the five trees that did not exhibit any of the above-mentioned tree-ring indicators died in 2002 (Table 1). In relation to the spatial distribution of evidences in the plot, scars were recorded in both the track and borders (Fig. 6a), whereas AGC were more common in the track as compared to the borders (Fig. 6b). Eccentricity varia-tions, scars and AGC suggesting previous avalanche events are concentrated in the years 1977, 1985, 1991 and 2000.
Changes in radial growth following the 2002 event var-ied considerably both among trees as well as within radii of
individual trees. Some radii reached positive AGC of over 600%, whereas others had values below 15% (Table 2). As observed in Fig. 7, the growth termination of the radius ori-ented upslope due to a scar in 2002 hinders the evaluation of changes in stem eccentricity associated with this event. However, marked changes in radial growth on the radii not affected by the scar make AGC more conspicuous.
Fig. 8. Numerical simulations carried out with the program
AVAL-1D for the 2002 Cerro Ventana event. Maximal flow heights and runouts for simulations 7, 8 and 11 are shown. The red arrow de-picts the runout distance of the observed event.
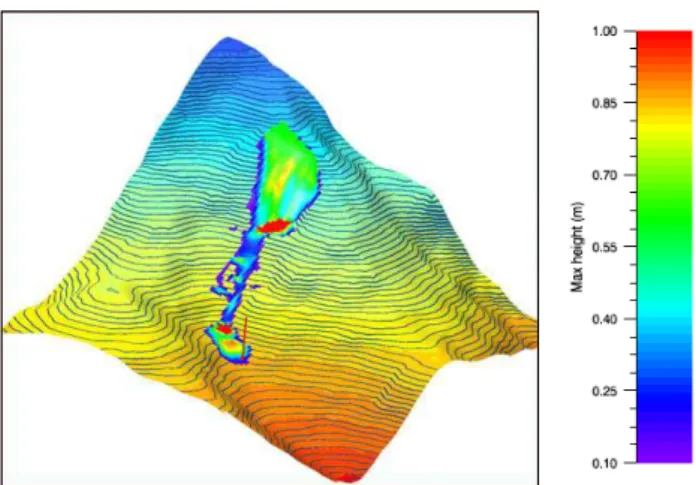
Fig. 9. Cerro Ventana topography displayed in RAMMS showing
the maximum flow height of simulation 3. A coloured contour line image is mapped over the surface. The red arrow shows the runout distance of the observed avalanche, which is coincident with the simulated value.
4.2 Avalanche simulations 4.2.1 AVAL-1D
The Cerro Ventana avalanche is estimated to have a release volume of slightly over 10 000 m3. In the simulations a frac-ture height of 0.6 m was employed, providing volumes simi-lar to the observed ones (simulation volume 10 300 m3). Sev-eral simulations with different friction parameter combina-tions were performed using this starting volume. Values of
µ=0.42, 0.44 and 0.47 were used for the dry friction coeffi-cient; values of ξ =400, 700 and 1000 ms−2 for the viscous
friction coefficient (Table 3). These values are typical for small avalanches (volumes less than or equal to 10 000 m3)
such as the 2002 Cerro Ventana event. The track width at the run-out zone of the simulated event was 25 m, correspond-ing to the observations. The projected length of the simu-lated avalanches and their altitudinal difference between run-out and release area were approximately 600 m and 350 m, respectively (Fig. 8). Both values agree well with those recorded for the documented event in 2002. Because no ve-locity observations are available, the simulation results were compared with the avalanche event by looking at the deposi-tion heights and the runout distance.
Simulations 4, 7 and 8 took into account a release height of 0.6 m and yielded the best results in relation to the altitude where the avalanches stopped: 1443 m, 1451 m and 1440 m, respectively (Table 3). Velocities between 8.90 ms−1 and
11.65 ms−1 and flow heights between 3.20 m and 3.35 m
were obtained for these simulations (Table 3). However, the deposition heights are considerably lower than the ob-served value of 7 m. A rough estimation of the overrun area (∼35 000 m2)multiplied by a possible erodible snow height of 0.6 m resulted in an additional eroded volume of 21 000 m3. Simulations 10 and 11 were made with an increased release height of 1.85 m, taking snow erosion into account, resulting in a new total volume of 31 300 m3 (10 300+21 000). Friction parameter combinations of Simu-lations 7 and 8 were used in SimuSimu-lations 10 and 11. The ob-tained deposition height of 6.15 m of Simulation 11, together with a runout altitude of 1415 m a.s.l. are very close to the observed deposition height of 7 m and the runout altitude of 1440 m a.s.l. (Fig. 8).
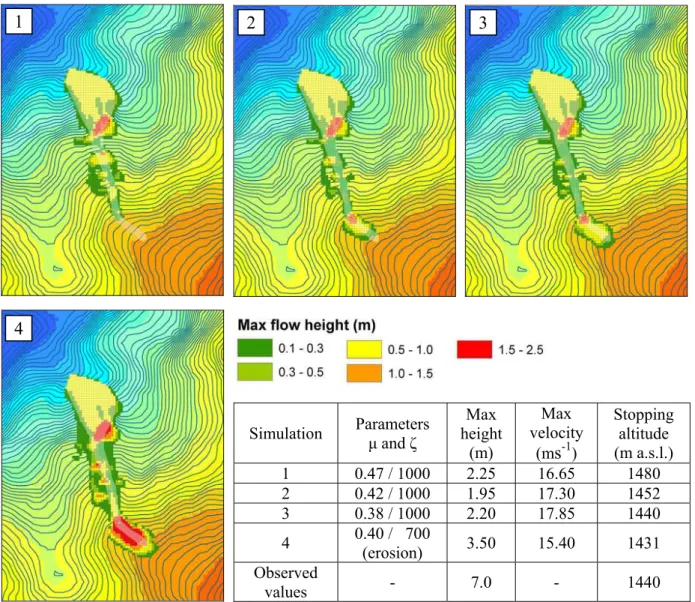
4.2.2 RAMMS
Four simulations were conducted using a release height of 0.6 m (release volume of 10 300 m3)and the following friction coefficients: 1) µ=0.47, ξ =1000 ms−2; 2) µ=0.42,
ξ=1000 ms−2; 3) µ=0.38, ξ =1000 ms−2; and 4) µ=0.40,
ξ=700 ms−2 (Fig. 10). The values for the dry friction
co-efficient µ were chosen according to the AVAL-1D results. Since two-dimensional simulations usually lead to smaller calculated flow heights, the ξ parameter was slightly in-creased as compared to the values used in the AVAL-1D sim-ulations. An erodible snow layer of 0.6 m was incorporated in Simulation 4, which resulted in an additional eroded snow volume of 21 000 m3and therefore in a total avalanche vol-ume of 31 300 m3(see AVAL-1D Simulations 10 and 11 in Sect. 4.2.1).
The results show that the maximum simulated snow heights along the track vary from 1.95 m to 3.5 m, values considerably lower than the observed 7 m. The modelled de-position heights are too small because the flow widths are too large (Fig. 10). The run-out altitude given by the model for Simulation 3 (Fig. 9) is coincident with the observed value of 1440 m and varies 12 m upslope for Simulation 2, and 9 m downslope for Simulation 4. Simulated maximum velocities range from 15.40 ms−1to 17.85 ms−1(Fig. 10); no observed
Simulation
Parameters
μ and ζ
Max
height
(m)
Max
velocity
(m
s
-1)
Stopping
altitude
(m a.s.l.)
1
0.47 / 1000
2.25
16.65
1480
2
0.42 / 1000
1.95
17.30
1452
3
0.38 / 1000
2.20
17.85
1440
4
0.40 / 700
(erosion)
3.50 15.40 1431
Observed
values
- 7.0
-
1440
1
2
3
4
Fig. 10. Numerical simulations carried out with the program RAMMS for the 2002 Cerro Ventana event. Maximal flowheights for
simula-tions 1 to 4 are shown. A colored contour line image is mapped over the surface. The outline of the observed avalanche event is depicted as a semi-transparent polygon.
data on this parameter are available for comparison with the model results. Even with a model that includes snow entrain-ment, it is not possible to correctly simulate the deposition heights of over 7 m with a 30 m DEM.
5 Discussion
The information collected in relation to the 2002 Cerro Ven-tana avalanche allowed us to numerically simulate this event. Input parameters for running model simulations, such as pre-cise location and size of the release area, in addition to its snow height, have rarely been recorded for snow avalanches in the Southern Andes (Leiva et al., 2007). However, this information was available for the Cerro Ventana event and
allowed us to simulate the spatial extent of the avalanche as well as to determine maximal flow heights and veloci-ties along the avalanche track. To validate the results of the numerical models, the maximum extent of the event was in-ferred from dendrochronological methods and the maximal flow height at the run-out zone of the avalanche was deter-mined in-situ. Friction coefficients µ and ξ used by the mod-els AVAL-1D and RAMMS were adjusted by choosing the combination that best fit to the observations. According to the simulations conducted with RAMMS, snow erosion was a significant process in the 2002 event (Sovilla et al., 2006).
In the European Alps, one-dimensional numerical avalanche dynamics models employ well-calibrated fric-tion parameters (Bartelt et al., 1999). Extreme avalanches
use values of µ=0.16 and ξ =3000 ms−2, whereas small,
wet snow avalanches apply higher friction coefficients up to µ=0.43 and ξ =400 ms−2. However, the parameters µ
and ξ also depend on track characteristics such as eleva-tion, roughness and channel geometry, as well as on the avalanche return period and release volume. We applied wet snow friction parameters (AVAL-1D: 0.42<µ<0.47 and 400<ξ <1000 ms−2; RAMMS: 0.38<µ<0.47 and
700<ξ <1000 ms−2)for the Cerro Ventana event. In
com-parison to the friction values applied in the European Alps, the chosen range was therefore in good agreement. Slightly larger µ values were required to model the observed runout distance with AVAL-1D.
The principal limitation for implementing the numerical models was the low resolution of the topographical model (ASTER DEM) available for the region. The low resolu-tion overlooks the topographic features that funneled the avalanche along the narrow path, resulting in a lower sim-ulated snow deposition height at the run-out zone (approxi-mately 3 m) than what was actually recorded (over 7 m). Pre-vious numerical simulations of snow avalanches in the An-des (Furdada et al., 2002) have reported similar problems in relation to DEM resolutions. One possibility to overcome this limitation is to employ topographical models from aerial photographs or high-resolution satellite images, which re-solve surface details less than 10 m in size. The lack of a high resolution DEM hampered the assessment of the lateral spreading of the avalanche in the runout zone.
Our results support the analysis of tree rings from N.
pumilio to precisely date and spatially determine the extent of
past snow avalanches in the Patagonian Andes (Mundo et al., 2007). Selected living trees with visible damage provided the most complete record of past avalanche occurrences as well as the extent of the events along the track. Alternatively, sampling young, relatively-flexible trees in plots perpendic-ular to the track provided avalanche evidence for most of the trees, but mainly for recent events. Trees sampled below the 2002 run-out area preserve more evidence of older avalanche events as compared to trees located above this area, which results from a loss of tree-ring evidence due to the 2002 and previous avalanche events. This lack of information about earlier events has been pointed out in other dendrogeomor-phological studies dealing with snow avalanche reconstruc-tions (Dub´e et al., 2004; Carrara, 1979).
In addition to the 2002 event, we have preliminary evi-dence for avalanche activity at Cerro Ventana in the years 1943, 1949, 1977, 1978, 1985, 1991 and 2000 from den-drochronological evidences. However, due to the limited number of tree-ring indicators in these years, this informa-tion should be regarded cautiously. Only in the year 2000 there is abundant tree-ring evidence to confirm the occur-rence of an avalanche. Information released by a nearby ski resort at Cerro Catedral reported a large slab avalanche in July 2000 (http://cabbat1.cnea.gov.ar/forense/publicaciones/ semin 2001/avalancha.pdf). Due to the proximity between
Cerro Ventana and Cerro Catedral (9.3 km) we consider the occurrence of an avalanche in year 2000 at our study site to be highly possible. Indeed, high snowpack instability was also reported at Cerro Catedral at the time of the 2002 Cerro Ventana avalanche.
Regional-scale hazard mapping is needed to reduce the avalanche-related risk in populated areas of the Andes (Fur-dada et al., 2000). Tree rings and model simulations provide a good combination for reconstructing past avalanche events in forested regions of the Patagonian Andes. In avalanche-prone areas lacking historical records, dendrochronological methods provide a useful technique to validate and ground truth the numerical models. Although the combined appli-cation of both approaches will provide the most consistent reconstructions, studies in Andean regions devoid of trees will rely largely on numerical models (Gruber and Bartelt, 2007). Ultimately, advances in snow avalanche modeling and in tree-ring applications will provide reliable avalanche haz-ard maps for the southern Andes.
Acknowledgements. This research could not have been conducted
without the support of several people. We are especially grateful to mountain guide Damian Yabr´es, Jorge Bagur, Comandante Dar´ıo Altamirano and Professor Maximiliano Schneider, for providing valuable information on the avalanche event at Cerro Ventana. Likewise, we thank the Ente Regulador de Cerro Catedral for the snow profiles and climatic data made available to us. Erin Gleeson is kindly acknowledged for the proof-reading of the paper. We would like to show gratitude to the reviewers for providing very useful comments, which helped us considerably in improving the paper. This research was supported by the Swiss Federal Institute for Snow and Avalanche Research, the Argentinean Agency for the Promotion of Science and Technology (PICTR02-186), and the Projects CRN03 and CRN2047 from the Inter-American Institute for Global Change Research (IAI). The latter project is funded by grant CRN II # 2060, which is supported by the US National Science Foundation (Grant GEO-0452325).
Edited by: M. Bollschweiler
Reviewed by: two anonymous referees
References
Bartelt, P., Salm, B., and Gruber, U.: Calculating dense-snow avalanche runout using a Voellmy-fluid model with ac-tive/passive longitudinal straining, J. Glaciol., 45(150), 242–254, 1999.
Bartelt, P. and St¨ockli, V.: The influence of tree and branch frac-ture, overturning and debris entrainment on snow avalanche flow, Ann. Glaciol., 32, 209–216, 2001.
Bollschweiler, M., Stoffel, M., Ehmisch, M., and Monbaron, M.: Reconstructing spatio-temporal patterns of debris-flow activity using dendrogeomorphological methods, Geomorphology, 87, 337–351, 2007.
Burrows, C. J. and Burrows, V. L.: Procedures for the study of snow avalanche chronology using growth layers of woody plants,
Boulder: University of Colorado, Institute of Arctic and Alpine Research occasional paper, 23, 54 pp., 1976.
Bustos, R. M., De la Cruz, S., Magaldi, D., Mart´ınez, H., Schneider, M.: Peritaje t´ecnico (experts’ testimony), Oral presentation, San Carlos de Bariloche, 2003.
Butler, D. R.: Vegetational and geomorphic change on snow avalanche paths, Glacier National Park, Montana, USA, Great Basin Nat., 45(2), 313–317, 1985.
Butler, D. R., Oelfke, J. G., and Oelfke, L. A.: Historic rockfall avalanches, northeastern Glacier National Park, Montana, USA, Mt. Res. Dev., 6(3), 261–271, 1986.
Carrara, P. E.: The determination of snow avalanche frequency through tree-ring analysis and historical records at Ophir, Col-orado, Geol. Soc. Am. Bull., 90 (8), 773–780, 1979.
Casteller, A., St¨ockli, V., Villalba, R., and Mayer, A. C.: An evalu-ation of Dendroecological Indicators of Snow Avalanches in the Swiss Alps, Arct. Antarct. Alp. Res., 39(2), 218–228, 2007. Christen, M., Bartelt, P., and Gruber, U.: AVAL-1D: An avalanche
dynamics program for the practice, Proceedings of the Inter-national Congress Interpraevent 2002 in the Pacific Rim, Mat-sumoto, Japan, 715–725, 2002.
Christen, M., Bartelt, P., and Gruber, U.: Numerical calculation of snow avalanche runout distances, edited by Soibelman, L. and Pena-Mora, F., Proc. of the 2005 Computing in Civil Engineering International Conference, Cancun, Mexico, 11 pp., 2005. Christen, M., Bartelt, P., and Gruber, U.: Modelling avalanches,
GEOconnexion International Magazine, 6(4), 38–39, 2007. Cook, E. R.: A Time Series Analysis Approach to Tree-Ring
Stan-dardization, Ph.D. Dissertation, Laboratory of Tree-Ring Re-search, University of Arizona, Tucson, 171 pp., 1985.
Dub´e, S., Filion, L., and H´etu, B.: Tree-Ring Reconstruction of High-Magnitude Snow Avalanches in the Northern Gasp´e Penin-sula, Qu´ebec, Canada, Arct. Antarct. Alp. Res., 36 (4), 555–564, 2004.
Furdada, G., Mart´ınez, H., Leiva, J. C., and Foerster, M.: Reducci´on del riesgo de avalanchas de nieve: el ejemplo de la estaci´on de esqu´ı de Las Le˜nas, Actas XXa Reuni´on Cient´ıfica de Geof´ısica y Geodesia de la Asociaci´on Argentina de Geof´ısica y Geodesia (AAGG), 264–268, 2000.
Furdada, G., Naaim, M., and Martinez, H.: Calibration and appli-cation of the MN2D dynamics model to the avalanches of Las Le˜nas (Argentina), Nat. Hazard. Earth Sys. Sci., 2, 221–226, 2002.
Grissino-Mayer, H. D., Holmes, R. L., Fritts, H. C.: The Interna-tional Tree-Ring Data Bank Program Library Manual, Labora-tory of Tree-Ring Research, The University of Arizona, Tucson, 75–87, 1997.
Gruber, U. and Bartelt, P.: Snow avalanche hazard modelling of large areas using shallow water numerical methods and GIS, En-viron. Modell. Softw., 22, 1472–1481, 2007.
Holmes, R. L.: Computer-assisted quality control in tree-ring dating and measurement, Tree-Ring Bull. 43, 69–75, 1983.
Holtmeier, F. K.: Geological aspects of timberline in northern and central Europe, Arct. Alp. Res., 5 (3), A45–A54, 1973. Hupp, C. R.: Dendrogeomorphic Evidence of Debris Flow
Fre-quency and Magnitude at Mount Shasta, California, Env. Geol. Wat. Sci., 6(2), 121–128, 1984.
Leiva, J. C. and Mart´ınez, H.: Estudio de las presiones y veloci-dades de impacto de la nieve sobre cobertizos en la Ruta
Na-cional N◦7, Technical report, Mendoza, 46 pp., 1998.
Leiva, J. C. and Mart´ınez, H.: Estudio geocient´ıfico aplicado al or-denamiento territorial de Puente del Inca, Anexo II, SEGEMAR, Mendoza, 5 pp., 2006.
Leiva, J. C., Mart´ınez, H., Casteller, A., Novello, V., Bruce, R. H., Corval´an, E., Videla, V. H., Montepeluso, M. S.: Sistema de Control y Manejo de Vialidad Invernal de la Ruta Nacional 7, Etapa I 2006/7, Tercer Trimestre, Expediente 11334/05 DNV, Mendoza, 26 pp., 2007.
Leiva, J. C., Mart´ınez, H., Cabrera, G., Casteller, A., Novello, V.: Sistema de Control y Manejo de Vialidad Invernal de la Ruta Na-cional 7, Etapa I 2006/7, Cuarto Trimestre, Expediente 11334/05 DNV, Mendoza, 19 pp., 2008.
Maggioni, M. and Gruber, U.: The influence of topographic param-eters on avalanche release dimension and frequency, Cold Reg. Sci. Technol., 37(3), 407–419, 2003.
Masiokas, M. H., Villalba, R., Luckman, B. H., Le Quesne, C., and Aravena, J. C.: Snowpack variations in the central Andes of Argentina and Chile, 1951–2005: Large-scale atmospheric in-fluences and implications for water resources in the region, J. Climate, 19(24), 6334–6352, 2006.
Mears, A. I.: Dynamics of Dense Snow Avalanches Interpreted from Broken Trees, Geology, 3(9), 521–523, 1975.
Mundo, I. A., Barrera, M. D., and Roig, F. A.: Testing the utility of Nothofagus pumilio for dating a snow avalanche in Tierra del Fuego, Argentina, Dendrochronologia, 25, 19–28, 2007. Norton, D. A., and Sch¨onenberger, W.: The growth forms and
ecol-ogy of Nothofagus solandri at the alpine timberline, Craigieburn Range, New Zealand, Arct. Alp. Res., 16(3), 361–370, 1984. Perla, R. I. and Martinelli, M. M.: The avalanche handbook, USDA
Forest Service Handbook, 489, 238 pp., 1978.
Rayback, S. A.: A dendrogeomorphological analysis of snow avalanches in the Colorado Front Range, USA, Phys. Geogr., 19(6), 502–515, 1998.
Rinn, F.: TSAP. Time series analysis and presentation. Version 3.0 reference manual, 262 pp., 1996.
Salm, B.: Lawinenkunde f¨ur den Praktiker, Schweizer Alpen Club, Bern, 148 pp., 1982.
Salm, B., Burkard, A., and Gubler, H.U.: Berechnung von Fliess-lawinen, eine Anleitung f¨ur Praktiker mit Beispielen, Mitteilun-gen des EidMitteilun-gen¨ossischen Institutes f¨ur Schnee und Lawinen-forschung 47, Davos, 38 pp.,1990.
Sartoris, G. and Bartelt, P.: Upwinded finite difference schemes for dense snow avalanche modelling, Int. J. Numer. Meth. Fl., 32(7), 799–821, 2000.
Schulman, E.: Dendroclimatic Change in Semiarid America, Uni-versity of Arizona Press, Tucson, Arizona, 142 pp., 1956. Schweingruber, F. H.: Tree Rings and Environment Dendroecology,
Paul Haupt Verlag, Bern, 609 pp., 1996.
Sovilla, B., Burlando, P., and Bartelt, P.: Field exper-iments and numerical modelling of mass entrainment in snow avalanches, J. Geophys. Res-Earth, 111(3), F03007, doi:10.1029/2005JF000391, 2006.
Stoffel, M., Schneuwly, D., Bollschweiler, M., Li`evre, I., Delaloye, R., Myint, M., and Monbaron, M.: Analyzing rockfall activity (1600–2002) in a protection forest – a case study using dendro-geomorphology, Geomorphology, 68, 224–241, 2005.
Stokes, M. A. and Smiley, T. L.: An introduction to Tree-Ring Dat-ing, University of Chicago Press, Chicago, 73 pp., 1968.