HAL Id: hal-00305143
https://hal.archives-ouvertes.fr/hal-00305143
Submitted on 5 Mar 2008
HAL is a multi-disciplinary open access
archive for the deposit and dissemination of
sci-entific research documents, whether they are
pub-lished or not. The documents may come from
teaching and research institutions in France or
abroad, or from public or private research centers.
L’archive ouverte pluridisciplinaire HAL, est
destinée au dépôt et à la diffusion de documents
scientifiques de niveau recherche, publiés ou non,
émanant des établissements d’enseignement et de
recherche français ou étrangers, des laboratoires
publics ou privés.
Winter climate affects long-term trends in stream water
nitrate in acid-sensitive catchments in southern Norway
H. A. de Wit, A. Hindar, L. Hole
To cite this version:
H. A. de Wit, A. Hindar, L. Hole. Winter climate affects long-term trends in stream water nitrate
in acid-sensitive catchments in southern Norway. Hydrology and Earth System Sciences Discussions,
European Geosciences Union, 2008, 12 (2), pp.393-403. �hal-00305143�
www.hydrol-earth-syst-sci.net/12/393/2008/ © Author(s) 2008. This work is licensed under a Creative Commons License.
Earth System
Sciences
Winter climate affects long-term trends in stream water nitrate in
acid-sensitive catchments in southern Norway
H. A. de Wit1, A. Hindar1, and L. Hole2
1Norwegian Institute for Water Research (NIVA), Gaustadall´een 21, 0349 Oslo, Norway
2Norwegian Institute for Air Research (NILU), P.O. Box 100, 2027 Kjeller, Norway
Received: 27 November 2006 – Published in Hydrol. Earth Syst. Sci. Discuss.: 11 September 2007 Revised: / – Accepted: / – Published: 5 March 2008
Abstract. Controls of stream water NO3in mountainous and forested catchments are not thoroughly understood.
Long-term trends in stream water NO3 are positive, neutral and
negative, often apparently independent of trends in N
depo-sition. Here, time series of NO3in four small acid-sensitive
catchments in southern Norway were analysed in order to
identify likely drivers of long-term changes in NO3. In
two sites, stream water NO3 export declined ca 50% over
a period of 25 years while in the other sites NO3 export
increased with roughly 20%. Discharge and N deposition alone were poor predictors of these trends. The most distinct
trends in NO3were found in winter and spring. Empirical
models explained between 45% and 61% of the variation in
weekly concentrations of NO3, and described both upward
and downward seasonal trends tolerably well. Key explain-ing variables were snow depth, discharge, temperature and N deposition. All catchments showed reductions in snow depth and increases in winter discharge. In two inland catch-ments, located in moderate N deposition areas, these climatic changes appeared to drive the distinct decreases in winter
and spring concentrations and fluxes of NO3. In a coast-near
mountainous catchment in a low N deposition area, these cli-matic changes appeared to have the opposite effect, i.e. lead
to increases in especially winter NO3. This suggests that the
effect of a reduced snow pack may result in both decreased and increased catchment N leaching depending on interac-tions with N deposition, soil temperature regime and winter discharge.
1 Introduction
The global N cycle has been severely altered by human activ-ity, causing N enrichment of terrestrial and aquatic
ecosys-Correspondence to: H. A. de Wit
tems (Vitousek, 1994). Deposition of atmospheric N leads to increased runoff of N from catchments in temperate and boreal forests (Moldan et al., 2006; Gundersen et al., 2006; Campbell et al., 2004; MacDonald et al., 2002) and in moun-tainous areas (Kopacek et al., 2005; Fenn et al., 2003). In catchments that are relatively free for direct human impacts like forest management, climatic factors like temperature and hydrology cause large interannual variations in nitrate con-centrations and export (Davies et al., 2005; Clark et al., 2004; Kaste and Skjelkv˚ale, 2002; Wright et al., 2001). In fact, climate impacts may mask long-term trends in stream water nitrate driven by changes in N deposition, or even be a main driver itself of long-term trends in stream water nitrate. So far, there are no compelling data that show a widespread N saturation of catchments in high N deposition areas in North America (Campbell et al., 2004) and Europe (MacDonald et al., 2002) although relations between N deposition, soil N enrichment and N leaching have been found (MacDonald et al., 2002). Often, trends in nitrate in surface waters are ex-plained by changes in N deposition (Burns et al., 2006), for-est regrowth (Ulrich et al., 2006; Vesely et al., 2002) and N saturation (Rogora et al., 2001). In depth analyses of time trends in surface water nitrate in undisturbed catchments in relation to climate variation are scarce.
Climate warming may in direct and indirect ways impact the N-cycle in forested and mountainous ecosystems, for instance through changes in storm intensity and frequency, snow accumulation, drought and length of the growing sea-son. Reductions in snow cover may lead to colder soils in winter time, reduced microbial activity and increased fine root mortality resulting in changes in timing of nutrient avail-ability and plant nutrient uptake (Groffman et al., 2001a, b). Intensity and frequency of rain storms may alter hydrolog-ical pathways that control export of solutes from soils and groundwater to streams (Mitchell et al., 2006; Bishop et al., 1990). Without a better understanding of climatic impacts on the nitrogen cycle, predictions of recovery of water quality
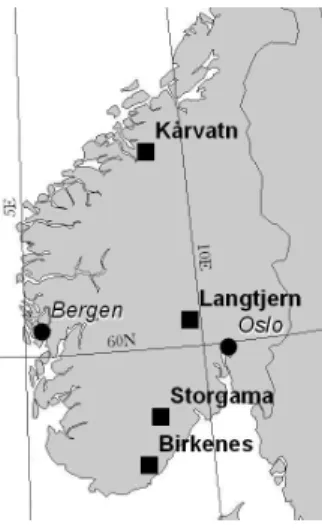
1 Figure 1 Location of catchments in Norway
2
Fig. 1. Location of catchments in Norway.
offset by reduced nitrogen deposition and nutrient export to freshwaters and marine waters in a warmer world as for in-stance attempted by Kaste et al. (2004, 2006) will have lim-ited credibility.
Here, we investigate long data series of stream water ni-trate concentrations and fluxes in four acid-sensitive catch-ments with the aim to identify drivers of long-term change. The catchments show both upward and downward trends in nitrate and are located in areas where significant warming has taken place during the last decades (Hanssen-Bauer, 2005).
2 Materials and methods
2.1 Description of catchments
Four catchments in south Norway (Birkenes, Storgama, Langtjern and K˚arvatn) had up to 30 years of weekly ob-servations of nitrate concentrations in stream water (Fig. 1, Tables 1 and 2). The sites are part of the Norwegian monitor-ing program for long range transported air pollutants which includes measurements of deposition, water chemistry and hydrology. All sites, except K˚arvatn, are heavily influenced by acid deposition and were severely acidified when moni-toring started in the mid-1970s. Since the 1980s, significant
reductions in concentrations of SO4 and inorganic Al have
been measured at the acidified sites while ANC and pH have increased (SFT, 2005). The sites are located along a gradient
of declining wet N deposition from 14 to 2 kg N ha−1
(Ta-ble 1). O horizon CN ratios are above the empirical limit of 25 where increased N leaching has been observed in conif-erous forests (Gundersen et al., 1998) except at Storgama where the value of 23 might indicate reduced N retention ca-pacity. However, the dominating vegetation type at Storgama is heathlands that typically have lower CN ratios than forests (Wright et al., 1999). There has been very little direct dis-turbance in the catchments by human activities, except at
Birkenes where ca 7% of the forest in the catchment was cut in 1985 which lead to an increase in N export that persisted for some years (R. F. Wright, NIVA, personal communica-tion). Climate data were not collected in the monitoring pro-gramme and we choose the nearest meteorological stations with sufficient length of observations for climatic data (Ta-ble 3).
Birkenes is a small forested catchment located ca. 20 km from the coast at an elevation of 200–300 m a.s.l. and dom-inated by productive forest (>80 year old Norway spruce). Mineral soil types (acid brown earth and podzols) are found in a shallow layer of glacial till on granite bedrock while peaty deposits have developed along the streams and in poorly drained topographic depressions. On the slopes, well-drained thin organic layers on gravel or bedrock are com-mon. Water samples are taken at the v-weir where discharge is measured. Birkenes has a relatively long growing season and mild winters with a highly variable snow pack (Table 2). Small snow melt episodes are common in the winter season, summer droughts with hardly any discharge occur regularly while high-intensity rain storms in common in the autumn.
Storgama is a small inland catchment at an elevation of ca 600 m and characterized by a large proportion of bare rock and sparse vegetation, mainly heathland and some Scots pine and birch. Mineral soil types (mostly shallow podzols) are found in pockets of glacial till on granite bedrock while shal-low peaty soils are found in local depressions. Water samples are taken at the v-weir where discharge is measured. The snow pack in the winter is more stable than in Birkenes and snow melt discharge can be considerable. Summer droughts and high intensity autumn rain storms are common.
Langtjern, a lake catchment, is dominated by unproductive forest (mostly Scots pine) on organic and thin mineral soils. Its elevation is between 510 and 750 m a.s.l. The mineral soils have developed on till of felsic gneisses and granites, while deeper peaty soils are common close to streams and the lake, in addition to poorly drained topographic depres-sions. Water samples are taken at the outlet of the lake. Wa-ter residence time of the lake is ca 3 months. Like Storgama, the snow pack is usually stable and there is marked snowmelt period. The site receives less than 800 mm precipitation.
K˚arvatn is a mountainous catchment in a low-deposition area in the west of Norway and has little vegetation and soil cover. Most of the area is above the tree limit and the highest elevation is 1375 m a.s.l. Thin mineral soils are usually found along streams and small lakes, except at the lowest part of the catchment where soils and vegetation are considerably richer. Water samples are taken in this part of the catchment, which means that water draining the higher parts of the catchments has traveled some distance. There is usually a marked snow melt episode, while summer droughts are scarce and autumn rain storms are frequent.
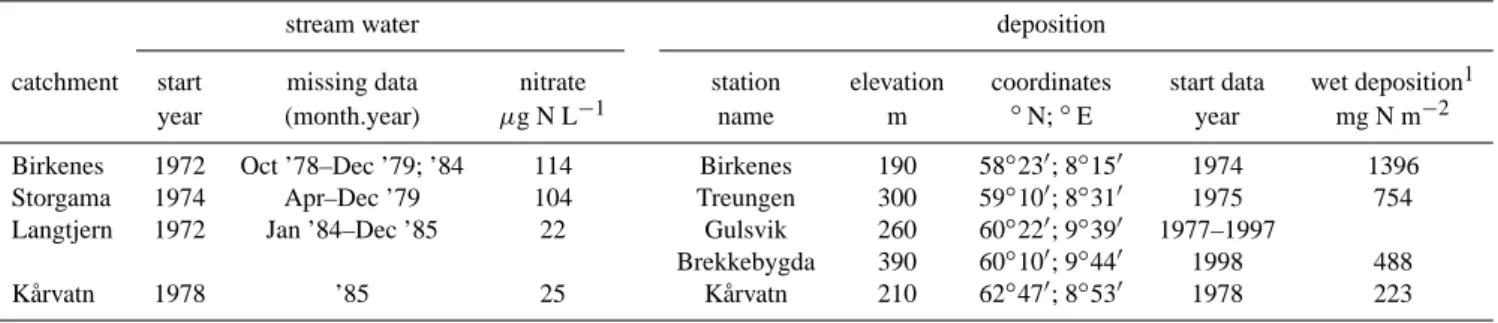
Table 1. Overview data of availability in each site and location of deposition stations. Mean annual streamwater nitrate concentrations and
wet bulk N deposition for each site.
stream water deposition
catchment start missing data nitrate station elevation coordinates start data wet deposition1 year (month.year) µg N L−1 name m ◦N;◦E year mg N m−2 Birkenes 1972 Oct ’78–Dec ’79; ’84 114 Birkenes 190 58◦23′; 8◦15′ 1974 1396 Storgama 1974 Apr–Dec ’79 104 Treungen 300 59◦10′; 8◦31′ 1975 754 Langtjern 1972 Jan ’84–Dec ’85 22 Gulsvik 260 60◦22′; 9◦39′ 1977–1997
Brekkebygda 390 60◦10′; 9◦44′ 1998 488 K˚arvatn 1978 ’85 25 K˚arvatn 210 62◦47′; 8◦53′ 1978 223
1averaged over 1998–2003
Table 2. Catchment characteristics.
area elevation coordinates land cover (%) CN ratio6 km2 m ◦N;◦E Bare rock1 Woodlands2 Peat3 Prod. forest4 Water5 g/g Birkenes 0.41 200–300 58◦38′; 8◦24′ 3 – 7 90 0 27 Storgama 0.6 580–690 59◦05′; 8◦65′ 59 11 22 8 23 Langtjern 4.8 510–750 60◦37′; 9◦73′ 3 60 25 7 5 29 K˚arvatn 25 200–1375 62◦78′; 8◦88′ 76 – 2 18 4 28
1Bare rock, shrubs, thin soils. 2Unproductive forest on thin soils. 3Peaty soils, no trees.
4Productive forest on deeper soils. 5Lake and streams.
6Means of the soil O horizon of 4 plots in each catchment, each plot representative for dominating vegetation types in the catchment
2.2 Monitoring program
Precipitation and chemistry of bulk precipitation are mea-sured in close proximity of the catchments (Table 1). Bulk deposition samples have been collected and analyzed daily at Birkenes while at Langtjern and Storgama, samples were col-lected and analyzed daily until 1992, and at a weekly inter-val after that. Samples were analyzed for nitrate since 1974, while ammonium was included between 1975 and 1977 de-pending on the site. All analyses were done at the accredited laboratory at Norwegian Institute for Air Research (NILU). Methods for analyses and quality control are described else-where (Aas et al., 2006). Calculation of fluxes from the bulk deposition measurements was done by weighting daily or weekly concentrations by the corresponding precipitation volume relative to the total annual precipitation volume.
Dry deposition is estimated from air concentrations of gases and aerosols, using values of dry deposition veloci-ties depending on season and landscape. For the given sites, weekly measurements of air concentrations of gases are done at Birkenes and K˚arvatn only. At Birkenes dry deposition is approximately 20% of total N deposition, while at K˚arvatn
this number is approximately 30% (Hole and Tørseth, 2002; Hole et al., 2007). Estimates for Storgama and Langtjern, based on recent conditional time averaged gradient measure-ments at Storgama (Hole, personal communication) and na-tional monitoring (Aas et al., 2006), are 25% and 38% re-spectively. Dry deposition estimates are generally more un-certain than wet deposition because of more intricate mea-surements and calculations, and because data availability is lower. Bulk wet deposition of N is quantitatively more im-portant than dry deposition. Because time series of wet depo-sition were longer and more certain than time series of total deposition, we decided to include only wet deposition of N as an explaining variable.
Stream water samples have been collected with weekly intervals since the start of the monitoring at the sites, and during some periods in the 1970s with daily intervals (Ta-ble 1). Chemical values were always averaged to weekly intervals before further statistical analysis. The monitoring programme was interrupted for intervals of 3 to 18 months
between 1979 and 1985 at some sites. For these
Table 3. Location of climate stations and key climate statistics for each station.
catchment climate station elevation coordinates MAP1 MAT2 L. gr s3 Snow depth4 m ◦N;◦E mm ◦T days Mean cm Birkenes Herefoss* 85 58◦51′; 8◦36′ 1284 6.5 216 36 (3–57) Storgama Tveitsund* 252 59◦27′; 8◦52′ 979 5.5 201 34 (10–52) Langtjern Gulsvik 147 60◦39′; 9◦57′ 716 3.5 175 31 (10–45) K˚arvatn Ang˚ardsvatnet*˚ 596 62◦67′; 9◦20′ 794 3.1 153 77 (52–94)
* Only precipitation, snowdepth and snowcover recorded at these stations. Temperature is interpolated according to Tveito et al. (2000).
1Mean annual precipitation (1998–2003); 2Mean annual temperature (1998–2003); 3Length of growing season (1998–2003);
4mean snow depth in February (1973–2003) (mean and 25%-percentiles)
performed at accredited laboratories at Norwegian institute for Water Research (NIVA); methods for analyses and qual-ity control are described elsewhere (SFT, 2005; Aas et al., 2006). The detection limit for nitrate was 10 µg N/L un-til 1983; 1 µg N/L after that. Discharge was recorded con-tinuously at V-notch weirs at the outlets of each watershed. Stream water fluxes of nitrate were calculated by interpolat-ing between subsequent nitrate concentrations to daily values and multiplying with daily stream discharge.
2.3 Climate data
The acid deposition monitoring programme did not include climate parameters except precipitation. Climate data (tem-perature, snow depth, snow cover and precipitation) until 2003 were obtained from the closest climate stations avail-able (Tavail-able 3). Snow cover is a class variavail-able varying from 0 (no snow) to 4 (stable snow cover). Two of these stations were precipitation stations, and daily temperature values are therefore interpolated at these locations according to Tveito et al. (2000). Temperature at the Tveitsund station was lack-ing between 2 March 2002–17 March 2002 and was interpo-lated according to Tveito et al. (2000). At Herefoss, snow depth data was missing between 1 December 2001 and 10 February 2003. Values for the missing data were obtained using the following criteria in descending order of impor-tance: if snow cover = 0, snow depth = 0; if air temperature
>4◦C, snow depth = snow depth daybefore/2; if air
temper-ature ≤4◦C, snow depth = snowdepth daybefore +
precipi-tation (in mm)/2. The threshold of 4◦C was chosen because
precipitation came as snow at an air temperature <4◦C
ac-cording to the snow cover data. Temperature at this site was interpolated from neighboring stations, not measured. De-spite the fact that climate data were not measured in or in immediate proximity of the catchments, they can be used as explaining variables in a statistical analysis because the vari-ation in the data rather than the absolute values is used.
2.4 Statistical methods
Analysis of time trends was done by a Mann-Kendall test (MK test) (Kendall, 1975) and a seasonal Mann-Kendall test (SMK test) developed to account for seasonal variation (Hirsch and Slack, 1984). The software was developed at the University of Linkoeping in Sweden and can be downloaded from the net. The MK and SMK tests are non-parametric, rank-based tests for the detection of monotonic trends in time series. These tests are widely used in environmental science, because of their robustness towards non-normally distributed data, missing values and values below detection limit. The SMK test was developed to account for seasonal variation, but serial correlation between seasons can lead to overes-timation of the significance level when the test statistic is summed by season to test for the overall trend. Therefore, we choose to test annual trends by using annual values rather than summing the test statistic of the SMK test over seasons. The slope of the trend was estimated using Sen’s slope esti-mator (Sen, 1968). The Sen slope is the median of the slopes calculated from all pairs of values in the data series, a method that is little affected by data outliers and missing data (Salmi et al., 2002). Seasons were winter (December to February), spring (March to May), summer (June to August) and au-tumn (September to November).
Statistical models to describe weekly concentrations of
NO3 were built using stepwise multiple regression
(for-ward and back(for-ward selection with a 0.05 significance thresh-old). Explaining variables were climate variables (T,
pre-cipitation, snow cover, snow depth), discharge and wet NO3
and NO3+NH4 deposition. The variables were aggregated
(summed or averaged) over intervals prior to sampling date – from days (1, 3, 7, 14) to months (1, 3, 6, 12). For instance, the variable snow aggregated for 1 day (7 days) was snow depth at the sampling date of the stream water sample (av-eraged over the sampling day and 6 days before). Variable selection was constrained as little as possible, except that i) a given variable was not allowed in the model for different in-tervals, except if the intervals were separated by at least two
0 50 100 150 200 250 1970 1975 1980 1985 1990 1995 2000 2005 N O 3 -N c o n c e n tr a ti o n (µ g L -1)
Birkenes Langtjern Storgama Kårvatn
0 50 100 150 200 250 300 1970 1975 1980 1985 1990 1995 2000 2005 N O 3 -N f lu x ( m g m -2)
Birkenes Langtjern Storgama Kårvatn
Fig. 2. Annual nitrate flux (mg N m−2)(left panel) and annual mean nitrate concentrations (mg N L−1)(right panel) in four catchments in south Norway.
Table 4. Results of Mann-Kendall test of trends in annual nitrate flux and annual mean nitrate concentrations in each catchment. Trends
calculated using sen-slope estimator. Significance level p<0.0001, ****; <0.001, ***; <0.01, **; <0.05, *. n.s. is not significant.
NO3-flux g N m−2yr−1 NO3concentration µg N L−1yr−1
period n p< sen-slope p< sen-slope Birkenes 1973–2005 31 n.s. 1.6 n.s. 0.5
excl. ’86–’91 24 * 2.8 n.s. 1.0 Langtjern 1974–2002 30 *** −0.4 **** −0.6 Storgama 1975–2005 30 ** −3.7 **** −3.6 K˚arvatn 1978–2005 27 * 0.4 *** 0.7
time periods; ii) the increase in explained variation of the response upon each entered variable should be at least 1%. The first constraint was included to reduce the internal corre-lation of variables in the model. Akaike’s information crite-rion (AIC) was also used to keep the number of variables in the model to a minimum, but constraints and the demand for a minimum of additional explained variation were a stricter criterion than AIC.
To evaluate the success of the statistical models, a seasonal Mann-Kendall test was done on seasonal means of measured
and predicted nitrate. While r2 indicates the success of the
model to describe variation, the seasonal Mann-Kendall test renders information about the ability of the model to describe the observed trend in nitrate.
3 Results
3.1 Trends in nitrate fluxes and concentrations
Annual stream water nitrate fluxes and concentrations were highest in coast-near Birkenes and inland Storgama and lowest in inland Langtjern and coast-near K˚arvatn
(Fig. 2). K˚arvatn is located in a low-deposition area
(∼0.2 g N m−2yr−1 wet deposition) with high annual
rain-fall, whereas Langtjern and Storgama receive moderate
amounts of N deposition (0.5–0.8 g N m−2yr−1wet
deposi-tion). The relatively high N export in Storgama is related to the high proportion of bare rock in the catchment with a low capacity for N retention. Birkenes receives the highest loads
of nitrogen (∼1.4 g N m−2yr−1wet deposition) and roughly
twice as much rainfall as Storgama.
The two inland catchments Storgama and Langtjern showed a significant decrease in annual mean nitrate con-centrations and fluxes, whereas K˚arvatn showed a significant increase (Table 4). Birkenes was the only catchment with no significant trends in nitrate. Nitrate fluxes in Birkenes showed a peak in the late 1980s, probably due to a forest harvest of 7% of the catchment in 1985. The high nitrate export from the catchment persisted until 1991. Increase of nitrate export due to forest harvest is a well-documented phe-nomenon. Gundersen et al. (2006) suggest based on a liter-ature review that nitrate export returns to pre-harvest levels in 3–5 years after the forest harvest. The nitrate pulse due to direct human disturbance makes the data less suitable for analysis of coherence between environmental drivers and ni-trate variability. Therefore, the period 1986–1991 was ex-cluded from the data in further analysis. Without these years, nitrate export in Birkenes showed a significant increase (Ta-ble 4). The changes in stream water nitrate export between
-6 -4 -2 0 2 4
NO3 flux mean [NO3] discharge
s e n -s lo p e
Winter Spring Summer Autumn
Kårvatn -6 -4 -2 0 2 4
NO3 flux mean [NO3] discharge
s e n -s lo p e
Winter Spring Summer Autumn
Langtjern -6 -4 -2 0 2 4
NO3 flux mean [NO3] discharge
s e n -s lo p e
Winter Spring Summer Autumn
Storgama 0 1 2 3 4
NO3 flux mean [NO3] discharge
- lo g ( p )
Winter Spring Summer Autumn
Kårvatn 0 1 2 3 4
NO3 flux mean [NO3] discharge
- lo g ( p )
Winter Spring Summer Autumn
Langtjern 0 1 2 3 4
NO3 flux mean [NO3] discharge
- lo g ( p )
Winter Spring Summer Autumn
Storgama -4 -2 0 2 4 6
NO3 flux mean [NO3] discharge
s e n -s lo p e / m e a n ( % )
Winter Spring Summer Autumn
Kårvatn -4 -2 0 2 4 6
NO3 flux mean [NO3] discharge
s e n -s lo p e / m e a n ( % )
Winter Spring Summer Autumn
Langtjern -4 -2 0 2 4 6
NO3 flux mean [NO3] discharge
s e n -s lo p e / m e a n ( % )
Winter Spring Summer Autumn
Storgama -4 -2 0 2 4 6
NO3 flux mean [NO3] discharge
s e n -s lo p e / m e a n ( % )
Winter Spring Summer Autumn
Birkenes 0 1 2 3 4
NO3 flux mean [NO3] discharge
- lo g ( p )
Winter Spring Summer Autumn
Birkenes
c
-6 -4 -2 0 2 4NO3 flux mean [NO3] discharge
s e n -s lo p e
Winter Spring Summer Autumn
Birkenes
a
b
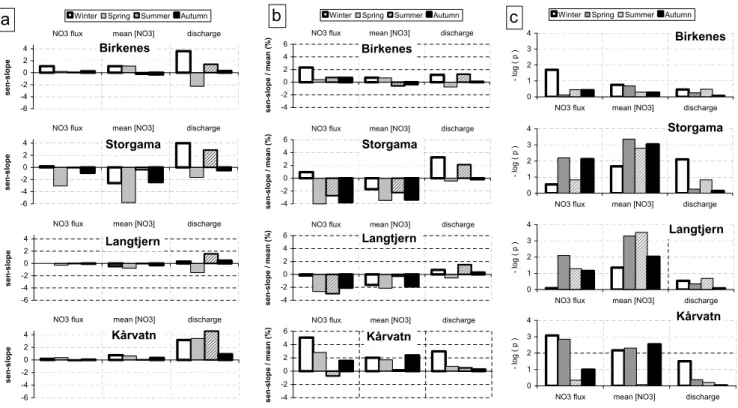
Figure 3 Absolute (panel a) and relative (panel b) changes in seasonal NO3 streamwater flux (mg N m-2 yr-1), seasonal mean nitrate
Fig. 3. Absolute (panel a) and relative (panel b) changes in seasonal NO3streamwater flux (mg N m−2yr−1), seasonal mean nitrate
concen-trations (µg NO3-N L−1yr−1)and seasonal discharge (mm yr−1)for each catchment. Absolute change estimated with sen-slope, relative change (in %) is sen-slope divided by mean. Significance level (panel c) (negative logarithm of p, from Seasonal Mann-Kendall test) for the variables. A higher score means a higher significance level. −log (0.05) = 1.7. Winter = December–February; Spring = March–May; Summer = June–August; Autumn = September–November.
1978–1982 and 2001–2005 (averages calculated for each pe-riod, data not shown) amounted to roughly a 50% reduction in Storgama and Langtjern and a 20% increase in Birkenes and K˚arvatn.
The trends in the stream water nitrate export could poten-tially be explained by trends in discharge or N deposition. However, mean annual discharge did not show a trend in any of the catchments whereas annual wet N deposition showed a significant decrease only in Birkenes (1973–2003; Mann-Kendall test, data not shown), a catchment where nitrate ex-port increased. Thus, from a quick view at the annual trends in hydrological flux and N deposition, stream water nitrate trends seem to be primarily controlled by other factors than deposition and discharge.
3.2 Seasonality in the trends
The absolute trends in seasonal means of nitrate concentra-tions were small (Fig. 3a) but significant (Fig. 3c) in Langt-jern and K˚arvatn, whereas Storgama showed large and signif-icant seasonal trends. For comparison between sites and sea-son, the trend strength was more conveniently expressed in % change (Fig. 3b). In Birkenes, the only significant (p<0.05) seasonal trend was the increase in nitrate flux in the winter, which was probably a combined effect of an increase in
con-centration and an increase in water discharge. In Storgama, nitrate concentrations showed a significant decrease in all seasons, whereas nitrate fluxes only showed a significant de-crease only in spring and autumn. Interestingly, the winter nitrate flux increased (non-significantly) which must be re-lated to the (significant) increase in winter discharge. The seasonal trends in Langtjern were remarkably similar to those in Storgama but generally less significant. K˚arvatn showed highly significant increases in winter, spring and autumn ni-trate concentrations which were paralleled with increases in winter, spring and autumn nitrate fluxes. The upward trend in winter nitrate flux in K˚arvatn was even more significant than the trend in winter nitrate concentration, probably because of the increase in winter discharge.
Thus, the trends in seasonal nitrate fluxes were in most cases similar to the trends in concentrations, although in some seasons discharge also determined the strength of the trend. The similarity of trends in nitrate fluxes and concentra-tions indicates that discharge was not the main driving factor behind the long-term changes in nitrate leakage in the catch-ments.
3.3 Statistical analysis of weekly nitrate concentrations Empirical models were built to describe seasonal and
long-term variation in nitrate concentrations. The models
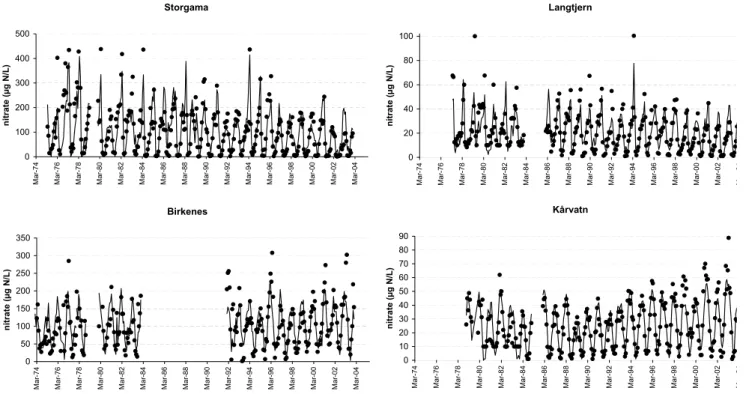
de-scribed 45% (Birkenes) to 66% (K˚arvatn) of all variation in weekly nitrate concentrations (Table 5). Seasonal variabil-ity – lows during the growing season and highs during late winter/early spring – was captured fairly well although espe-cially maximum nitrate concentrations were underestimated (Fig. 4). Maximum nitrate concentrations always occurred during snowmelt. Upward and downward trends in annual nitrate were predicted correctly, but the predicted trends were smaller and less significant than the trends in observed nitrate (Table 6). The same pattern emerged in prediction of the trends in seasonal mean nitrate. Exceptions were Birkenes where the increase in winter and spring nitrate was not ade-quately described, summer nitrate in Storgama and K˚arvatn and autumn nitrate in Langtjern which all decreased in real-ity contrary to predicted nitrate. For K˚arvatn, the predicted increase in summer nitrate may be related to the positive re-lation between annual temperature and nitrate in the empiri-cal model, which may not be of large importance during the summer when nitrate leaching is controlled by plant uptake.
The mismatch between observed and predicted nitrate trends in Birkenes suggests that factors that drive the long-term increase in nitrate in this catchment were not properly included in the empirical model. Regarding summer nitrate trends, what each model captured well was the small abso-lute change. Nitrate concentrations in the summer were at a minimum in all catchments and the absolute trends were very small (Fig. 3), and trends in annual nitrate were dominated by trends in the winter half year.
In the empirical models for Langtjern and Storgama, ex-actly the same variables were selected (Table 5). The vari-ables in the Langtjern model were aggregated for slightly longer intervals than in the Storgama model, which is proba-bly related to the small lake in the catchment which delayed the nitrate signal in the outlet carried to the lake by the inlet streams. The sign between the selected variables and the re-sponse variable was the same in both models, and the amount of variation explained by each variable (as indicated by the t-ratio) was also similar. The similarity in the seasonal trends and in the empirical models for Langtjern and Storgama sug-gests that the long-term decrease in nitrate in these catch-ments has been driven by the same factors.
The empirical model for K˚arvatn included the same vari-ables as the Langtjern and Storgama models, except for
dis-charge which was replaced with precipitation. However,
most of the variables were aggregated for the period of 1 year instead of 2 to 3 months as for Langtjern and Storgama. The model for Birkenes did not include snow depth as an explanatory variable and 3 of 6 variables were aggregated over very short intervals, i.e. 3–7 days. Birkenes is the small-est catchment of the four included and the presence of such short-term variables indicates that nitrate was partly driven
by short-term variation in the weather. K˚arvatn is the largest catchment and here the nitrate did not seem very responsive to short-term weather variability.
The empirical models explained thus the seasonal vari-ability quite well and the long-term trend of nitrate tolera-bly well, except for Birkenes. Key explaining variables were temperature, snow depth, discharge and N deposition.
3.4 Long term trends in independent variables
To investigate which of the explanatory variables in Table 5 might be related to the long-term trend in nitrate, trends in annual and seasonal means of these variables were calculated (Table 7). Only significant trends are reported. The model for Birkenes was not considered as this model did not predict the seasonal trends in nitrate satisfactorily.
At none of the three sites did N deposition have a signif-icant trend which again underlines that the trends in stream water nitrate were not directly related to N deposition. Snow depth decreased significantly in all three sites, most distinct during the spring. The increasing trend in temperature was present at all sites, but less significant than for snow depth. The seasonal trend in temperature was significant in winter and spring only, which indicates that climate warming un-til now has had a larger impact on temperature in the winter half year than the summer half year. Discharge did not show a long-term trend, but the distribution of discharge over the seasons increased markedly toward more winter discharge whereas discharge in spring decreased. This fits with the pre-dicted future climate in Norway caused by climate warming – increasingly unstable winters with an increased frequency of winter snow melt and a less distinct spring snow melt (Engen-Skaugen et al., 2005; Hanssen-Bauer et al., 2003; Benestad, 2002).
4 Discussion and conclusions
The trends in nitrate fluxes in the investigated catchments were negative in the inland catchments and positive in the two more coast-near catchments, which was mirrored by the trends in the nitrate concentrations except at Birkenes. The presence of upward and downward trends agrees with the lack of consistent widespread patterns in trends in nitrate concentrations in acid-sensitive catchments in Europe and North America (Skjelkv˚ale et al., 2005; Davies et al., 2005; Binkley et al., 2004). By contrast, reported long-term trends in nitrate are positive, neutral and negative although de-creases in nitrate appear to be more frequent than inde-creases. Declines in nitrate and lack of trends in nitrate have been observed in stream water and lakes in New York state in USA during the 1980–2000 (Burns et al., 2006), declines were found in reservoirs and stream waters the Erzgebirge in southeast Germany in 1993–2003 (Ulrich et al., 2006), in stream waters in forest catchments in the Czech Republic
Table 5. Stepwise regression models for weekly nitrate in each catchment, for a subset of the observation period. r2, amount of variation in weekly nitrate explained; t-ratio, relative amount of variation explaining by each variable in a model, and relation to dependent variable. Explaining variables: prec, precipitation; dep NoX+Nred, wet N deposition; temp, temperature; dep Nox, wet deposition of nitrate.
Birkenes r2= 0.45 K˚arvatn r2=0.66 ’74–’83; ’92–’031 ’79–’03
interval variable t-ratio Interval Variable t-ratio 3 Prec 7.0 1 Snowdepth 3.8 7 Dep Nox+Nred 6.3 60 Prec −8.9 7 discharge −4.4 60 Temp −24.6 30 temp −30.8 365 dep Nox+Nred 4.1 60 prec −11.3 365 Prec −12.3 365 prec 6.0 365 Snowdepth 8.3
365 Temp 9.0
Storgama r2=0.65 Langtjern r2=0.51 ’75–’031 ’77–’031
interval variable t-ratio interval Variable t-ratio 1 snowdepth −18.4 1 Snowdepth −16.7 30 temp −18.0 60 dep Nox 16.7 60 snowdepth 30.9 60 Discharge −14.1 60 discharge −15.4 90 Snowdepth 14.8 90 dep Nox 20.4 90 Temp −16.7
1Not all nitrate observations were included because of lacking matching climate and deposition data, and for Birkenes because of local
disturbance affecting nitrate concentrations.
Storgama 0 100 200 300 400 500 M a r-7 4 M a r-7 6 M a r-7 8 M a r-8 0 M a r-8 2 M a r-8 4 M a r-8 6 M a r-8 8 M a r-9 0 M a r-9 2 M a r-9 4 M a r-9 6 M a r-9 8 M a r-0 0 M a r-0 2 M a r-0 4 n itr a te (µ g N /L ) Langtjern 0 20 40 60 80 100 Ma r-7 4 Ma r-7 6 Ma r-7 8 Ma r-8 0 Ma r-8 2 Ma r-8 4 Ma r-8 6 Ma r-8 8 Ma r-9 0 Ma r-9 2 Ma r-9 4 Ma r-9 6 Ma r-9 8 Ma r-0 0 Ma r-0 2 M0 4 n itr a te (µ g N /L ) Birkenes 0 50 100 150 200 250 300 350 Ma r-7 4 Ma r-7 6 Ma r-7 8 Ma r-8 0 Ma r-8 2 Ma r-8 4 Ma r-8 6 Ma r-8 8 Ma r-9 0 Ma r-9 2 Ma r-9 4 Ma r-9 6 Ma r-9 8 Ma r-0 0 Ma r-0 2 Ma r-0 4 n itr a te (µ g N /L ) Kårvatn 0 10 20 30 40 50 60 70 80 90 Ma r-7 4 Ma r-7 6 Ma r-7 8 Ma r-8 0 Ma r-8 2 Ma r-8 4 Ma r-8 6 Ma r-8 8 Ma r-9 0 Ma r-9 2 Ma r-9 4 Ma r-9 6 Ma r-9 8 Ma r-0 0 Ma r-0 2 M0 4 n itr a te (µ g N /L )
Figure 4 Monthly means of observed and predicted nitrate concentrations in four catchments. Predictions based on models presented in
Fig. 4. Monthly means of observed and predicted nitrate concentrations in four catchments. Predictions based on models presented in
Table 6. Sen-slopes of observed (obs) and predicted (pred) nitrate (predicted by models in Table 5) for annual means and seasonal means
for period until 20031. Significance level calculated by Seasonal Mann-Kendall test. Significance level p<0.01, **; <0.05, *. n.s. is not significant.
Birkenes Storgama Langtjern K˚arvatn
obs pred obs pred obs pred obs pred
year 1.5 * 0.7 * −3.6 **** −2.2 *** −0.62 **** −0.34 *** 0.8 **** 0.5 *** winter 3.9 * 0.9 n.s. −2.5 ** −1.3 n.s. 0.0 n.s. 0.3 n.s. 1.3 *** 0.9 n.s. spring 2.1 * 0.4 n.s. −6.1 **** −5.1 *** −0.4 *** −0.3 ** 1.3 *** 0.5 * summer 0.4 n.s. −0.4 n.s. −0.7 *** 0.7 n.s. −0.04 *** −0.1 n.s. −0.1 n.s. 0.4 **** autumn 1.1 n.s. 0.9 n.s. −2.4 *** −1.5 ** −0.1 ** 0.04 ** 0.7 *** 0.7 **
1Trend estimates in Table 4 and Table 6 deviate slightly because Table 6 is based on shorter time series
Table 7. Trends in key explanatory variables in models and time periods shown in Table 5. Significance level calculated by Seasonal
Mann-Kendall test. Significance levels as in Table 4. N.r. is not relevant.
Storgama Langtjern K˚arvatn
Snowdepth Temp discharge Snowdepth Temp discharge Snowdepth Temp discharge year ↓ ** ↑ * ↑ n.s ↓ ** ↑ ** ↑ n.s ↓ ** ↑ * ↓ n.s winter ↓ n.s ↑ n.s ↑ *** ↓ * ↑ * ↑ n.s ↓ n.s ↑ n.s ↑ *** spring ↓ ** ↑ ** ↓ n.s ↓ ** ↑ * ↓ * ↓ ** ↑ n.s ↓ * summer N.r. ↑ n.s ↑ n.s N.r. ↑ n.s ↑ n.s N.r. ↑ n.s ↓ * autumn ↓ n.s ↑ n.s ↓ n.s ↓ n.s ↑ n.s ↑ n.s ↓ ** ↑ n.s ↓ *
(Vesely et al., 2002) and in alpine lakes in the Tatra moun-tains in Central Europe in the 1990s (Kopacek et al., 2005). In the Italian Alps, significant increases in stream water ni-trate were found in old-growth forests catchments in rela-tively high N deposition areas (Rogora et al., 2001).
The factors used to explain the observed trends in the stud-ies mentioned above include enhanced growth of forests that were previously negatively impacted by acid deposition (Ul-rich et al., 2006; Vesely et al., 2002), trends in N deposition and decreased soil capacity to retain deposited N (Kopacek et al., 2005; Burns et al., 2006; Rogora et al., 2001). Forests at the sites in our study have not shown signs of growth deter-rence by acid deposition and are presently not growing faster than previously (Solberg et al., 2004) while N deposition in the sites has not changed significantly. The declining trends in Storgama and Langtjern can logically not be explained from increases in soil N towards a state of N saturation, while K˚arvatn (where nitrate increased) is located in a low deposi-tion area where significant enrichment of soils with N to-wards saturation is not plausible. Thus, forest growth, soil N status and N deposition are unlikely to be dominating con-trols of the trends in nitrate that have been found. This agrees with the results of the data analysis that point toward climate variables as the major driver behind the observed trends in nitrate.
Largest absolute trends in nitrate concentrations were found in the winter half-year in all sites, both upward and downward (Table 4). The largest changes in climatic drivers
were also found in winter time (Table 7), and snow was a prominent explaining variable in the empirical models (Ta-ble 5). However, the opposite signs of the winter trends in nitrate and of the relations between snow depth and nitrate in the different catchments remain puzzling. Interestingly, opposite signs in correlations between the positive values of the NAO index (related to mild winter weather) and nitrate concentrations have also been found in undisturbed lakes in the UK and Finland. In the UK, mild winters were corre-lated with a decrease in nitrate while the opposite was true in Finland (George et al., 2004). This was explained by in-creased terrestrial nitrate immobilisation in winter in the UK, and an earlier flush of melting water leading to higher nitrate in Finland.
The empirical models all included air temperature (aggre-gated over months to a year) which was negatively related to nitrate. This is logical, as nitrate peaks in the winter sea-son and is at a low during summer when plant uptake and soil immobilisation control nitrate leaching. However, it is not air temperature but soil temperature that is the primary controlling factor for N-cycling in catchment soils. Soil tem-perature, especially in the presence of snow, is not a linear function of air temperature. Therefore, snow (averaged over months to a year) entered the models with a positive sign to “correct” for the overestimation of the effect of low air temperature on nitrate. However, daily snow depth is also part of the models, negatively related to nitrate in the inland catchments, and positively in K˚arvatn. So, while snow depth
aggregated over months to a year may be conceived as a “soil temperature correction factor”, the model variable daily snow depth may illustrate the opposite effect that changing snow conditions may have. Whether the changes in the snow pack are a proxy for a temperature effect – more frequent freezing and thawing or simply a change in temperature – or for changing winter discharge is not possible to say from this data analysis.
Changing winter conditions in catchments where stable snow packs and single snow melt episodes used to be com-mon thus seem to affect nitrate leaching in opposite ways. In areas with significant inputs of atmospheric N, the absence of a single snow melt episode will undoubtedly lead to lower peak concentrations of nitrate in spring time. When it comes to the soil insulation effect of snow, reduced snow cover may have different effects depending on catchment type, climate zone and soil N status. Snow cover was positively related to and a good predictor of annual variations in catchment N retention in the Loch Vale catchment in the Colorado moun-tain range, an area with moderate N deposition (Brooks et al., 1999). Plot scale measurements in the catchment indi-cated a negative relation between soil microbial activity and nitrate leaching, suggesting that high snow cover years (im-plying warmer soils and more heterotrophic activity) would be related to low nitrate leaching and vice versa. Our results from the high elevation catchment K˚arvatn fit in this pattern while the inland catchments show high N leaching in years with a large snow pack.
Less snow and less permanent snow cover do not neces-sarily lead to warmer soils as convincingly shown in a snow manipulation experiment by Decker et al. (2003). Effects of snow removal were dependent on the type of winter – from mild and dry to cold and snow rich – which suggests that soil temperatures may be affected by reduced snow cover differ-ently in different climate zones. Additionally, there is large uncertainty with regard to soil temperature effects on soil processes that control nitrate leaching (Schimel and Bennett, 2004). A snow manipulation study in sugar maple stands lead to increased soil nitrate concentrations due to physical disruption of the soil and roots and not to changes in liberal-ization or immobilisation rates (Groffman et al., 2001b).
The trend analysis of stream water nitrate and climatic variables in the inland catchments in the moderate N depo-sition area and the mountainous catchment in a low N de-position area indicates that climate warming may both en-hance and decrease stream water concentrations and – fluxes of nitrate. The seemingly contradictory effect of reductions in snow pack calls for in-site investigations of winter nitrate processes with a focus on the interaction of hydrology, soil temperature regime and soil heterotrophic activity.
Acknowledgements. Thanks to T. Enger-Haugen (Norwegian
Meteorological Institute) for supplying climatic data, W. Aas (Nor-wegian Institute of Air Research) for supplying deposition data and T. Høg˚asen (NIVA) for assisting with linking databases. This
paper was written with support from the project NFR 155826/S30 financed by the Norwegian Research Council, and the EU project Eurolimpacs. Colleagues are gratefully acknowledged for inspiring and helpful comments.
Edited by: P. Dillon and R. F. Wright
References
Aas, W., Solberg, S., Berg, T., Manø, S., and Ytti, K. E.: Mon-itoring of long-range transported pollutants in Norway, At-mospheric transport, 2005, Rapport 955/2006, TA-2180/2006, NILU OR 36/2006, Norwegian Air Pollution Control Authority, Oslo, 2006.
Benestad, R. E.: Empirically downscaled multimodel ensemble temperature and precipitation scenarios for Norway, J. Climate, 15, 3008–3027, 2002.
Binkley, D., Ice, G. G., Kaye, J., and Williams, C. A.: Nitrogen and phosphorus concentrations in forest streams of the United States, J. Am. Water Resour. As., 40, 1277–1291, 2004.
Bishop, K. H., Grip, H., and Oneill, A.: The origins of acid runoff in a hillslope during storm events, J. Hydrol., 116, 35–61, 1990. Brooks, P. D., Campbell, D. H., Tonnessen, K. A., and Heuer, K.: Natural variability in N export from headwater catchments: snow cover controls on ecosystem N retention, Hydrol. Process., 13, 2191–2201, 1999.
Burns, D. A., McHale, M. R., Driscoll, C. T., and Roy, K. M.: Re-sponse of surface water chemistry to reduced levels of acid pre-cipitation: comparison of trends in two regions of New York, USA, Hydrol. Process., 20, 1611–1627, 2006.
Campbell, J. L., Hornbeck, J. W., Mitchell, M. J., Adams, M. B., Castro, M. S., Driscoll, C. T., Kahl, J. S., Kochenderfer, J. N., Likens, G. E., Lynch, J. A., Murdoch, P. S., Nelson, S. J., and Shanley, J. B.: Input-output budgets of inorganic nitrogen for 24 forest watersheds in the northeastern United States: A review, Water Air Soil Poll., 151, 373–396, 2004.
Clark, M. J., Cresser, M. S., Smart, R., Chapman, P. J., and Ed-wards, A. C.: The influence of catchment characteristics on the seasonality of carbon and nitrogen species concentrations in up-land rivers of Northern Scotup-land, Biogeochemistry, 68, 1–19, 2004.
Davies, J. J. L., Jenkins, A., Monteith, D. T., Evans, C. D., and Cooper, D. M.: Trends in surface water chemistry of acidified UK Freshwaters, 1988–2002, Environ. Pollut., 137, 27–39, 2005. Decker, K. L. M., Wang, D., Waite, C., and Scherbatskoy, T.: Snow removal and ambient air temperature effects on forest soil tem-peratures in Northern Vermont, Soil Sci. Soc. Am. J., 67, 1234– 1242, 2003.
Engen-Skaugen, T., Roald, L. A., Beldring, S., Førland, E. J., Tveito, O. E., Engeland, K., and Benestad, R.: Climate change impacts on water balance in Norway Climate report nr 1/2005, Norwegian Meteorological Institute, Oslo, 2005.
Fenn, M. E., Baron, J. S., Allen, E. B., Rueth, H. M., Nydick, K. R., Geiser, L., Bowman, W. D., Sickman, J. O., Meixner, T., Johnson, D. W., and Neitlich, P.: Ecological effects of nitrogen deposition in the western United States, Bioscience, 53, 404– 420, 2003.
George, D. G., Jarvinen, M., and Arvola, L.: The influence of the North Atlantic Oscillation on the winter characteristics of
Win-dermere (UK) and Paajarvi (Finland), Boreal Environ. Res., 9, 389–399, 2004.
Groffman, P. M., Driscoll, C. T., Fahey, T. J., Hardy, J. P., Fitzhugh, R. D., and Tierney, G. L.: Colder soils in a warmer world: A snow manipulation study in a northern hardwood forest ecosys-tem, Biogeochemistry, 56, 135–150, 2001a.
Groffman, P. M., Driscoll, C. T., Fahey, T. J., Hardy, J. P., Fitzhugh, R. D., and Tierney, G. L.: Effects of mild winter freezing on soil nitrogen and carbon dynamics in a northern hardwood forest, Biogeochemistry, 56, 191–213, 2001b.
Gundersen, P., Callesen, I., and de Vries, W.: Nitrate leaching in forest ecosystems is related to forest floor C/N ratios, Environ. Pollut., 102, 403–407, 1998.
Gundersen, P., Schmidt, I. K., and Raulund-Rasmussen, K.: Leach-ing of nitrate from temperate forests – effects of air pollution and forest management, Environ. Rev., 14, 1–57, 2006.
Hanssen-Bauer, I.: Regional temperature and precipitation series for Norway: Analyses of time-series updated to 2004, Report nr. 2005/15, Norwegian Meterological Institute, Oslo, 2005. Hanssen-Bauer, I., Forland, E. J., Haugen, J. E., and Tveito, O. E.:
Temperature and precipitation scenarios for Norway: compari-son of results from dynamical and empirical downscaling, Cli-mate Res., 25, 15–27, 2003.
Hirsch, R. M. and Slack, J. M.: A nonparametric trend test for sea-sonal data with serial dependence, Water Resour. Res., 20, 727– 732, 1984.
Hole, L. R., Brunner, S. H., Hansen, J. E., and Zhang, L.: Low cost measurements of nitrogen and sulphur dry deposition veloc-ities at a semi-alpine site: Gradient measurements and a compar-ison with deposition model estimates, Environ. Pollut., in press, doi:10.1016/j.envpol.2007.06.061, 2007.
Hole, L. R. and Tørseth, K.: Deposition of major inorganic com-pounds in Norway 1978–1982 and 1997–2001: status and trends OR 61/2002, NILU, Kjeller, 2002.
Kaste, O. and Skjelkvale, B. L.: Nitrogen dynamics in runoff from two small heathland catchments representing opposite extremes with respect to climate and N deposition in Norway, Hydrol. Earth Syst. Sci., 6, 351–362, 2002,
http://www.hydrol-earth-syst-sci.net/6/351/2002/.
Kaste, O., Rankinen, K., and Lepisto, A.: Modelling impacts of climate and deposition changes on nitrogen fluxes in northern catchments of Norway and Finland, Hydrol. Earth Syst. Sci., 8, 778–792, 2004,
http://www.hydrol-earth-syst-sci.net/8/778/2004/.
Kaste, O., Wright, R. F., Barkved, L. J., Bjerkeng, B., Engen-Skaugen, T., Magnusson, J., and Saelthun, N. R.: Linked models to assess the impacts of climate change on nitrogen in a Nor-wegian river basin and fjord system, Sci. Total Environ., 365, 200–222, 2006.
Kendall, M. G.: Rank correlation methods Charles Griffin, London, 1975.
Kopacek, J., Stuchlik, E., and Wright, R. F.: Long-term trends and spatial variability in nitrate leaching from alpine catchment – lake ecosystems in the Tatra Mountains (Slovakia-Poland), En-viron Pollut., 136, 89–101, 2005.
MacDonald, J. A., Dise, N. B., Matzner, E., Armbruster, M., Gun-dersen, P., and Forsius, M.: Nitrogen input together with ecosys-tem nitrogen enrichment predict nitrate leaching from European forests, Glob. Change Biol., 8, 1028–1033, 2002.
Mitchell, M. J., Piatek, K. B., Christopher, S., Mayer, B., Kendall, C., and McHale, P.: Solute sources in stream water during con-secutive fall storms in a northern hardwood forest watershed: A combined hydrological, chemical and isotopic approach, Bio-geochemistry, 78, 217–246, 2006.
Moldan, F., Kjonaas, O. J., Stuanes, A. O., and Wright, R. F.: In-creased nitrogen in runoff and soil following 13 years of exper-imentally increased nitrogen deposition to a coniferous-forested catchment at Gardsjon, Sweden, Environ. Pollut., 144, 610–620, 2006.
Rogora, M., Morchetto, A., and Mosello, R.: Trends in the trends of atmospheric deposition and surface waters in the Lago Maggiore watershed, Hydrol. Earth Syst. Sci., 5, 379–390, 2001,
http://www.hydrol-earth-syst-sci.net/5/379/2001/.
Salmi, T., M¨a¨att¨a, A., Anttila, P., Ruoho-Airola, T., and Amnell, T.: Detecting trends of annual values of atmospheric pollutants by the Mann-Kendall test and Sen’s slope estimates – the Excel template application MAKESENS no 31, FMI-AQ-31, Finnish Metereological Institute, Helsinki, 2002.
Schimel, J. P. and Bennett, J.: Nitrogen mineralization: Challenges of a changing paradigm, Ecology, 85, 591–602, 2004.
Sen, P. K.: Estimates of regression coefficients based on Kendall’s tau, J. Am. Stat. Assoc., 63, 1379–1389, 1968.
SFT: The Norwegian monitoring programme for long-range trans-ported air pollutants, Annual report – Effects 2004 Report 941/2005, The Norwegian Pollution Control Authority (SFT), Oslo, Norway, 2005.
Skjelkvale, B. L., Stoddard, J. L., Jeffries, D. S., Torseth, K., Hogasen, T., Bowman, J., Mannio, J., Monteith, D. T., Mosello, R., Rogora, M., Rzychon, D., Vesely, J., Wieting, J., Wilan-der, A., and Worsztynowicz, A.: Regional scale evidence for improvements in surface water chemistry 1990–2001, Environ. Pollut., 137, 165–176, 2005.
Solberg, S., Andreassen, K., Clarke, N., Torseth, K., Tveito, O. E., Strand, G. H., and Tomter, S.: The possible influence of nitro-gen and acid deposition on forest growth in Norway, Forest Ecol. Manag., 192, 241–249, 2004.
Tveito, O. E., Førland, E. J., Heino, R., Hanssen-Bauer, I., Alexandersson, H., Dahlstr¨om, D., Drebs, A., Kern-Hansen, C., J´onsson, T., Vaarby Laursen, E., and Westman, T.: Nordic tem-perature maps Klima Report no 09/00, Norwegian Metereologi-cal Institute, Oslo, 2000.
Ulrich, K. U., Paul, L., and Meybohm, A.: Response of drinking-water reservoir ecosystems to decreased acidic atmospheric de-position in SE Germany: Trends of chemical reversal, Environ. Pollut., 141, 42–53, 2006.
Vesely, J., Majer, V., and Norton, S. A.: Heterogeneous response of central European streams to decreased acidic atmospheric depo-sition, Environ. Pollut., 120, 275–281, 2002.
Vitousek, P. M.: Beyond Global Warming – Ecology and Global Change, Ecology, 75, 1861–1876, 1994.
Wright, R. F., Mulder, J., and Esser, J. M.: Soils in mountains and upland regions of southwestern Norway: nitrogen leaching and critical loads, NIVA-Report 4130-99, NIVA, Oslo, 1999. Wright, R. F., Alewell, C., Cullen, J. M., Evans, C. D., Marchetto,
A., Moldan, F., Prechtel, A., and Rogora, M.: Trends in nitrogen deposition and leaching in acid-sensitive streams in Europe, Hy-drol. Earth Syst. Sci., 5, 299–310, 2001,