HAL Id: hal-00304152
https://hal.archives-ouvertes.fr/hal-00304152
Submitted on 9 May 2008HAL is a multi-disciplinary open access
archive for the deposit and dissemination of sci-entific research documents, whether they are pub-lished or not. The documents may come from teaching and research institutions in France or abroad, or from public or private research centers.
L’archive ouverte pluridisciplinaire HAL, est destinée au dépôt et à la diffusion de documents scientifiques de niveau recherche, publiés ou non, émanant des établissements d’enseignement et de recherche français ou étrangers, des laboratoires publics ou privés.
Direct SW aerosol radiative forcing over Portugal
D. Santos, M. J. Costa, A. M. Silva
To cite this version:
D. Santos, M. J. Costa, A. M. Silva. Direct SW aerosol radiative forcing over Portugal. Atmospheric Chemistry and Physics Discussions, European Geosciences Union, 2008, 8 (3), pp.8585-8628. �hal-00304152�
ACPD
8, 8585–8628, 2008 SW aerosol radiative forcing over Portugal
D. Santos et al. Title Page Abstract Introduction Conclusions References Tables Figures ◭ ◮ ◭ ◮ Back Close
Full Screen / Esc
Printer-friendly Version
Interactive Discussion Atmos. Chem. Phys. Discuss., 8, 8585–8628, 2008
www.atmos-chem-phys-discuss.net/8/8585/2008/ © Author(s) 2008. This work is distributed under the Creative Commons Attribution 3.0 License.
Atmospheric Chemistry and Physics Discussions
Direct SW aerosol radiative forcing over
Portugal
D. Santos1, M. J. Costa1,2, and A. M. Silva1,2
1
Geophysics Centre of ´Evora, Univ. ´Evora, ´Evora, Portugal
2
Departament of Physics, Univ. ´Evora, ´Evora, Portugal
Received: 20 December 2007 – Accepted: 26 March 2008 – Published: 9 May 2008 Correspondence to: D. Santos ([email protected])
ACPD
8, 8585–8628, 2008 SW aerosol radiative forcing over Portugal
D. Santos et al. Title Page Abstract Introduction Conclusions References Tables Figures ◭ ◮ ◭ ◮ Back Close
Full Screen / Esc
Printer-friendly Version
Interactive Discussion Abstract
The estimation of radiative forcing due to desert dust and forest fires aerosols is a very important issue since these particles are very efficient at scattering and absorbing both short and longwave radiation. In this work, the evaluation of the aerosol radiative forcing at the top of the atmosphere over the south of Portugal is made, particularly in 5
the regions of ´Evora and of Cabo da Roca.
The radiative transfer calculations combine ground-based and satellite measure-ments, to estimate the top of the atmosphere direct SW aerosol radiative forcing. The method developed to retrieve the surface spectral reflectance is also presented, based on ground-based measurements of the aerosol optical properties combined with the 10
satellite-measured radiances.
The aerosol direct radiative effect is shown to be very sensitive to the underlying sur-face, since different surface spectral reflectance values may originate different forcing values. The results obtained also illustrate the importance of considering the actual aerosol properties, in this case measured by ground-based instrumentation, particu-15
larly the aerosol single scattering albedo, because different aerosol single scattering albedo values can flip the sign of the direct SW aerosol radiative forcing.
The instantaneous direct SW aerosol radiative forcing values obtained at the top of the atmosphere are, in the majority of the cases, negative, indicating a tendency for cooling the Earth. For Desert Dust aerosols, over ´Evora land region, the average 20
forcing efficiency is estimated to be −25 W/m2/AOT0.55 whereas for Cabo da Roca area, the average forcing efficiency is −46 W/m2/AOT0.55. In the presence of Forest Fire aerosols, over Cabo da Roca region, the average value of forcing efficiency is −28 W/m2/AOT0.55 and over ´Evora region an average value of −33 W/m2/AOT0.55 is found.
ACPD
8, 8585–8628, 2008 SW aerosol radiative forcing over Portugal
D. Santos et al. Title Page Abstract Introduction Conclusions References Tables Figures ◭ ◮ ◭ ◮ Back Close
Full Screen / Esc
Printer-friendly Version
Interactive Discussion 1 Introduction
Aerosols play a key-role in the atmosphere by increasing back-scattered solar radia-tion and by absorbing solar and longwave radiaradia-tion. They indirectly affect climate by changing the microphysical properties of clouds and their life span, thereby modify-ing the planetary albedo and precipitation regime. However, the limited information 5
on aerosol properties and dynamics, particularly in the troposphere, is a major uncer-tainty. In fact, the confidence in current climate change predictions is still very low (IPCC, 2007), thus warranting detailed investigation of aerosols.
Within Europe, Portugal is a unique location for aerosol studies because it is affected by contrasting air masses (Verver et al., 2000). Here, large unperturbed rural areas 10
co-exist with dense pollution-generating industrial and urban agglomerates. Maritime aerosols are a pervasive component of the regional atmosphere – particularly over land adjacent to the western and southern coasts, and the region is also affected by the long-range transport of anthropogenic aerosols emitted in northern Europe, and by desert dust plumes advected from Africa. Desert dust, and frequently during summer, 15
smoke from forest fires, account for a significant amount of the suspended particle mass. These particles are very efficient at scattering and absorbing both short and longwave radiation, being then of primary importance the estimation of radiative forcing due to aerosols.
Long-term monitoring is necessary for understanding climate change implications, 20
in particular to identify major aerosol types, to characterise their spatial and temporal distribution and their optical and physical properties, and to estimate their local and regional radiative forcing. In Portugal, long-term monitoring is being undertaken with measurements from ground-based instruments at ´Evora, extended with measurements from Cabo da Roca (Elias et al., 2006). The instrumental payload at ´Evora and Cabo 25
da Roca includes a multi-wavelength, angular-resolving sun/sky photometer (Silva et al., 2003).
forc-ACPD
8, 8585–8628, 2008 SW aerosol radiative forcing over Portugal
D. Santos et al. Title Page Abstract Introduction Conclusions References Tables Figures ◭ ◮ ◭ ◮ Back Close
Full Screen / Esc
Printer-friendly Version
Interactive Discussion ing at the top of the atmosphere (TOA) over the south of Portugal, particularly in the
regions of ´Evora and of Cabo da Roca, where ground-based measurements are taken. Special attention is given to significant aerosol events of desert dust and forest fires, which often occur in the territory, as described before.
The methodology is based on radiative transfer calculations combined with surface 5
and satellite measurements. The ground-based measurements of the aerosol optical properties provide the essential atmospheric characterization that combined with the satellite-measured radiance allow for the retrieval of the surface spectral reflectance, which is crucial for the irradiances calculations. When the surface characterization is achieved, the up welling shortwave irradiances are calculated, using the same atmo-10
spheric characterization (obtained from the ground-based measurements of aerosol properties). The TOA direct SW aerosol radiative forcing is then determined as be-ing the difference between the net irradiances obtained for an atmosphere loaded with aerosols and the net irradiances of a pristine atmosphere, in the shortwave spectral region. The net irradiances are given by the difference between the dowelling and up 15
welling shortwave irradiances at the top of the atmosphere (TOA).
The net radiative forcing at the TOA can be either positive or negative, depend-ing on several key parameters such as the surface spectral reflectance, aerosol sdepend-ingle scattering albedo and aerosol optical thickness (Tegen and Lacis, 1996; Liao and Sein-feld, 1998; Haywood and Boucher, 2000; Kaufman et al., 2002). The results obtained 20
substantiate these effects, illustrating also the importance of considering the actual aerosol properties, in this case measured by ground-based instrumentation, since dif-ferent aerosol types or long range transported aerosols mixing with already existing aerosols may alter their properties and originate different forcing magnitudes, some-times changing the signs. In the majority of the cases, the aerosol radiative forcing 25
values obtained are negative, indicating a tendency for cooling the Earth, at a local / regional scale.
ACPD
8, 8585–8628, 2008 SW aerosol radiative forcing over Portugal
D. Santos et al. Title Page Abstract Introduction Conclusions References Tables Figures ◭ ◮ ◭ ◮ Back Close
Full Screen / Esc
Printer-friendly Version
Interactive Discussion
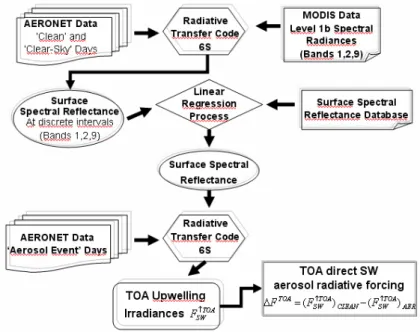
2 Methodology
The methodology developed to derive de surface spectral reflectance and to estimate the aerosol radiative forcing is described next. A block diagram of the method is pre-sented in Fig. 1.
2.1 Data and region of study 5
The Aerosol Robotic NETwork (AERONET) is a global ground-based network of sun/sky multiwavelenght radiometers that provide relatively long-term records of aerosol optical properties (Holben et al., 1998, 2001). In the region investigated in this study, data from the two stations, ´Evora (38.5 N, 7.9 W, 293 m a.m.s.l.) and Cabo da Roca (38.78 N, 9.5 W, 140 m a.m.s.l.), are available during years 2004 and 2005. 10
The CIMEL spectral radiometer measures the direct solar irradiances with a field of view of approximately 1.2◦ and sky radiances (at two different observing geometries), at four spectral channels (0.441, 0.675, 0.87 and 1.02 µm). Between morning and afternoon, direct solar radiances are measured, approximately every 15 min, and the aerosol optical thickness (AOT), estimated, according to AERONET’s official inversion 15
product (Dubovik and King, 2000). After using the proper calibrations and corrections, the estimated accuracy is between 0.01 and 0.02 (Holben et al., 1998). Sky radiance scans are made in 0.5◦ increments through the aureole up to 30◦ increments in the backscattered direction along solar principal plane and solar almucantar plane. An estimated absolute accuracy of 3 to 5% is set to the measured radiances (Dubovik et 20
al., 2000). AERONET data used in this work are level 1.5 of the volume particle size distribution (V(r)), the complex refractive index (m) and the AOT values at 0.441, 0.673 and 0.873 µm.
Satellite radiance measurements from the MODerate Imaging Spectroradiometer (MODIS) installed onboard the Earth Observing System Terra and Aqua satellites, are 25
used. MODIS has a viewing swath width of 2330 km, and scans the entire surface of the Earth in 36 spectral bands (from 0.4 to14 µm) (Barnes et al., 1998). The spectral
ACPD
8, 8585–8628, 2008 SW aerosol radiative forcing over Portugal
D. Santos et al. Title Page Abstract Introduction Conclusions References Tables Figures ◭ ◮ ◭ ◮ Back Close
Full Screen / Esc
Printer-friendly Version
Interactive Discussion bands used here are 434–448 nm, 620–670 nm and 841–876 nm. The spatial
resolu-tion is for the first spectral band of 1000×1000 m2and for the second and third spectral bands of 250×250 m2.
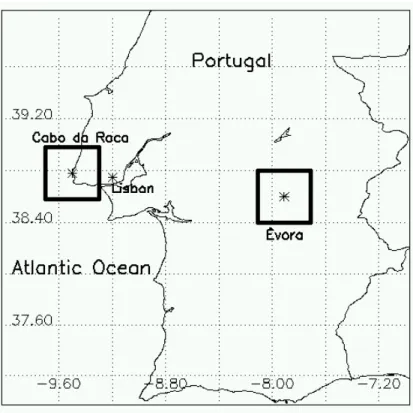
The study areas selected for this work are presented in the map of Fig. 2: ´Evora (150 km south-east of Lisbon) and Cabo da Roca (20 km west of Lisbon, on the Atlantic 5
Ocean west coast). The ´Evora site coincides with the first continental Portuguese Aerosol Robotic Network (AERONET) site, operating since 2002. Cabo da Roca, the second continental Portuguese AERONET site, operating since December 2003, is the continental western-most site in Europe.
2.2 Classification of the aerosol case studies 10
In order to interpret the optical measurements in terms of the aerosol origins, the 72-h air mass back-trajectories, ending over ´Evora and Cabo da Roca regions are calculated at three pressure levels, using HYSPLIT (HYbrid Single-Particle Lagrangian Integrated Trajectory) model available from the U. S. National Oceanic and Atmosphereic Admin-istration (NOAA) (Draxler and Hess, 1998). The pressure levels chosen are 970 hPa, 15
which represents the surface level, 850 hPa (at about 1.5 km height) corresponding to the characteristic boundary layer height, where the majority of aerosols are concen-trated in the absence of strong aerosol episodes, and 700 hPa (at about 3 km height) to take into account the long-range transport of particles (as Saharan desert dust).
The criteria used for aerosol classification is the same followed by Elias et al. (2006). 20
Threshold values are set, for different aerosol events, on the aerosol optical thick-ness (AOT) at 0.441 µm and 0.873 µm and on the ˚Angstr ¨om exponent (αc), be-tween 0.441 µm and 0.873 µm. The events considered are “Forest Fire” and “Ur-ban/Industrial”, when AOT0.441>0.30 and αc>1.0. The distinction between the “Forest Fire” and “Urban/Industrial” events is based on the corresponding air mass backward 25
trajectories. An aerosol event is classified as “Desert Dust” when AOT0.873>0.10 and
αc<1.0. A “Clean” situation is considered when AOT0.441<0.12 and AOT0.873<0.04 for any value of ˚Angstr ¨om exponent.
ACPD
8, 8585–8628, 2008 SW aerosol radiative forcing over Portugal
D. Santos et al. Title Page Abstract Introduction Conclusions References Tables Figures ◭ ◮ ◭ ◮ Back Close
Full Screen / Esc
Printer-friendly Version
Interactive Discussion Table1 shows the threshold values used for the aerosol events classification. “NC”
indicates no conditions on this quantity.
2.3 Retrieval of the surface spectral reflectance
The surface spectral reflectance is derived using MODIS satellite measurements in the following three spectral bands: 0.434–0.448 µm (band 9), 0.620–0.670 µm (band 5
1) and 0.841–0.876 µm (band 2) combined with radiative transfer calculations. As mentioned before, the spatial resolution of band 9 differs from that of bands 1 and 2 (1000×1000 m2 in the first case and 250×250 m2 for bands 1 and 2). MODIS band 9 images were linearly interpolated in-between pixels in order to obtain the spatial res-olution of bands 1 and 2 (250×250 m2). This is done assuming that the surface is 10
fairly homogeneous in each area of 1000×1000 m2 so that no important features are smoothed or accentuated by the procedure. These assumptions are rather true for the areas under study (Fig. 2) and provided that, in the case of Cabo da Roca, the pixels over land are totally separated from those over the ocean, since pixels over the ocean are not considered in the study. The surface spectral reflectance is then determined in 15
the three spectral intervals with the same spatial resolution of 250×250 m2.
Only “clear-sky” situations are considered, that is, no clouds are present in the regions of study. MODIS data are thus collected for typically “clear-sky” days. This selection is done through visual inspection of the MODIS RGB im-ages (http://modis-atmos.gsfc.nasa.gov/IMAGES/index.html) over the areas of study 20
(Fig. 2). On the other hand, the images used correspond to situations of very low aerosol loads in the atmosphere (“clean” days), as defined in Sect. 2.2. The aim of using “clean” and “clear-sky” atmospheric days is the reduction to a minimum of the impact that the atmospheric correction (due to aerosols) may have of the surface spec-tral reflectance retrievals. Gaseous absorption errors are reduced to a minimum since 25
no important gas absorption bands are present in the spectral regions where the sur-face reflectance is determined.
ACPD
8, 8585–8628, 2008 SW aerosol radiative forcing over Portugal
D. Santos et al. Title Page Abstract Introduction Conclusions References Tables Figures ◭ ◮ ◭ ◮ Back Close
Full Screen / Esc
Printer-friendly Version
Interactive Discussion et al., 1997a) is the radiative transfer code used to correct the satellite measured signal
for the atmospheric contribution and to model the TOA up welling and down welling ir-radiance values. This code can simulate satellite radiation measurements in cloudless atmospheres, between 0.25 and 4.0 µm, for a wide range of atmospheric and surface conditions (Vermote et al., 1997b). The computer calculations are made in ten dis-5
crete reference solar spectrum wavelengths (0.400, 0.488, 0.515, 0.633, 0.694, 0.860, 1.536, 2.250 and 3.750 µm), that correspond to the atmospheric windows used for re-mote sensing. Spectral integration is done with a spectral resolution of 2.5 nm. The 6S takes into account the atmospheric compounds considering 34 atmospheric levels distributed from the ground up to 100 km altitude, which is considered the TOA level. A 10
standard atmospheric profile typical of mid-latitude summer or winter, according to the case under study and the aerosol properties obtained at the two AERONET stations (see Sect. 2.1) are considered.
The aerosol optical quantities are retrieved from the volume particle size distribution (with 22 logarithmically equidistant bins from 0.05 to 15 µm) and from the complex re-15
fractive index m, both taken from the AERONET product (level 1.5), which are then used as input to Mie calculations, since aerosol particles are assumed to be spheri-cal (not necessarily true for desert dust aerosols). The AOT at 0.55 µm is obtained using the ˚Angstr ¨om exponent between 0.441 µm and 0.873 µm. The Mie calculations provide the phase function, the asymmetry factor, the single scattering albedo and the 20
scattering and extinction coefficients. These aerosol quantities are then used once more, to compute the up welling irradiance at the TOA, as well as the down welling and up welling irradiances at the surface level.
Since the atmospheric correction parameters are known, as well as the geometry and the satellite measured spectral radiance, the surface reflectance is determined, 25
with 6S radiative transfer code, considering the surface behaves as a Lambertian re-flector. The surface reflectance is thus obtained in the three spectral bands mentioned before (0.438–0.448 µm, 0.620–0.670 µm and 0.841–0.876 µm), with the spatial reso-lution of 250×250 m2.
ACPD
8, 8585–8628, 2008 SW aerosol radiative forcing over Portugal
D. Santos et al. Title Page Abstract Introduction Conclusions References Tables Figures ◭ ◮ ◭ ◮ Back Close
Full Screen / Esc
Printer-friendly Version
Interactive Discussion The surface spectral reflectance values obtained from MODIS data and 6S radiative
transfer code (0.438–0.448 µm, 0.620–0.670 µm and 0.841–0.876 µm) are compared with spectral reflectance curves typical of different surface types, contained on a sur-face spectral reflectance database – the USGS Digital Spectral Library (see online http://speclab.cr.usgs.gov/spectral-lib.html). The satellite derived surface spectral re-5
flectance values are compared with the spectral surface reflectance values from the USGS database and the curve that better reproduces the MODIS surface reflectance spectral behaviour is taken. Since the surface reflectance values obtained from MODIS and from the database for the three spectral bands are proportional, a linear relation is adjusted with the correlation coefficients varying between 0.91 and 0.99. The linear re-10
gression calculated allows for obtaining an adjusted curve, which permits an extension of the satellite derived spectral reflectance coverage from the three above mentioned spectral bands, to the whole visible spectral region (0.25–4.0 µm). The results obtained are presented in Sect. 3.1 (Figs. 3–6).
2.4 Assessment of the radiative forcing at the top of the atmosphere for different 15
aerosol type events
The aerosol characterization obtained from the AERONET sites ( ´Evora and Cabo da Roca), as well as the surface spectral reflectance retrieved, as explained in Sect. 2.3, are used to estimate the up welling shortwave (SW) irradiances at the top of the at-mosphere (FSW↑TOA). This is done according to the procedure described by Costa et 20
al. (2004) that allows for the calculation of the up welling shortwave irradiances emerg-ing at the TOA level (Eq.1):
F↑TOA SW = 4 Z 0.25 2π Z 0 +1 Z 0 Iλ(+µ, φ) .µ.d µ.d φ .d λ (1)
Where Iλ the monochromatic radiance in the zenith and azimuth directions is, µ is the cosine of the solar zenith angle and φ is the azimuthal angle. The irradiances are also 25
ACPD
8, 8585–8628, 2008 SW aerosol radiative forcing over Portugal
D. Santos et al. Title Page Abstract Introduction Conclusions References Tables Figures ◭ ◮ ◭ ◮ Back Close
Full Screen / Esc
Printer-friendly Version
Interactive Discussion calculated for a pristine atmosphere (AOT=0), in order to allow then for the calculation
of the radiative forcing induced by several aerosol types and loads (∆FTOA).
The instantaneous direct SW aerosol radiative forcing (∆F ) at the TOA, expressed in units of energy per unit time and area, is defined as:
∆FTOA= FAERnet TOA− Fnet TOA
CLEAN (2)
5
The first term on the right corresponds to the total net irradiance at the TOA that suf-fered an external perturbation due to aerosols and the second term to the total at-mospheric net irradiance at the same level that did not suffer the perturbation. For aerosol study purposes, the SW radiative forcing ∆FSW has been considered the most
adequate since the direct effects of these particles on the radiation field are mainly 10
connected to their interaction with sunlight through the scattering and sometimes ab-sorption processes. Hence, the shortwave radiative forcing due to an increase of the aerosol load in the atmosphere is here determined in the spectral region from 0.25 to 4.0 µm. Equation (2) can be rewritten in terms of the down welling and up welling shortwave irradiances as follows:
15
∆FSWTOA= (FSW↓TOA− F↑TOA
SW )AER−(F ↓TOA SW − F
↑TOA
SW )CLEAN (3)
Since the incident down welling irradiance at the TOA does not depend on aerosols, the TOA direct SW aerosol radiative forcing (DSWARF) can be finally written:
∆FSWTOA= (FSW↑TOA)CLEAN−(FSW↑TOA)AER (4) The instantaneous TOA DSWARF is calculated in this way and the results obtained are 20
presented in Sect. 3.2.
When studying the aerosol-radiation interactions, it is very useful to define the atmo-spheric forcing efficiency term, ∆Fe, in order to compare a quantity that is independent
of the aerosol load, depending thus only on the aerosol type and underlying surface. As expressed in Eq. (5), the ∆Feis simply the radiative forcing per unit aerosol optical
25
thickness: ∆Fe = ∆FSWTOA
.
ACPD
8, 8585–8628, 2008 SW aerosol radiative forcing over Portugal
D. Santos et al. Title Page Abstract Introduction Conclusions References Tables Figures ◭ ◮ ◭ ◮ Back Close
Full Screen / Esc
Printer-friendly Version
Interactive Discussion This term represents the effectiveness of the aerosol in perturbing the radiative
envi-ronment.
3 Results and discussion
3.1 Retrieval of the surface spectral reflectance
MODIS data are collected for typically “clean” (very low aerosol load) and “clear-sky” 5
(no clouds) days over the area of study illustrated in the map of Fig. 2. The days selected for the study, accordingly to the criteria explained in Sect. 2.2, as well as the satellite images used, are identified in Table 2.
The satellite derived surface reflectance values obtained in three spectral bands are extended to the whole visible range (from 0.25 to 4.0 µm) as explained in Sect. 2.3. 10
Tables 3 and 4 show the surface spectral reflectance values taken from the database (ρs), as well as the mean surface spectral reflectance values retrieved from MODIS spectral bands (0.438–0.448 µm, 0.620–0.670 µm and 0.841–0.876 µm) (ρs), aver-aged within the areas of study- ´Evora nearby rural region (20×20 km2 area) and Cabo da Roca land region (5×5 km2area), and the corresponding standard deviation values. 15
To note that, for all situations, more than 4000 ( ´Evora) and 250 (Cabo da Roca) pixels were considered for the average. The number differs from case to case because the pixels corresponding to concrete surfaces (cities and other urban spots) are not taken into account.
The satellite derived surface spectral reflectance values follow the spectral behaviour 20
of the surface reflectance curve taken from the database (Figs. 3 to 6). For ´Evora region, in the majority of the cases, the database reflectance values are within the error bars (standard deviation) of the MODIS derived surface spectral reflectance. As for Cabo da Roca area, some differences may arise since this is a coastline region, where the atmospheric correction may sometimes be problematic due to cloud and / 25
ACPD
8, 8585–8628, 2008 SW aerosol radiative forcing over Portugal
D. Santos et al. Title Page Abstract Introduction Conclusions References Tables Figures ◭ ◮ ◭ ◮ Back Close
Full Screen / Esc
Printer-friendly Version
Interactive Discussion used in the present study, introducing considerable errors in the aerosol inversions and
radiative transfer calculations.
The surface spectral reflectance is determined in the area of ´Evora, for winter and summer periods in 2004 (Table 3 and Fig. 3). In 2005, only the summer period is con-sidered to derive the surface spectral reflectance (Table 3 and Fig. 3). This is done 5
in order to allow for the study of strong aerosol events that occurred in that period. Although it doesn’t completely belong to that period, the September month is also included in the summer period since the surface spectral reflectance curve is approxi-mately the same as the curves considered in the summer months. The winter season, for 2005, is not considered at ´Evora site since on one hand, typically clean days (low 10
aerosol loads in the atmosphere) were cloud contaminated over the areas of study and on the other hand, no significant aerosol events occurred during this season. For Cabo da Roca region, during year 2004, both winter and summer periods are considered as well (Table 4 and Fig. 5). In 2005, the periods considered are spring and summer, with the September month included in the summer period once again because the surface 15
spectral reflectance curve for this month is very similar to the curves considered for the summer period (Table 4 and Fig. 6).
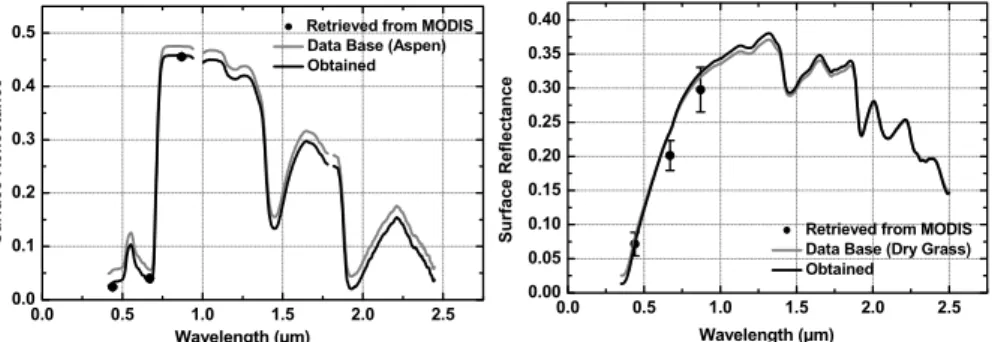
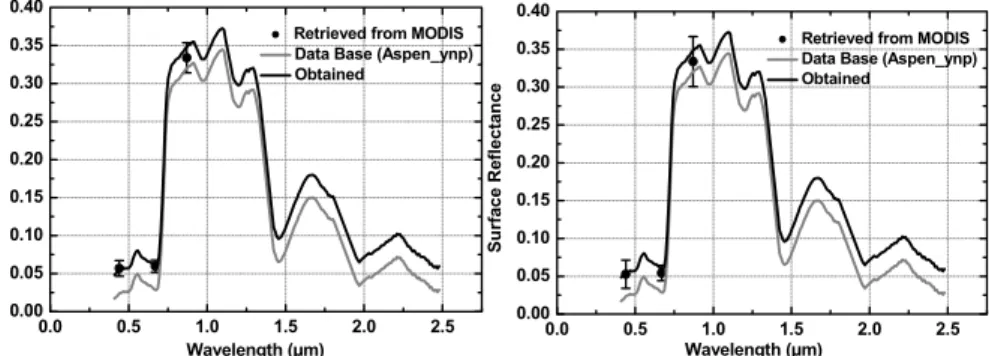
The graphs of Figs. 3 to 6 show the spectral reflectance obtained for ´Evora and Cabo da Roca surrounding land areas. The graphs include the satellite derived sur-face reflectance values in the three spectral bands mentioned before (0.434–0.448 µm, 20
0.620–0.670 µm and 0.841–0.876 µm) (black circles), as well as the spectral re-flectance curves taken from the database (grey line) and the best-fit curves (black line), obtained from the linear regression between the satellite derived surface spec-tral reflectance and the database specspec-tral reflectance values, explained previously in Sect. 2.3. For ´Evora land area in 2004, the winter surface reflectance is based on 25
the Aspen curve (Fig. 3) whereas for the two consecutive years (2004 and 2005) the summer surface reflectance is based on a dry grass curve (Fig. 4), both surface types present in the USGS database.
ACPD
8, 8585–8628, 2008 SW aerosol radiative forcing over Portugal
D. Santos et al. Title Page Abstract Introduction Conclusions References Tables Figures ◭ ◮ ◭ ◮ Back Close
Full Screen / Esc
Printer-friendly Version
Interactive Discussion differences from that in summer, as it can be observed in Fig. 3, which shows the results
obtained for ´Evora nearby rural area during winter and summer 2004.
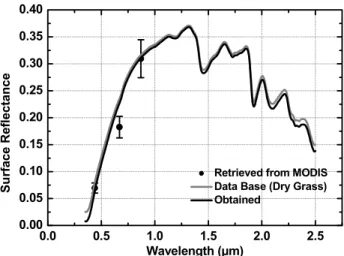
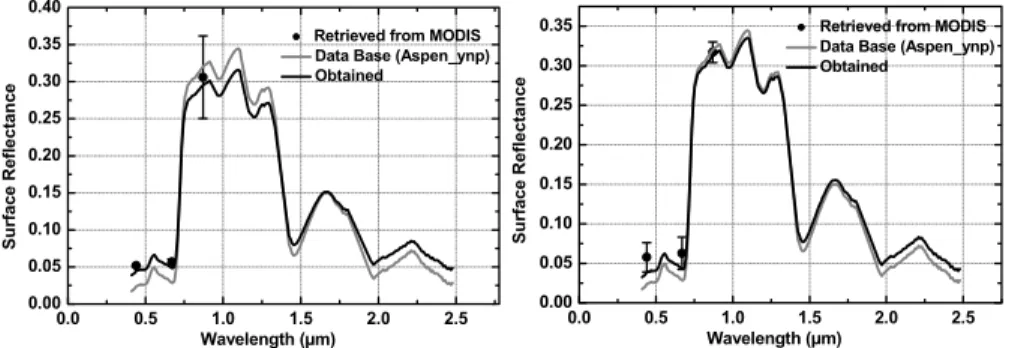
For ´Evora land area (Fig. 4), the curve obtained for the surface spectral reflectance during summer 2005, is based again on a dry grass curve (the same of summer 2004). For Cabo da Roca land area, the surface reflectance is, for all seasons in 2004 5
and 2005, based on the Aspen ynp spectral reflectance curve of the USGS database (Figs. 5 and 6).
An interesting feature of the spectral reflectance curves obtained for 2005 in Cabo da Roca (Fig. 6), is that these values overestimate the database surface spectral re-flectance values, whereas the same is not observed for 2004. This may be connected 10
to the fact that 2005 was a very dry year in continental Portugal, with very few pre-cipitation occurrences, classified as severe and extreme drought from January until September 2005, therefore, the vegetation suffered a change related to the increase of the surface spectral reflectance, which was not taken into consideration in this case, since the same database spectral reflectance values were considered both for 2004 15
and 2005 (Aspen type). This is noted for Cabo da Roca site, where precipitation plays a core role in the surface vegetation characteristics. ´Evora site is characterized by semi-arid surfaces, which leads to a lower impact of droughts in terms of changes in the surface spectral reflectance, in the summer season.
3.2 Assessment of the radiative forcing at the top of the atmosphere for different 20
aerosol type events
The instantaneous TOA DSWARF is calculated as described in Sect. 2.4. The ma-jor aerosol events that occurred in the regions of study were Forest Fires (FF) and Desert Dust (DD). However, the analysis of air mass backward trajectories, as well as the aerosol type classification criteria of Table 1, allowed for considering also the 25
Urban/Industrial (Urb) aerosol type for Cabo da Roca area, in 2004.
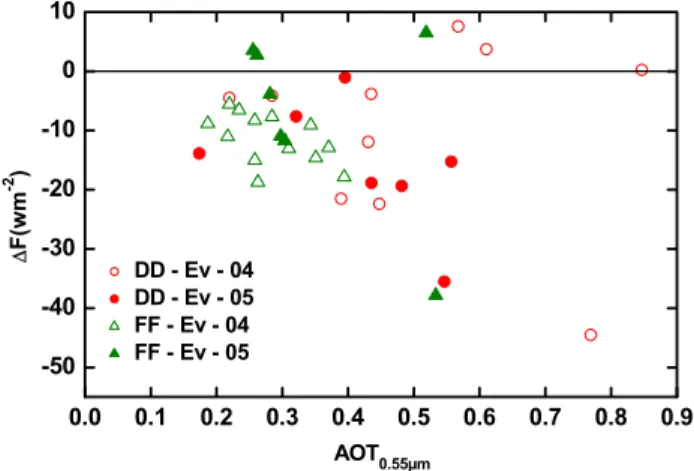
The results obtained for ´Evora land area (Fig. 7) during years 2004 and 2005, show that negative TOA DSWARF values are found in the majority of the cases, nevertheless
ACPD
8, 8585–8628, 2008 SW aerosol radiative forcing over Portugal
D. Santos et al. Title Page Abstract Introduction Conclusions References Tables Figures ◭ ◮ ◭ ◮ Back Close
Full Screen / Esc
Printer-friendly Version
Interactive Discussion three positive TOA DSWARF values are found for the Desert Dust aerosol and another
three cases for the Forest Fire aerosol type.
As for Cabo da Roca land area, results are shown in the graph of Fig. 8 during the same years for the Forest Fire, Desert Dust and Urban/Industrial aerosol types, the latter being considered only for year 2004. To note that, negative TOA DSWARF values 5
are always found for Desert Dust and Forest Fire aerosol types, thus contributing to a cooling effect at the TOA over Cabo da Roca land area. For Urban/Industrial aerosol type, both positive and negative TOA DSWARF values are found, although these values are very near zero.
The different TOA DSWARF values found for the same site and for the same aerosol 10
type may be associated with the presence of aerosols in the atmosphere with differ-ent scattering/absorbing capabilities (Haywood and Shine, 1995; Hansen et al., 1997; Russel et al., 2002; Elias et al., 2004; Costa, 2004 and Costa et al., 2006). Completely scattering aerosol particles induce a cooling effect, whereas absorbing aerosols lead to a warming effect (Satheesh, 2002). An aerosol property that can show the aerosol 15
capability of scattering/absorbing radiation is the single scattering albedo (SSA). The magnitude of the SSA can be considered as an index for the relative dominance of the scattering process with respect to absorption and its value can range from 0 (purely absorbing) to 1 (purely scattering) therefore, the knowledge of the SSA is crucial and even a small change in its estimation can flip the sign of TOA DSWARF as observed 20
and in agreement with other authors (Takemura et al., 2002).
In order to understand the different SSA values found for aerosols over ´Evora and over Cabo da Roca, the 72-h air mass back-trajectories at several altitudes (between 200 to 3000 m a.g.l.), ending in ´Evora and Cabo da Roca are also calculated using HYSPLIT model (see Sect. 2.2).
25
Another consideration that has to be made is the effect of the underlying surface by which, the aerosol forcing may change sign from negative (cooling) to positive (warm-ing) when the surface reflection is high (Liao et al., 1998; Satheesh, 2002). When aerosols are present over a land surface with high reflection, their impact on solar
ra-ACPD
8, 8585–8628, 2008 SW aerosol radiative forcing over Portugal
D. Santos et al. Title Page Abstract Introduction Conclusions References Tables Figures ◭ ◮ ◭ ◮ Back Close
Full Screen / Esc
Printer-friendly Version
Interactive Discussion diation is very significant because the radiation reflected from the surface below would
interact again with the aerosols present above.
The next three subsections explore three different situations found in this study, which illustrate the above considerations.
A discussion on the atmospheric forcing efficiency values obtained is made in the 5
last subsection.
3.2.1 Effect of aerosol absorption – Urban/Industrial aerosols
Considering the Urban/Industrial events occurred in Cabo da Roca land area in 2004, different signs of the TOA DSWARF values are found, although results are obtained for the same region (same surface spectral reflectance is used). This may be explained 10
through the analysis of the 72-h air mass back-trajectory calculations at 300, 1500 and 3000 m a.g.l., ending at Cabo da Roca region, corresponding to the two different situations (Fig. 9). The different signs of the TOA DSWARF are connected to the dif-ferences in the SSA values shown in Fig. 10. On 29 March, 13 April, 15 and 24 May, the TOA DSWARF values obtained present a negative sign, whereas on 17 and 18 15
May, the TOA DSWARF values are positive (see upper panel of Fig. 13). Based on the 72-h air mass back-trajectories, ending over Cabo da Roca region, it is possible to observe that for the days the TOA DSWARF present a negative sign (e.g. 13 April), the urban and industrial pollution particles travel from the North of Europe to the Atlantic ocean and penetrate into the Iberian Peninsula from the North before reaching Cabo 20
da Roca region (left graph of Fig. 9 as an example). On 17 and 18 May, when positive TOA DSWARF values are found, the urban and industrial particles travel from central Europe, pass the Mediterranean Sea and penetrate into the Iberian Peninsula coming from East (right graph of Fig. 9 only for 18 May) before reaching Cabo da Roca region. When the aerosol population arrives over Cabo da Roca region, it is constituted by a 25
mixture of pollution, maritime and continental aerosol types. These different paths fol-lowed by the aerosol particles and the different initial sources may explain the different SSA values obtained and shown in Fig. 10 for all above mentioned days. Moreover, the
ACPD
8, 8585–8628, 2008 SW aerosol radiative forcing over Portugal
D. Santos et al. Title Page Abstract Introduction Conclusions References Tables Figures ◭ ◮ ◭ ◮ Back Close
Full Screen / Esc
Printer-friendly Version
Interactive Discussion analysis of Fig. 10 shows that the urban / Industrial aerosol particles for 17 and 18 May,
which present positive TOA DSWARF values (upper panel of Fig. 13), have accordingly, lower SSA values, hence more absorbing than the urban / industrial aerosol particles found on the other days of the study, coming from North Europe but passing over the Atlantic Ocean, therefore mixing with the more scattering Sea Salt aerosols. For the 5
days presenting negative TOA DSWARF values (upper panel of Fig. 13), namely 29 March, 13 April, 15 and 24 May, SSA values are, accordingly, higher.
3.2.2 Effect of aerosol absorption – aged smoke aerosols
The different TOA DSWARF signs found for the Forest Fires aerosols reaching ´Evora are studied through the examination of the 72-h air mass back-trajectories at 200, 1400 10
and 2900 m AGL, ending at ´Evora (Fig. 11), as well as of the SSA values obtained for ´
Evora region as shown in Fig. 12. From the AERONET aerosol optical thickness values obtained for ´Evora, (and aerosol type classification presented in Table 1), as well as from the analysis of the back-trajectories of Fig. 11, it can be noted that, although the aerosol particles belong to the same type (Forest Fire), they originate in different 15
regions.
For 17, 18, 19 June and 10 July 2005, no information concerning fire occurrences was available, nevertheless the AERONET aerosol optical thickness values obtained for ´Evora and the aerosol type classification presented in Table 1, allowed to consider the “Forest Fire” aerosol type. The back-trajectory calculations, shown on the left graph 20
of Figs. 11 for 19 June, evidence that the aerosol particles coming to ´Evora at the lower levels are originated in central Spain, probably contaminated by the Forest Fires that were affecting those regions. The fires, in these cases, produced aerosols that are measured in ´Evora as being less absorbing (higher SSA as shown in Fig. 12) than the forest fire aerosols also measured in ´Evora that originated closer and travelled from 25
different paths, shown on the right graph of Fig. 11 (see below), in correspondence of the negative radiative forcing values (lower panel of Fig. 13).
For-ACPD
8, 8585–8628, 2008 SW aerosol radiative forcing over Portugal
D. Santos et al. Title Page Abstract Introduction Conclusions References Tables Figures ◭ ◮ ◭ ◮ Back Close
Full Screen / Esc
Printer-friendly Version
Interactive Discussion est Fire events started on 14 August 2005 on the north and central regions of
continen-tal Portugal, burning an extensive area and lasting a few days. These particles reached ´
Evora region (right graph of Fig. 11) and present lower spectral SSA (more absorbing) for 15, 16 and 20 August 2005, as shown in Fig. 12, than the particles travelling longer distances, which is the case of the fires occurring during June–July 2005 in Spain. The 5
forest fire aerosols originated in Portugal, being more absorbing originate the positive radiative forcing values (lower panel of Fig. 13). It is well known that the travel time of these aerosols is related to the ratio between elementary carbon and organic com-pounds (EC/OC) content, therefore interfering with their absorption properties (Reid et al., 1998; Andreae and Merlet, 2001; Eck et al., 2001). On the other hand, differ-10
ent ‘burned‘vegetation may cause different aerosol properties (Ramos, 2006), which could also explain the different aerosol single scattering albedo values and the cor-responding TOA DSWARF signs. Nevertheless, it is not expected that the vegetation types in the Iberian Peninsula differ that much, therefore the smoke from the forest fires suffered, most probably, an aging process when travelling from Spain to Portugal, be-15
coming less absorbing than the ones generated in Portugal, originating negative TOA DSWARF values.
3.2.3 Effect of Desert Dust absorption and of the underlying surface
The TOA DSWARF values normalized to the aerosol optical thickness at 550 nm (∆Fe–
Sect. 2.4), for a strong Desert Dust aerosol event that occurred from 23 to 25 July 2004, 20
are shown in the upper panel of Fig. 13. The comparisons of the instantaneous TOA DSWARF results obtained, due to this strong Desert Dust aerosol event, for ´Evora and Cabo da Roca land areas, show that opposite signs are observed: while over ´Evora the TOA DSWARF is slightly positive, a large negative value is obtained over Cabo da Roca.
25
As explained before, these different TOA DSWARF values may be associated with the effect of the underlying surface and with the aerosol absorbing potential. Based on the right graph of Fig. 3 and of Fig. 5 (corresponding to the summer period) and
ACPD
8, 8585–8628, 2008 SW aerosol radiative forcing over Portugal
D. Santos et al. Title Page Abstract Introduction Conclusions References Tables Figures ◭ ◮ ◭ ◮ Back Close
Full Screen / Esc
Printer-friendly Version
Interactive Discussion on Tables 3 and 4, it can be observed that the surface spectral reflectance in ´Evora
is higher than in Cabo da Roca (for example, in ´Evora ¯ρs,λ=0.67=0.20 and for Cabo da
Roca region ¯ρs,λ=0.67=0.06), therefore their impact on the down welling solar irradiance
is quite different.
The graph of Fig. 14 shows the SSA values obtained as a function of wavelength, for 5
the Desert Dust aerosols of the above mentioned episode reaching ´Evora and Cabo da Roca. To note that although the spectral behaviours are very similar, the aerosols in
´
Evora area present lower SSA values than aerosols in Cabo da Roca area, thus more absorbing than the ones over Cabo da Roca leading to a warming effect at the TOA.
From the 72-h air mass back-trajectories at 200, 1400 and 2900 m a.g.l., ending in 10
´
Evora (Fig. 15), it can be observed that the desert dust leaving the western African coast travel to the Atlantic ocean and penetrate in Europe passing over Cabo da Roca before reaching ´Evora. As Cabo da Roca is located in the vicinity of Lisbon and suf-fers the influence of the urban and industrial pollution from this city, as well as from the industrial surrounding region, Desert Dust aerosols may have mixed with the Ur-15
ban/Industrial aerosols already present in the region. The more scattering aerosols coming from the Sahara Desert and reaching Cabo da Roca become more absorb-ing, as they mix with other aerosols over the Great Lisbon area and penetrate into the Continent, about 150km, to arrive over ´Evora.
Thus in this case, apparently both the surface reflectance and the aerosol absorption 20
effects reflect in higher TOA DSWARF in ´Evora than in Cabo da Roca, where negative values are obtained, leading to a cooling effect at the TOA.
3.2.4 Atmospheric Forcing Efficiency
Figures 16 and 17 also show the relation between the AOT at 0.55µm and the TOA DSWARF values, where the slopes of the linear fittings can be interpreted as the aver-25
age forcing efficiencies (∆Fe–Sect. 2.4) respectively in Evora and Cabo da Roca land
ACPD
8, 8585–8628, 2008 SW aerosol radiative forcing over Portugal
D. Santos et al. Title Page Abstract Introduction Conclusions References Tables Figures ◭ ◮ ◭ ◮ Back Close
Full Screen / Esc
Printer-friendly Version
Interactive Discussion For Desert Dust aerosols, over Evora land region (considering only the TOA DSWARF
negative values), the forcing efficiency is estimated −41 Wm−2/AOT0.55 (Fig. 16) whereas for Cabo da Roca area the forcing efficiency is estimated −46 Wm−2/AOT0.55 (Fig. 17), being the absolute correlation coefficient values of 0.78 and 0.88, respec-tively. The forcing efficiency due to the Desert Dust aerosol type (considering all TOA 5
DSWARF values), is more pronounced for Cabo da Roca (−46 Wm−2/AOT0.55), the Atlantic Ocean west coast site, than for ´Evora (−25 Wm−2/AOT0.55), the inland site.
In the presence of Forest Fire aerosols, over Cabo da Roca region for the same two years, the forcing efficiency is estimated −28 Wm−2/AOT0.55with an absolute correla-tion coefficient value of 0.36 (Fig. 17). In ´Evora nearby rural area a forcing efficiency 10
of −44 Wm−2/AOT0.55 is found for the long distance forest fire aerosols (R=0.78), which is in agreement with the value found by Chistopher et al. (1999), who has es-timated a forcing efficiency of −43 Wm−2 /AOT0.55 due to Forest Fire aerosols over a grass land surface (comparable to the surface around ´Evora). When Urban/Industrial aerosol type is considered over Cabo da Roca area, the forcing efficiency is estimated 15
−19 Wm−2/AOT0.55, nevertheless with a very low correlation coefficient. Further inves-tigation is foreseen for this aerosol type in order to better assess its radiative effects.
4 Summary and conclusions
The main objective of this work was the assessment of the aerosol radiative forcing at the TOA in two regions of continental Portugal, ´Evora and Cabo da Roca, with different 20
surface reflectance properties and reached by different aerosol type events. A method to estimate the direct SW aerosol radiative forcing at the TOA was developed and applied to several aerosol situations. An intermediary objective of this work was the retrieval of the surface spectral reflectance for these selected regions from satellite spectral measurements.
25
The methodology developed to retrieve the surface spectral reflectance was consid-ered adequate since the satellite retrievals obtained fit well to the spectral reflectance
ACPD
8, 8585–8628, 2008 SW aerosol radiative forcing over Portugal
D. Santos et al. Title Page Abstract Introduction Conclusions References Tables Figures ◭ ◮ ◭ ◮ Back Close
Full Screen / Esc
Printer-friendly Version
Interactive Discussion curves obtained from the USGS database, allowing deriving the SW surface spectral
reflectance for ´Evora and Cabo da Roca land regions.
This work shows that the surface spectral reflectance as well as the aerosol single scattering albedo are very important parameters for determining the direct radiative forcing at the top of the atmosphere, and that Desert Dust and Forest Fire aerosols 5
play an important role in the radiation budget, at a local / regional scale. In the majority of the cases, the aerosol radiative forcing values obtained are negative, indicating a tendency for cooling the Earth.
The TOA forcing efficiency estimated is negative for all cases, indicating a cooling effect at the TOA. For the Desert Dust aerosol type the efficiency is more pronounced 10
for Cabo da Roca (−46 Wm−2/AOT0.55), the Atlantic Ocean west coast site, than for ´
Evora (−25 Wm−2/AOT0.55), the inland site. This large difference is related to the fact that occasionally Desert Dust aerosols penetrate in Europe through Cabo da Roca and on their way towards inland regions, they mix with pollution from Lisbon and surround-ing industrial regions becomsurround-ing more absorbsurround-ing. On the other hand, also the different 15
surface types characterizing both sites (higher surface spectral reflectance in ´Evora region) play an important part in the TOA forcing. Both effects probably combine and give origin to higher TOA DSWARF values in ´Evora, sometimes even positive.
As for the forest fire aerosols reaching ´Evora, the TOA DSWARF values are lower for longer distance fires, in correspondence of higher single scattering albedo proba-20
bly due to the rapid aging process that this type of particles suffer, altering their ab-sorption properties. If only the cooling effect is considered for longer distance fires, the radiative effect at the TOA due to forest fire aerosols in ´Evora nearby rural area (−44 Wm−2/AOT0.55) is in good agreement with the results obtained by another author (Chistopher et al.,1999) (−43 Wm−2/AOT0.55), considering that the surface type used 25
by this author (grass land) is comparable to the surface type around ´Evora.
Acknowledgements. The work was funded by the Portuguese FCT through projects
POCI/CTE-ATM/59773/2004 and PDCTE/CTA/49826/2003. The first author is supported by FCT through grant SFRH/BD/27870/2006.
ACPD
8, 8585–8628, 2008 SW aerosol radiative forcing over Portugal
D. Santos et al. Title Page Abstract Introduction Conclusions References Tables Figures ◭ ◮ ◭ ◮ Back Close
Full Screen / Esc
Printer-friendly Version
Interactive Discussion
The data used in this study were acquired as part of the NASA’s Earth Science Enterprise. The algorithms were developed by the MODIS Science Teams. The data were processed by the MODIS Adaptive Processing System (MODAPS) and Goddard Distributed Active Archive Center (DAAC), and are archived and distributed by the Goddard DAAC. We also thank the AERONET investigators and their staff for establishing and maintaining the sites used in this
5
investigation.
References
Andreae, M. and Merlet, P.: Emission of trace gases and aerosols from biomass burning, Glob. Biogeochem. Cy., 15, 955–966, 2001.
Barnes, W. L., Pagano, T. S., and Salomonson, V. V.: Prelaunch characteristics of the
MOD-10
erate Resolution Imaging Spectroradiometer (MODIS) on EOS-AM1, IEEE Trans. Geosci. Remote Sens., 36, 1088–1100, 1998.
Christopher, S. A., Li, X., Welch, R. M., Reid, J. S., Hobbs, P. V., Eck, T. F., and Holben, B.: Estimation of Surface and Top-of-Atmosphere Shortwave Irradiance in Biomass-Burning Regions during SCAR-B, J. Appl. Meteorol., 39, 1742–1753, 1999.
15
Costa, M. J.: Aerosol and cloud satellite remote sensing: monitoring and modelling using passive sensors. Ph.D. thesis, Dep. Physics, Univ. ´Evora, Portugal, 233 pp., 2004.
Costa, M. J., Silva, A. M., and Levizzani, V.: Aerosol Characterization and Direct Radiative Forcing Assessment over the Ocean. Part I: Methodology and Sensitivity Analysis, J. Appl. Meteorol., 43, 1799–1817, 2004.
20
Costa, M. J., Sohn, B. J., Levizzani, V., and Silva, A. M.: Radiative Forcing of Asian Dust Determined from the Synergized GOME and GMS Satellite Data–A Case Study, J. Meteorol. Soc. Jpn., 84, 85–95, 2006.
DGRF, Divis ˜ao de Defesa da Floresta contra inc ˆendios: Inc ˆendios Florestais Relat ´orio de 2005, 26 pp., 2006.
25
Draxler, R. R. and Hess, G. D.: An overview of the Hysplit 4 modelling system for trajectories, Aust. Meteorol. Mag., 47, 295–308, 1998.
Dubovik, O. and King, M.: A flexible inversion algorithm for retrieval of aerosol optical properties from Sun and sky radiance measurements, J. Geophys. Res., 105, 20 673–20 696, 2000. Dubovik, O., Smirnov, A., Holben, B. N., King, M., Kaufman, Y. J., Eck, T. F., and Slutsker, I.:
ACPD
8, 8585–8628, 2008 SW aerosol radiative forcing over Portugal
D. Santos et al. Title Page Abstract Introduction Conclusions References Tables Figures ◭ ◮ ◭ ◮ Back Close
Full Screen / Esc
Printer-friendly Version
Interactive Discussion
Accuracy assessment of aerosol optical properties retrieval from AERONET Sun and sky radiance measurements, J. Geophys. Res., 105, 9791–9806, 2000.
Eck, T. F., Holben, B., Sluster, I., and Setzer, A.: Characterization of the optical properties of biomass burning aerosols in Zambia during the 1997 ZIBBEE field campaign, J. Geophys. Res., 106, 3425–3448, 2001.
5
Elias, T., Silva, A. M., Figueira, M. J., Belo, N., Pereira, S., Formenti, P., and Helas, G.: Aerosol extinction and absorption in: ´Evora, Portugal, during the European 2003 summer heat wave. Remote Sensing of Clouds and the Atmosphere IX., edited by: Sch ¨afer, K. P., Comer ´on, A., Carleer, M. R., Picard, R. H., and Sifakis, N. I., Proceedings of the SPIE, 5571, 270–281, 2004.
10
Elias, T., Silva, A. M., Belo, N., Pereira, S., Formenti, P., Helas, G., and Wagner, F.: Aerosol extinction in a remote continental region of the Iberian Peninsula during summer, J. Geophys. Res., 111, D14204, doi:10.1029/2005JD006610, 2006.
Hansen, J. E., Sato, M., and Ruedy, R.: Radiative forcing and climate response. J. Geophys. Res., 102, 6831–6864, 1997.
15
Haywood, J. P. and Shine, K. P.: The effect of anthropogenic sulfate and soot aerosols on clear sky planetary radiation budget, Geophys. Res. Lett., 22, 603–606, 1995.
Haywood, J. and Boucher, O.: estimates of the direct and indirect radiative forcing due to tropospheric aerosols; a review. Rev. Geophys., 38, 513–543, 2000.
Holben, B., Eck, T. F., Slutsker, I., Tanre, D., Buis, J. P., Setzer, A., Vermote, E., Reagan, J.A.,
20
Kaufman, Y., Nakajima, T., Lavenu, F., Jankowiak, I, and Smirnov, A.: AERONET-A federated instrument network and data archived for aerosol characterization, Remote Sens. Environ., 66, 1–16, 1998.
Holben, B., N., Tanre, D., Smirnov, A., Eck, T. F., Slutsker, I., Abuhassan, N., Newcomb, W. W., Schafer, J., Chatenet, B., Lavenue, F., Kaufman, Y. J., Castle, J., Setzer, A., Markham, B.,
25
Clark, D., Frouin, R., Halthore, R., Karnieli, A., O’Neill, N. T., Pietras, C., Pinker, R.T., Voss, K., and Zibordi, G.: An emerging ground-based aerosol climatology: Aerosol optical depth from AERONET, J. Geophys. Res., 106, 12 067–12 097, 2001.
IPCC: Climate Change 2007: The Physical Science Basis. Contribution of Working Group I to the Fourth Assessment Report of the Intergovernmental Panel on Climate Change, Solomon,
30
S., Qin, D., Manning, M., Chen, Z., Marquis, M., Averyt, K. B., Tignor, M., and Miller, H. L. (eds.), Cambridge University Press, Cambridge, United Kingdom and New York, NY, USA, 996 pp., 2007.
ACPD
8, 8585–8628, 2008 SW aerosol radiative forcing over Portugal
D. Santos et al. Title Page Abstract Introduction Conclusions References Tables Figures ◭ ◮ ◭ ◮ Back Close
Full Screen / Esc
Printer-friendly Version
Interactive Discussion
Kaufman, Y. J., Tanr ´e, D., and Boucher, O.: A satellite view of aerosols in the climate system, Nature, 419, 215–223, 2002.
Liao, H. and Seinfeld, J. H.: Radiative forcing by mineral dust aerosols: sensitivity to key vari-ables, J. Geophys. Res., 103, 31 637–31 645, 1998.
Ramos A. M.: Modelac¸ ˜ao Num ´erica do Transporte de Poluentes Atmosf ´ericos em Portugal e
5
suas Relac¸ ˜oes com as Condic¸ ˜oes Meteorol ´ogicas. Ph.D. thesis, Dep. Physics, Univ. ´Evora, Portugal, 233 pp., 2006.
Reid, J. S. and Hobbs, P. V.: Physical and optical properties of young smoke from individual biomass fires in Brazil. J. Geophys. Res., 103, 32 013–32 031, 1998.
Russel, P. B., Redemann, J., Schmid, B., Bergstrom, R. W., Livingston, J. M., McIntosh, D. M.,
10
Ramirez, S. A., Hartley, S. A., Hobbs, P. V., Quinn, P. K., Carrico, C. M., Rood, M. J., Ostrom, E., Noone, K. J., von Hoyningen-Huene, W., and Remer, L.: Comparison of aerosol single scattering albedos derived by diverse technique in two North Atlantic experiments, J. Atmos. Sci., 59, 609–619, 2002.
Satheesh, S. K.: Aerosol radiative forcing over land: effect of surface and cloud reflection. Ann.
15
Geophys. 20, 2105–2109, 2002.
Silva, A. M., Costa M. J., Elias, T., Formenti, P., Belo, N., and Pereira, S.: Ground based aerosol monitoring at ´Evora, Portugal, Global Change Newsletter, 56, 6–9, 2003.
Takemura, T., Nakajima, T., Dubovik, O., Holben, B. N., and Kinne, S.: Single scattering albedo and radiative forcing of various aerosol species with a global three dimensional model, J.
20
Climate, 15, 333–352, 2002.
Tegen, I. and Lacis, A. A.: Modeling of particle size distribution and its influence on the radiative properties of mineral dust aerosol, J. Geophys. Res., 101, 19 237–19 244, 1996.
Vermote, E. F., Tanr ´e, D., Deuze, J.-L., Herman, M., and Morcrette, J.-J.,: Second simulation of the satellite signal in the solar spectrum: An overview, IEEE Trans. Geosci. Remote Sens.,
25
35, 675–686, 1997a.
Vermote, E. F., Tanr ´e, D., Deuze, J.-L., Herman, M., and Morcrette, J.-J.: Second simulation of the satellite signal in the solar spectrum: User guide Version 2, 218 pp., 1997b.
Verver, G., Raes, F., Vogelezang, D., and Johnson, D.: The 2nd Aerosol Characterization experiment: meteorological and chemical overview, Tellus, 52B, 126–140, 2000.
ACPD
8, 8585–8628, 2008 SW aerosol radiative forcing over Portugal
D. Santos et al. Title Page Abstract Introduction Conclusions References Tables Figures ◭ ◮ ◭ ◮ Back Close
Full Screen / Esc
Printer-friendly Version
Interactive Discussion
Table 1.Criteria for the classification of the aerosol events used in this work. “NC” indicates no conditions on this quantity.
Event type AOT0.441 AOT0.873 αc
Clean <0.12 <0.04 NC Forest Fire/ Urban >0.30 NC >1.0 Desert Dust NC >0.10 <1.0
ACPD
8, 8585–8628, 2008 SW aerosol radiative forcing over Portugal
D. Santos et al. Title Page Abstract Introduction Conclusions References Tables Figures ◭ ◮ ◭ ◮ Back Close
Full Screen / Esc
Printer-friendly Version
Interactive Discussion
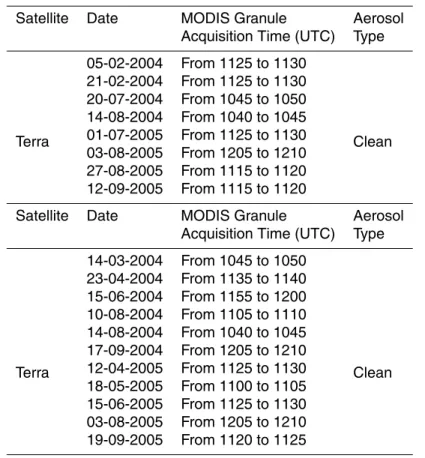
Table 2.MODIS granules used for the study.
Satellite Date MODIS Granule Aerosol Acquisition Time (UTC) Type
Terra 05-02-2004 From 1125 to 1130 Clean 21-02-2004 From 1125 to 1130 20-07-2004 From 1045 to 1050 14-08-2004 From 1040 to 1045 01-07-2005 From 1125 to 1130 03-08-2005 From 1205 to 1210 27-08-2005 From 1115 to 1120 12-09-2005 From 1115 to 1120
Satellite Date MODIS Granule Aerosol Acquisition Time (UTC) Type
Terra 14-03-2004 From 1045 to 1050 Clean 23-04-2004 From 1135 to 1140 15-06-2004 From 1155 to 1200 10-08-2004 From 1105 to 1110 14-08-2004 From 1040 to 1045 17-09-2004 From 1205 to 1210 12-04-2005 From 1125 to 1130 18-05-2005 From 1100 to 1105 15-06-2005 From 1125 to 1130 03-08-2005 From 1205 to 1210 19-09-2005 From 1120 to 1125
ACPD
8, 8585–8628, 2008 SW aerosol radiative forcing over Portugal
D. Santos et al. Title Page Abstract Introduction Conclusions References Tables Figures ◭ ◮ ◭ ◮ Back Close
Full Screen / Esc
Printer-friendly Version
Interactive Discussion
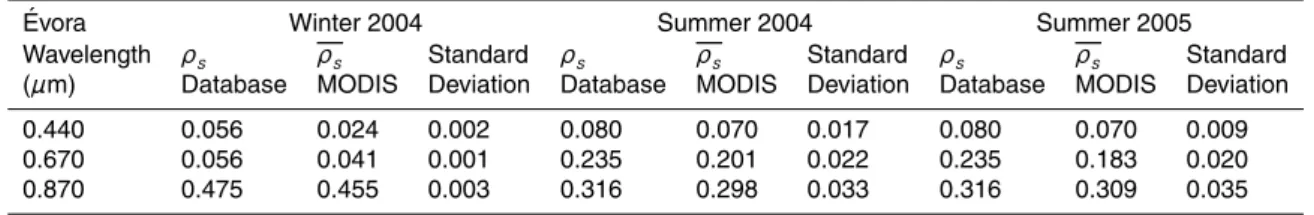
Table 3. Surface spectral reflectance obtained from the database and mean values retrieved from satellite measurements for ´Evora region, years 2004 and 2005.
´
Evora Winter 2004 Summer 2004 Summer 2005
Wavelength ρs ρs Standard ρs ρs Standard ρs ρs Standard
(µm) Database MODIS Deviation Database MODIS Deviation Database MODIS Deviation
0.440 0.056 0.024 0.002 0.080 0.070 0.017 0.080 0.070 0.009
0.670 0.056 0.041 0.001 0.235 0.201 0.022 0.235 0.183 0.020
ACPD
8, 8585–8628, 2008 SW aerosol radiative forcing over Portugal
D. Santos et al. Title Page Abstract Introduction Conclusions References Tables Figures ◭ ◮ ◭ ◮ Back Close
Full Screen / Esc
Printer-friendly Version
Interactive Discussion
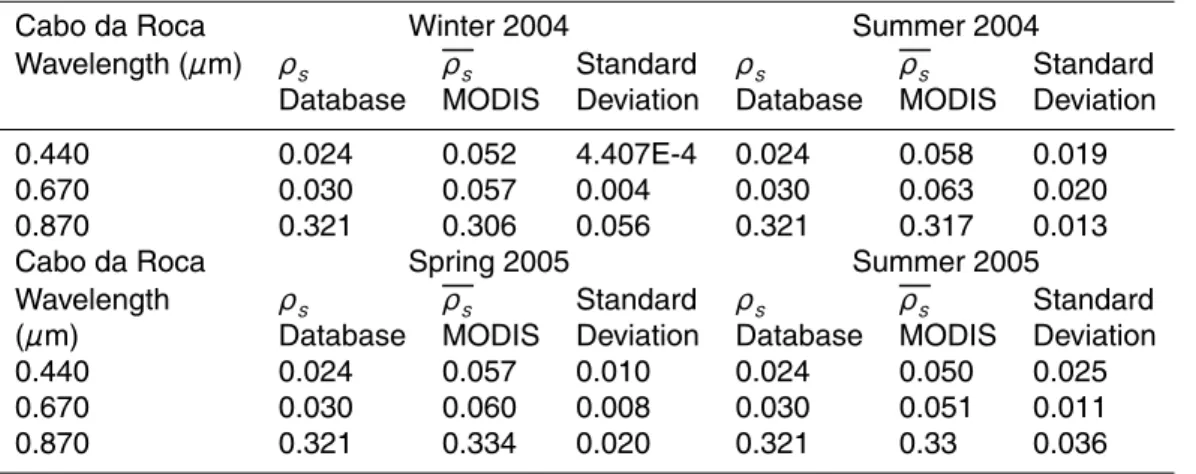
Table 4. The same as in Table 3 but for Cabo da Roca region, years 2004 (upper part) and 2005 (lower part).
Cabo da Roca Winter 2004 Summer 2004
Wavelength (µm) ρs ρs Standard ρs ρs Standard Database MODIS Deviation Database MODIS Deviation 0.440 0.024 0.052 4.407E-4 0.024 0.058 0.019 0.670 0.030 0.057 0.004 0.030 0.063 0.020 0.870 0.321 0.306 0.056 0.321 0.317 0.013 Cabo da Roca Spring 2005 Summer 2005
Wavelength ρs ρs Standard ρs ρs Standard (µm) Database MODIS Deviation Database MODIS Deviation 0.440 0.024 0.057 0.010 0.024 0.050 0.025 0.670 0.030 0.060 0.008 0.030 0.051 0.011 0.870 0.321 0.334 0.020 0.321 0.33 0.036
ACPD
8, 8585–8628, 2008 SW aerosol radiative forcing over Portugal
D. Santos et al. Title Page Abstract Introduction Conclusions References Tables Figures ◭ ◮ ◭ ◮ Back Close
Full Screen / Esc
Printer-friendly Version
Interactive Discussion
ACPD
8, 8585–8628, 2008 SW aerosol radiative forcing over Portugal
D. Santos et al. Title Page Abstract Introduction Conclusions References Tables Figures ◭ ◮ ◭ ◮ Back Close
Full Screen / Esc
Printer-friendly Version
Interactive Discussion
ACPD
8, 8585–8628, 2008 SW aerosol radiative forcing over Portugal
D. Santos et al. Title Page Abstract Introduction Conclusions References Tables Figures ◭ ◮ ◭ ◮ Back Close
Full Screen / Esc
Printer-friendly Version Interactive Discussion 0.0 0.5 1.0 1.5 2.0 2.5 0.0 0.1 0.2 0.3 0.4
0.5 Retrieved from MODIS
Data Base (Aspen) Obtained Su rf a c e R e fl e c ta n c e Wavelength (µm) 0.0 0.5 1.0 1.5 2.0 2.5 0.00 0.05 0.10 0.15 0.20 0.25 0.30 0.35 0.40 Wavelength (µm) Su rf a c e R e fl e c ta n c e
Retrieved from MODIS Data Base (Dry Grass) Obtained
Fig. 3.Surface spectral reflectance values: from the USGS database (grey line), retrieved from MODIS (black circles) and obtained combining the database with MODIS retrievals (black line) for ´Evora nearby rural area, during 2004 winter (left) and summer (right) periods.
ACPD
8, 8585–8628, 2008 SW aerosol radiative forcing over Portugal
D. Santos et al. Title Page Abstract Introduction Conclusions References Tables Figures ◭ ◮ ◭ ◮ Back Close
Full Screen / Esc
Printer-friendly Version Interactive Discussion 0.0 0.5 1.0 1.5 2.0 2.5 0.00 0.05 0.10 0.15 0.20 0.25 0.30 0.35 0.40
Retrieved from MODIS Data Base (Dry Grass) Obtained Wavelength (µm) Su rfa c e R e fl e c ta n c e
ACPD
8, 8585–8628, 2008 SW aerosol radiative forcing over Portugal
D. Santos et al. Title Page Abstract Introduction Conclusions References Tables Figures ◭ ◮ ◭ ◮ Back Close
Full Screen / Esc
Printer-friendly Version Interactive Discussion 0.0 0.5 1.0 1.5 2.0 2.5 0.00 0.05 0.10 0.15 0.20 0.25 0.30 0.35 0.40
Retrieved from MODIS
Data Base (Aspen_ynp) Obtained Wavelength (µm) Su rf a c e R e fl e c ta n c e 0.0 0.5 1.0 1.5 2.0 2.5 0.00 0.05 0.10 0.15 0.20 0.25 0.30
0.35 Retrieved from MODIS Data Base (Aspen_ynp) Obtained Wavelength (µm) Su rf a c e R e fl e c ta n c e
Fig. 5. Same as in Fig. 3 for Cabo da Roca land area, during 2004 winter (left) and summer (right) periods.
ACPD
8, 8585–8628, 2008 SW aerosol radiative forcing over Portugal
D. Santos et al. Title Page Abstract Introduction Conclusions References Tables Figures ◭ ◮ ◭ ◮ Back Close
Full Screen / Esc
Printer-friendly Version Interactive Discussion 0.0 0.5 1.0 1.5 2.0 2.5 0.00 0.05 0.10 0.15 0.20 0.25 0.30 0.35 0.40 Wavelength (µm) Su rf a c e R e fl e c ta n c e
Retrieved from MODIS Data Base (Aspen_ynp) Obtained 0.0 0.5 1.0 1.5 2.0 2.5 0.00 0.05 0.10 0.15 0.20 0.25 0.30 0.35 0.40 Wavelength (µm)
Retrieved from MODIS
Data Base (Aspen_ynp) Obtained Su rf a c e R e fl e c ta n c e
Fig. 6. Same as in Fig. 3 for Cabo da Roca land area, during 2005 spring (left) and summer (right) periods.
ACPD
8, 8585–8628, 2008 SW aerosol radiative forcing over Portugal
D. Santos et al. Title Page Abstract Introduction Conclusions References Tables Figures ◭ ◮ ◭ ◮ Back Close
Full Screen / Esc
Printer-friendly Version Interactive Discussion 0.0 0.1 0.2 0.3 0.4 0.5 0.6 0.7 0.8 0.9 -50 -40 -30 -20 -10 0 10 AOT0.55µm Δ F (w m -2 ) DD - Ev - 04 DD - Ev - 05 FF - Ev - 04 FF - Ev - 05
Fig. 7. Instantaneous TOA DSWARF versus aerosol optical thickness at 0.55 µm, over ´Evora (Ev) during 2004 (open symbols) and 2005 (solid symbols), in the presence of Desert Dust (DD) and Forest Fires (FF) aerosol types.
ACPD
8, 8585–8628, 2008 SW aerosol radiative forcing over Portugal
D. Santos et al. Title Page Abstract Introduction Conclusions References Tables Figures ◭ ◮ ◭ ◮ Back Close
Full Screen / Esc
Printer-friendly Version Interactive Discussion 0.0 0.2 0.4 0.6 0.8 1.0 1.2 -50 -40 -30 -20 -10 0 10 DD - CR - 04 DD - CR - 05 FF - CR - 04 FF - CR - 05 Urb - CR - 04 Δ F (w m -2 ) AOT0.55µm
Fig. 8. Same as in Fig. 7 but for Cabo da Roca land area considering also the presence of Urban (Urb) aerosol type.
ACPD
8, 8585–8628, 2008 SW aerosol radiative forcing over Portugal
D. Santos et al. Title Page Abstract Introduction Conclusions References Tables Figures ◭ ◮ ◭ ◮ Back Close
Full Screen / Esc
Printer-friendly Version
Interactive Discussion
Fig. 9. Air mass backward trajectories ending over Cabo da Roca region on 13 April (left) and 18 May 2004 (right).
ACPD
8, 8585–8628, 2008 SW aerosol radiative forcing over Portugal
D. Santos et al. Title Page Abstract Introduction Conclusions References Tables Figures ◭ ◮ ◭ ◮ Back Close
Full Screen / Esc
Printer-friendly Version Interactive Discussion 0.0 0.5 1.0 1.5 2.0 2.5 3.0 3.5 4.0 4.5 5.0 0.55 0.60 0.65 0.70 0.75 0.80 0.85 0.90 0.95 1.00 29 Mar 13 Abr 15 May 17 May 18 May 24 May SSA Wavelength (µm)
Fig. 10. Spectral aerosol single scattering albedo over Cabo da Roca land area, in the pres-ence of Urban/Industrial aerosols in Spring 2004.
ACPD
8, 8585–8628, 2008 SW aerosol radiative forcing over Portugal
D. Santos et al. Title Page Abstract Introduction Conclusions References Tables Figures ◭ ◮ ◭ ◮ Back Close
Full Screen / Esc
Printer-friendly Version
Interactive Discussion
Fig. 11. Air mass backward trajectories ending over ´Evora region on 19 June (left) and 16 August 2005 (right).
ACPD
8, 8585–8628, 2008 SW aerosol radiative forcing over Portugal
D. Santos et al. Title Page Abstract Introduction Conclusions References Tables Figures ◭ ◮ ◭ ◮ Back Close
Full Screen / Esc
Printer-friendly Version Interactive Discussion 0.0 0.5 1.0 1.5 2.0 2.5 3.0 3.5 4.0 4.5 5.0 0.55 0.60 0.65 0.70 0.75 0.80 0.85 0.90 0.95 1.00 17 Jun 18 Jun 19 Jun 10 Jul 15 Aug 16 Aug 20 Aug SS A Wavelength (µm)
Fig. 12. Spectral aerosol single scattering albedo over ´Evora land area, in the presence of Forest Fire aerosol events during Spring and Summer 2005.
ACPD
8, 8585–8628, 2008 SW aerosol radiative forcing over Portugal
D. Santos et al. Title Page Abstract Introduction Conclusions References Tables Figures ◭ ◮ ◭ ◮ Back Close
Full Screen / Esc
Printer-friendly Version
Interactive Discussion 10 Jun 27 Jun 13 Aug 16 Aug 19 Aug 22 Aug
-80 -60 -40 -20 0 20
27 Mar 24 Apr 22 May 20 Jul 22 Jul 24 Jul 26 Jul -80 -60 -40 -20 0 20 Δ F /A O T0 .5 5 µ m (w m -2) Day (2005) FF - Ev Δ F /A O T0 .5 5 µ m (w m -2) Day (2004) DD - Ev DD - CR Urb - CR
Fig. 13. Instantaneous TOA DSWARF values normalized to the AOT at 0.55 µm, for selected days, over ´Evora and Cabo da Roca land areas, for the desert dust and Urban/Industrial (upper panel) and forest fire (lower panel) aerosol types.