HAL Id: hal-00296369
https://hal.archives-ouvertes.fr/hal-00296369
Submitted on 6 Nov 2007
HAL is a multi-disciplinary open access
archive for the deposit and dissemination of
sci-entific research documents, whether they are
pub-lished or not. The documents may come from
teaching and research institutions in France or
abroad, or from public or private research centers.
L’archive ouverte pluridisciplinaire HAL, est
destinée au dépôt et à la diffusion de documents
scientifiques de niveau recherche, publiés ou non,
émanant des établissements d’enseignement et de
recherche français ou étrangers, des laboratoires
publics ou privés.
meteorological variables in Greece
D. Founda, D. Melas, S. Lykoudis, I. Lisaridis, E. Gerasopoulos, G.
Kouvarakis, M. Petrakis, C. Zerefos
To cite this version:
D. Founda, D. Melas, S. Lykoudis, I. Lisaridis, E. Gerasopoulos, et al.. The effect of the total solar
eclipse of 29 March 2006 on meteorological variables in Greece. Atmospheric Chemistry and Physics,
European Geosciences Union, 2007, 7 (21), pp.5543-5553. �hal-00296369�
www.atmos-chem-phys.net/7/5543/2007/ © Author(s) 2007. This work is licensed under a Creative Commons License.
Chemistry
and Physics
The effect of the total solar eclipse of 29 March 2006 on
meteorological variables in Greece
D. Founda1, D. Melas2, S. Lykoudis1, I. Lisaridis2, E. Gerasopoulos1, G. Kouvarakis3, M. Petrakis1, and C. Zerefos1
1National Observatory of Athens, Institute for Environmental Research and Sustainable Development, Greece 2Aristotle University of Thessaloniki, Physics Department, Laboratory of Atmospheric Physics, Thessaloniki, Greece 3University of Crete, Chemistry Department, Environmental and Chemical Processes Laboratory, Crete, Greece
Received: 21 June 2007 – Published in Atmos. Chem. Phys. Discuss.: 23 July 2007 Revised: 19 October 2007 – Accepted: 22 October 2007 – Published: 6 November 2007
Abstract. This paper examines the effect of the total solar eclipse of 29 March 2006 on meteorological variables across Greece. Integrated micrometeorological measurements were conducted at Kastelorizo, a small island within the path of totality, and other sites within the Greek domain, with vari-ous degrees of solar obscuration. The observations showed a dramatic reduction in the incoming global radiation and sub-sequent, pronounced changes in surface air temperature with the lowest temperature values occurring about 15 min after the full phase. The amplitude of the air temperature drop was not analogous to the obscuration percentage but was prin-cipally determined by the surrounding environment (mainly the sea influence), the background meteorological conditions and local cloudiness. Surface wind-speed decreased in most sites as a result of the cooling and stabilization of the atmo-spheric boundary layer. This perturbation provided a unique opportunity to apply a sensitivity analysis on the effect of the eclipse to the Weather Research and Forecast (WRF) nu-merical mesoscale meteorological model. Strong anomalies, not associated with a dynamic response, were simulated over land especially in surface air temperature. The simulated temperature drop pattern was consistent with the observa-tions.
1 Introduction
The event of a solar eclipse has been always very attractive to meteorologists for studying the response of the atmosphere under the specific conditions of an abrupt change (turn off and on) of the incident solar radiation. A number of stud-ies during solar eclipses include observations of meteorolog-ical variables such as air and soil temperature, solar
irradi-Correspondence to: D. Founda
ance, humidity, wind speed and direction and report drastic changes in the mean meteorological parameters within the surface layer, associated with the eclipse event (e.g. Ander-son et al., 1972; Antonia et al., 1979; Fernandez et al., 1993, 1996; Anderson 1999; Hanna, 2000; Zanis et al., 2001; Zere-fos et al., 2001). Changes in the heat and momentum fluxes within the boundary layer during an eclipse are discussed by Antonia et al. (1979) and Szalowski (2002), while Eaton et al. (1997) and Krishnan et al. (2004) provided evidence for the diminishing of the turbulence processes.
Surface temperature changes during a solar eclipse are of broad interest since it is a variable strongly experienced by the observers. In general, the temperature drop becomes noticeable when the sun is about half-covered (Anderson, 1999), although some observers have reported an immedi-ate temperature response (Anderson et al., 1972; Szalowski, 2002) and others (Narasimha et al., 1982) a response after the fourth contact (end of the eclipse). The pattern and am-plitude of the temperature drop is different for each location and can vary from less than one to several degrees depending on many factors. The percentage of sun coverage, the lati-tude, the season and time of the day, the synoptic conditions, the height of measurements, the climatic and other local fea-tures (e.g. topography, vegetation, soil conductivity) account for the different patterns of the temperature fluctuations dur-ing a solar eclipse. The time lag between the occurrence of the temperature minimum and the totality (or maximum par-tiality) is a result of the thermal inertia of the air and the ground, in a similar way that the diurnal temperature maxi-mum on a clear day does not coincide with the zenith of the sun but occurs some hours later (Fernandez et al., 1993).
Wind is perhaps the most disputable variable concerning the meteorological effects of a solar eclipse. Although the ef-fect of the eclipse on the wind is connected with the alleged appearance of an “eclipse wind” at the late stages, there is no doubt that this “eclipse wind” is rather an enhanced wind
Fig. 1. Measurement sites within Greek territory and the totality
zone (shaded area). The domains used for WRF simulations are also shown.
chill effect and as Anderson (1999) wrote “. . . Subjective im-pressions in the highly emotional moments leading up to and through totality are also likely to encourage the persistence of this story. . . ”. Recent observations, indicate a deceleration of the mean wind flow during a solar eclipse (e.g. Fernandez et al., 1993, 1996; Dolas et al., 2002; Krishnan et al., 2004; Stoev et al., 2005) and this is attributed to the combined ef-fect of the decrease of the thermal gradient, the stabilization of surface layer following the drop of temperature and the suppression of turbulent processes, in a similar way that wind speed decreases after sunset. Eaton et al. (1997) reported no effects on the variability of the mean wind speed and ver-tical momentum flux in New Mexico during the partial so-lar eclipse of 10 May 1994, but detected a decrease in the variance of the three wind speed components. Krishnan et al. (2004), detected pronounced eclipse-induced changes in turbulent and spectral characteristics of the wind at Ahmed-abad (S. India) during the eclipse of 11 August 1999. On a local scale, orographic winds can form and be noticeable if synoptic situation allows it (Fernandez et al., 1993; Ander-son, 1999).
Although the effects most readily available for observa-tions concern local, micrometeorological parameters, the lu-nar shadow can also contribute to noticeable changes in me-teorological parameters in mesoscale (Szalowski, 2002). Un-der this perspective, a number of studies describe the simu-lated changes of the eclipse on meteorological variables us-ing numerical modelus-ing or other theoretical procedures (e.g. Gross and Hense, 1999; Ahrens et al, 2001; Vogel et al., 2001; Eckermann et al., 2007).
Despite the large number of studies concerning eclipses, the event of a solar eclipse is always unique since it happens
at different seasons, different time of the day, different lo-cations and under different synoptic conditions. A total solar eclipse took place on 29 March 2006. The path of the moon’s umbra started in Brazil and traversing the Atlantic, northern Africa and central Asia it ended up in northern Mongolia. A detailed description of the eclipse path and additional in-formation is presented in the Overview paper of this Spe-cial Issue by Gerasopoulos et al. (2007)1. Kastelorizo, a small Greek island near the coast of southern Turkey, was found within the totality path and at a distance of 50 km to the NW from the central line of the eclipse. Total eclipse at Kastelorizo occurred at local noon (10:53 UTC).
Aiming at the study of the effects of the eclipse on sur-face layer meteorological parameters, field experiments were conducted at Kastelorizo and other sites of partial obscura-tion in southern, central and northern Greece. In order to simulate the changes on meteorological variables during the eclipse, a numerical modeling approach was adopted using the Weather Research and Forecast (WRF) model. Since more pronounced anomalies on meteorological variables are expected to occur over land and an extended part of the do-main selected for simulation is water covered (Aegean sea), it has been a real challenge to simulate the effects of the eclipse in this study area.
2 Experimental and background conditions 2.1 Measurement sites – instrumentation
The measurement sites selected within the Greek territory are shown in Fig. 1, where the umbral path is also shown. Table 1 includes information on eclipse circumstances and obscuration at each site (see also Gerasopoulos et al., 20071). The measurements site at Kastelorizo was located on the seashore of a small bay to the east of the island. The loca-tion is blocked from south to west by a cliff steeping 100 m up about 200 m away from the seashore covered with bushes and isolated trees. To the north and northeast, lies the moun-tainous SW Turkish coast, with ridges up to 1500 m high, within 12 km from the island, and massives with peak over 2500 m at a range closer than 50 km.
The meteorological variables at Kastelorizo were moni-tored with a portable automatic weather station consisting of the following sensors (resolution/accuracy in parentheses): an electronic pressure sensor (0.1 hPa), an electronic thermo-hygrometer (0.1◦C, 1%) equipped with a radiation shield placed at 2 m above the ground, a pyranometer (0.3 W m−2), a pyrheliometer (0.2 W m−2), as well as a cup anemome-ter and a wind vane installed 6 m above the ground. Addi-tionally, a 3-D sonic anemometer (0.01 ms−1)was installed nearby (height 2 m) recording the u-v-w wind components
1Gerasopoulos, E., Zerefos, C. S., Tsagouri, I., et al.: The to-tal Solar Eclipse of March 2006: Overview, Atmos. Chem. Phys. Discuss., to be submitted, 2007.
at a frequency of 21 Hz. Similar instrumentation (except for sonic anemometer) is used at all other stations.
The Finokalia station is located at the north-eastern coast of Crete island on a hill 250 m a.s.l. To the north the station is open to the sea and the surrounding area is covered with sparse short vegetation. Wind was measured at 3 m a.g.l. A detailed description of the site can be found in Mihalopoulos et al. (1997).
The broader Athens area is represented by more than one stations. Meteorological and actinometric data from the two routinely running stations of the National Observatory of Athens (NOA) at Thission (center of Athens, 107 m a.s.l.) and Penteli (to the north of Athens, 495 m a.s.l.) were anal-ysed. Wind at NOA’s stations is measured at 10 m a.g.l. Also, the stations of the Athens International Airport (AIA) located at a flat semi-rural area to the east of Athens were used. The meteorological station at Thessaloniki (northern Greece) is located in the center of the city, inside the University campus surrounded by sparse buildings and trees. Wind is measured at 10 m a.g.l., while there are also soil temperature data at the depths of 10 cm and 20 cm.
All data are recorded every 1 min except for meteorologi-cal data from Thessaloniki which are recorded every 5 min.
Additional temperature data (recorded every 20 min) were collected from the meteorological stations of the Hellenic National Meteorological Service (HNMS) at the airports of the islands of Rhodes (SE Greece), Karpathos (SE Greece) and Iraklion (Crete).
2.2 Background conditions
A general pattern characterized by a pronounced low pres-sure system to the north (over Central and North Europe) and high pressures to the south of Greece (over North Africa) pre-vailed during the days before and after the eclipse resulting to moderate W’ly winds over most of the country. A detailed description of the synoptic conditions during the eclipse and relevant maps are presented in the Overview paper (Gera-sopoulos et al., 20071).
In general, clear sky conditions prevailed at the southern stations (Kastelorizo and Finokalia) during the pre-eclipse day while partly cloudy conditions prevailed over central Greece, mainly from Ci and Cs, which progressively in-creased to 8 octals by the end of the day. The morning of the eclipse day was bright at Kastelorizo and Finokalia but soon thin Ci developed first to the W and later to the other direc-tions which obscured occasionally the sun during the eclipse. At the early stages of the event, Cu and Ac had also formed but did not obscure substantially the sun until the late stages when clouds became thicker. In the broader Athens area, cloud cover averaged 8 octals (Ci, Cs) early in the morn-ing of the eclipse day but progressively decreased to 6 octals during the event, allowing the sun to be visible through the thinner clouds. Increased cloudy conditions prevailed at all stations on the day after the eclipse.
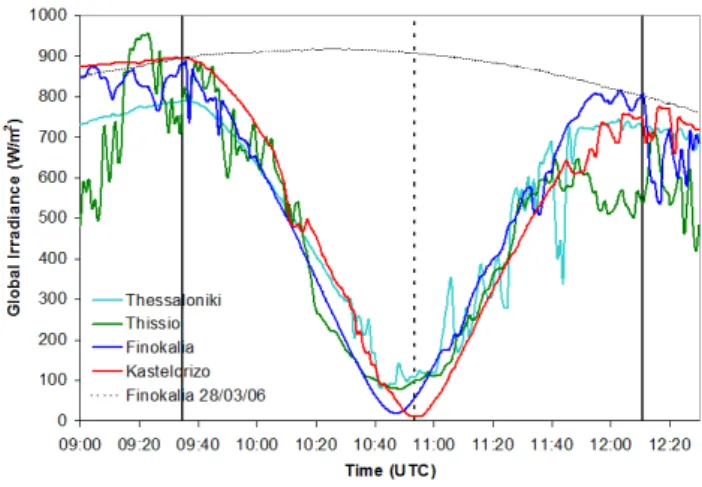
Fig. 2. Temporal variation of the global radiation (1-min resolution)
during the eclipse hours at various stations of different partiality. Vertical lines denote the onset, maximum and end of the eclipse at Kastelorizo.
During the days of interest, the maximum air tempera-ture across Greece ranged from 17◦C to 23◦C (from N to S), while minimum temperature ranged from 10◦C to 14◦C, respectively.
3 Analyses and results 3.1 Observations 3.1.1 Global radiation
The temporal variation of global radiation during the eclipse for various stations of different solar obscuration (Kastelorizo, Finokalia, Thission-Athens and Thessaloniki) is shown in Fig. 2. In the same figure, the global radiation course of the pre-eclipse clear day at Finokalia is also plotted. A dramatic reduction of the incoming solar radiation during the eclipse event was recorded at all sites. An immediate response of solar radiation was observed at Kastelorizo just after the first contact (beginning of the eclipse). Global radi-ation decreased progressively as the sun was being obscured from 894 W m−2 (1st contact) to near zero during the total phase. The global radiation started to increase again after the 3rd contact (end of the total phase) and reached the value of 734 W m−2 by the end of the eclipse. The smaller scale fluctuations before the end of the eclipse at Kastelorizo were due to the thick clouds prevailing at that time. At all sites, global radiation did not regain its pre-eclipse value due to the combined effect of the natural decrease of the solar elevation angle and the increased cloud obscuration. At Finokalia, the global solar radiation decreased from 887 to 19 W m−2(98% reduction). Over Athens area (84% partiality) cloudy condi-tions (Ci, Cs) prevailed during the event, and this is reflected to the smaller scale fluctuations of global radiation in Fig. 2.
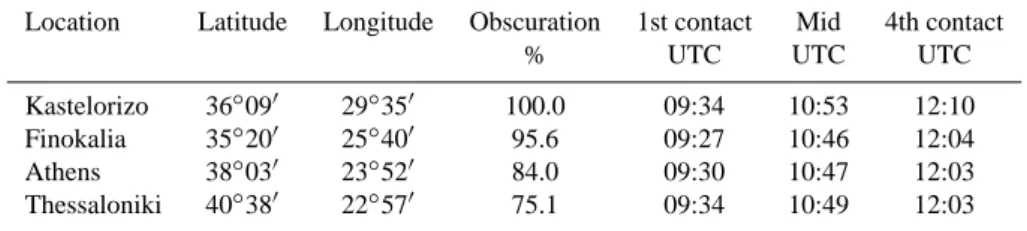
Table 1. Information on observation sites: Position, obscuration, eclipse circumstances.
Location Latitude Longitude Obscuration 1st contact Mid 4th contact
% UTC UTC UTC
Kastelorizo 36◦09′ 29◦35′ 100.0 09:34 10:53 12:10
Finokalia 35◦20′ 25◦40′ 95.6 09:27 10:46 12:04
Athens 38◦03′ 23◦52′ 84.0 09:30 10:47 12:03
Thessaloniki 40◦38′ 22◦57′ 75.1 09:34 10:49 12:03
Fig. 3. Diurnal variation of 10-min surface temperature readings
at several observation sites during the eclipse day. Vertical lines denote the onset, maximum and end of the eclipse at Kastelorizo.
Solar radiation continued to increase for several minutes af-ter the first contact since the effect of cloudiness variation overruled the eclipse effect. An average reduction of 92% in the incoming solar radiation was measured in Athens stations with the minimum value coinciding with mid-eclipse, while Thessaloniki (75% partiality) experienced a 89% reduction of the global radiation during the event due to the added ef-fect of cloudiness. In general, the observed decrease of the incoming solar radiation during the eclipse was proportional to the percentage of solar coverage.
3.1.2 Air temperature and relative humidity
The 10-min time series of the temperature measured at the different sites during the eclipse day are shown in Fig. 3. Some small gaps at the Finokalia temperature plot are due to occasional operational problems of the temperature sen-sor. Although the temperature drop followed a similar gen-eral pattern at almost all stations as evident from Fig. 3, the special characteristics of the temperature changes are differ-ent to each location.
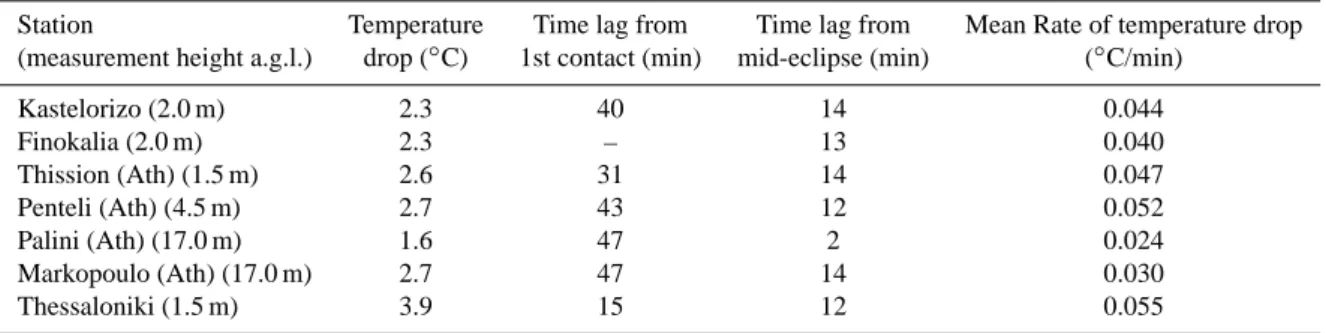
Table 2 includes the amplitude, the mean rate of the tem-perature drop as well as the time lag of the temtem-perature response with respect to the first contact and time lag of the minimum temperature occurrence with respect to
mid-eclipse for all the stations where 1-min readings were avail-able (5-min at Thessaloniki). The observed amplitude of the temperature drop varied from 1.6◦C (Pallini-Athens) to 3.9◦C (Thessaloniki) being within the range already reported during other solar eclipses (Segal et al., 1996; Anderson, 1999; Hanna, 2000). Since the eclipse occurred during the hours of the normal temperature increase, the “effective” temperature depression induced by the eclipse should be even larger. Using as reference the temperature march dur-ing the pre-eclipse day at the stations of Thission and Penteli (Athens), it was estimated that the effective temperature drop induced by the eclipse should be about 0.5◦C larger than the recorded one.
As stated in the previous section, the global radiation de-crease was proportional to the obscuration percentage. How-ever, this was not the case for the observed temperature changes. Even though the southern stations (Kastelorizo and Finokalia) experienced the larger obscuration (Table 1), the respective temperature drop (2.3◦C) was not the maximum observed. These are island stations and consequently are sur-rounded by sea, which minimizes the temperature response due to its larger heat capacity. Furthermore, at Kastelorizo an increase of the wind speed which took place about 40 min after the first contact, may have partly blocked the temper-ature from falling at lower levels. It is worth noting here that the subjective feeling of cooling at Kastelorizo was much stronger. This is related to the delay of the human nervous system to react to sudden temperature changes resulting to a destabilization of the thermal energy balance of the body for some time (Fernandez et al., 1993), but also to a pro-nounced wind chill effect due to the sudden increase of the wind speed.
Despite the smaller sun obscuration (84%) and the larger amount of cloud coverage at the Athens stations, the tem-perature changes were on average larger compared to the changes observed at the southern stations. This can be mainly attributed to the less pronounced effect of the sea in-fluence at Athens – compared to the southern areas – since large part of the surrounding environment is land covered with high orographic features. Thessaloniki (75% obscura-tion) experienced the most pronounced temperature (3.9◦C). A number of reasons have accounted for this remarkable re-sponse: first, the temperature response after 1st contact was
Table 2. Surface temperature drop at various sites of different obscuration during the eclipse. The mean rate of temperature drop as well as
the time lags from 1st contact and mid-eclipse are also shown.
Station Temperature Time lag from Time lag from Mean Rate of temperature drop (measurement height a.g.l.) drop (◦C) 1st contact (min) mid-eclipse (min) (◦C/min)
Kastelorizo (2.0 m) 2.3 40 14 0.044 Finokalia (2.0 m) 2.3 – 13 0.040 Thission (Ath) (1.5 m) 2.6 31 14 0.047 Penteli (Ath) (4.5 m) 2.7 43 12 0.052 Palini (Ath) (17.0 m) 1.6 47 2 0.024 Markopoulo (Ath) (17.0 m) 2.7 47 14 0.030 Thessaloniki (1.5 m) 3.9 15 12 0.055
faster at Thessaloniki – compared to the southern and cen-tral stations – (Fig. 3) following the solar radiation response. The low wind speed which prevailed at Thessaloniki dur-ing the eclipse did not allow mixdur-ing of the surface air and thus contributed to the faster temperature drop. Another im-portant reason is the obscuration of the sun from low, thick clouds which formed about one hour after the beginning of the eclipse at a height of about 250 m (Amiridis et al., 2007) evident also from the global radiation curve (Fig. 2). The added effect of the thick clouds obscuration at Thessa-loniki has led to the faster temperature drop after 10:30 UTC (Fig. 3). Other climatic features could have also contributed to the larger amplitude of temperature drop observed at Thes-saloniki (it was estimated that the long-term diurnal tempera-ture range on that calendar day at Thessaloniki is larger than that at Athens).
Additional temperature data (recorded every 20 min at 1.5 m a.g.l.) from the coastal meteorological stations at the airports of Rhodes (SE Greece), Karpathos (SE Greece) and Iraklion (Crete) indicated eclipse induced changes of the or-der of 2◦C in agreement with observations at Kastelorizo and Finokalia.
Temperature started to drop several minutes after the first contact. The actual time lag is related to the thermal inertia of the surface layer (Aplin and Harrison, 2002) although it is also subject to the prevailing conditions (e.g. cloudiness, wind etc) effect. The observed time lag ranged between 15 min (Thessaloniki) and 47 min (Markopoulo and Palini) (Table 2). At the Athens stations, temperature continued its increasing march for more than 30 min after the beginning of the event, subject also to cloudiness fluctuations as stated in the previous section. The faster rate of temperature fall in Athens area was observed at Penteli which is an elevated station (495 m a.s.l.), in a similar way that temperature falls faster at higher altitudes after sunset, while at Thessaloniki, the temperature drop accelerated after 10:30 UTC due to the combined effect of the eclipse and thick clouds as stated above. A time lag ranging from 2 to 15 min was observed between the mid-eclipse and the occurrence of the minimum
Fig. 4. Temporal variation (5-min resolution) of soil temperature at
the depths of 10 cm and 20 cm at Thessaloniki along with surface air temperature and relative humidity variations. Vertical lines denote the onset, maximum and end of eclipse at Kastelorizo.
temperature. Typical values of this lag are of the order of 20 min (Anderson, 1999). At Markopoulo (Athens), the tem-perature (17 m a.g.l.) retained its minimum value for about 20 min before recovering. At the Athens stations, temper-ature continued to increase after the end of the eclipse and reached its maximum value about one hour later, following the typical diurnal march (Fig. 3). However, at Kastelorizo the temperature did not regain its pre-eclipse values due to the increased cloudiness and wind conditions that prevailed after the eclipse.
The response of the soil temperature (available only at Thessaloniki) was another interesting feature of the eclipse effect. In Fig. 4, the temporal variation of the soil temper-ature at depths 10 and 20 cm are shown, along with surface air temperature and relative humidity. The normal diurnal course of soil temperature at both depths is slowing down for the period between mid-eclipse and the last contact, af-ter which it resumes its normal march. Relative humidity is expected to increase during the eclipse as a consequence of
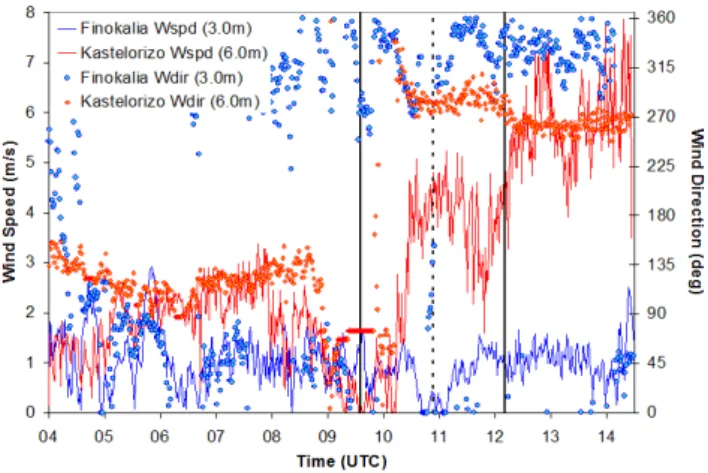
Fig. 5. Diurnal variation of wind speed and wind direction at Kastelorizo and Finokalia stations on 29 March 2006. Vertical lines denote the onset, maximum and end of eclipse at Kastelorizo.
the temperature decrease. Relative humidity at Thessaloniki increased from 72% to 96% following closely the tempera-ture drop. At Kastelorizo, relative humidity increased from 63% to 86% following the time response of temperature, while other stations experienced less pronounced changes (not shown here).
3.1.3 Wind speed
Figure 5 presents the variation of the wind speed and di-rection at Kastelorizo and Finokalia during the eclipse day. The morning of the eclipse day at Kastelorizo was charac-terized by low SE’ly winds which dropped to negligible val-ues some time before the beginning of the event. The ob-servers at Kastelorizo experienced a quite abrupt change in wind speed and direction during the partial phase before to-tality. As shown in Fig. 5, the wind direction changed sud-denly from E’ly to NW’ly (and later on to W’ly) following an anticlockwise direction, about 40 min after the first con-tact accompanied by a progressive increase of wind speed which reached a maximum around totality. Wind speed ex-hibited then a slight decreasing trend until 20 min before the fourth contact when it started to recover again and increased even more during the hours following the event.
Some observers have reported a change of the wind direc-tion towards the direcdirec-tion of the shadow modirec-tion during the total phase (Dolas et al., 2002; Stoev et al., 2005). Aplin and Harrison (2002) found changes in the wind direction at first contact, which followed a cyclonic structure (Clayton, 1901), while wind returned to the expected synoptic direc-tion just after the fourth contact. At Kastelorizo however, the wind turned to NW’ly direction about 40 min before to-tal phase and continued to blow from this direction during the hours following the eclipse while the wind speed kept increasing after the fourth contact. The change of the wind flow at Kastelorizo was possibly determined by a
combina-Fig. 6. Residuals of the wind speed (1wind speed) at Kastelorizo
during the eclipse hours. Vertical lines denote the onset, maximum and end of eclipse at Kastelorizo.
tion of the synoptic situation and other enhanced due to the eclipse local circulations (e.g. an enhanced sea-land breeze). According to observations at all stations of the studied area (and some other neighboring stations), the surface pressure started to decrease about one hour before the first contact and continued its decreasing march during the whole event. Ob-servations of surface pressure are in accordance with NOAA (http://www.arl.noaa.gov/ready/disclaim.html) surface pres-sure maps. The changes of the surface prespres-sure gradient dur-ing the eclipse did not reveal any pattern which could be at-tributed to the eclipse event.
Although mean flow changes at Kastelorizo were not principally determined by the eclipse event, there was ev-idence of a change in the “gustiness” of the wind related to the eclipse. Figure 6 shows the small scale fluctuations (1wind speed) of the wind speed during the eclipse hours at Kastelorizo. These small scale fluctuations are expressed as the residuals obtained by subtracting a 4th order polynomial fit from the 1-min time series of the wind speed. Despite the increase of the mean flow observed during the partial phase before totality (Fig. 5), the magnitude of the fluctuations of the wind became significantly smaller for about 20 min be-fore and after the total phase. The straight lines in Fig. 6 represent the levels of the standard deviation of the residuals for three separate time intervals, 09:34–10:34 UTC, 10:35– 11:11 UTC and 11:12–12:11 UTC. Clearly, the small scale variability of the wind speed during the second time inter-val (around totality) is significantly smaller compared to the other two time intervals. The decrease of the wind gustiness around totality can be attributed to the depression of turbu-lence mechanisms due to the cooling of the air and this is in full agreement with other observations (Krishnan et al., 2004; Eaton et al., 1997; Anfossi et al., 2004), which reported a less turbulent wind during solar eclipses. Analysis of inten-sive measurements from the sonic anemometer (beyond the
scope of this paper), reconfirm the significant reduction of the turbulent kinetic energy around totality.
The pattern of the wind at Finokalia (Fig. 5) reveals a max-imum eclipse centered symmetric pattern. The very low N winds which prevailed before and after the beginning of the event dropped to zero a few minutes before and after maxi-mum partiality indicating a complete depression of the mean flow, which next regained its initial values.
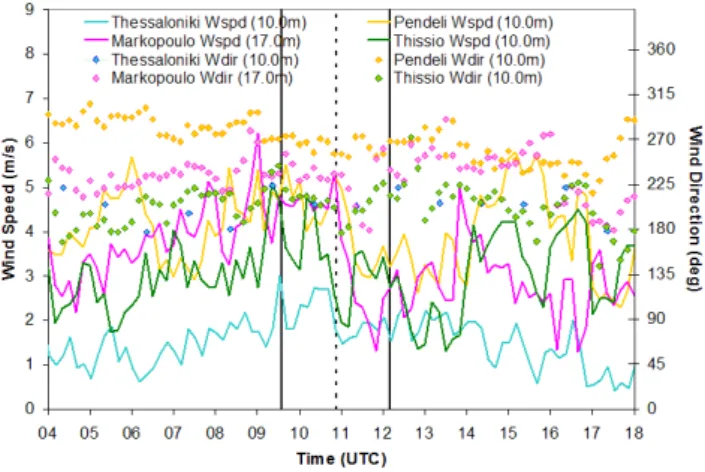
At the Athens stations (Thission, Penteli, Markopoulo), the low W’ly winds which prevailed during the pre-eclipse hours increased progressively after the sunrise according to the typical diurnal pattern (Fig. 7). Wind speed did not change considerably until few minutes before the maximum phase when it started to decrease without any significant change in direction. In the same figure, the temporal vari-ation of wind speed and direction at Thessaloniki is shown, where a decrease of wind speed is also obvious after mid-eclipse. A similar behavior of the wind speed during the total eclipse of 11 July 1991 in Costa Rica, was attributed to the decrease of the thermal gradient in the mesoscale and synoptic scale due to the temperature decrease (Fer-nandez et al., 1993), while stabilization of the atmosphere accounted for wind speed decrease in Paraguay during the eclipse of 3 November 1994 (Fernandez et al., 1996). Ac-cording to lidar observations conducted in Athens and Thes-saloniki (Amiridis et al., 2007) there is evidence of a decrease of the atmospheric boundary layer height during the eclipse hours, indicating a suppression of convectional and turbu-lence mechanisms similar to that during the hours following sunset. In Athens, wind speed recovers about two hours after the end of eclipse following the temperature variation, which reached its maximum daily value at that time following the natural daily course (Fig. 3). This was not the case for Thes-saloniki where temperature did not recover and nor did wind speed.
3.2 Model simulations 3.2.1 The WRF model
The numerical simulations were carried out using the Weather Research and Forecast (WRF) model, version 2.1.2, which has been under development, for the past few years, by the National Center for Atmospheric Research (NCAR), the National Oceanic and Atmospheric Administration (NOAA), the National Centers for Environmental Prediction (NCEP) and other research groups.
Using the capability of WRF for multiple nesting, the model ran for six domains (Fig. 1). The large domain has 30 km resolution extending from 31◦to 46◦N and 15◦ to 35◦E. The second domain covers the broader area of Greece, the southern Balkan Peninsula and western Turkey with 10 km resolution. Finally, four finer domains were se-lected over the areas of Athens (domain 3), Thessaloniki (do-main 4), Finokalia (do(do-main 5) and Kastelorizo (do(do-main 6)
Fig. 7. Wind speed and direction variations at the Athens and
Thes-saloniki stations during the eclipse day. Vertical lines denote the onset, maximum and end of eclipse at Kastelorizo.
with 2 km horizontal grid increment. In order to avoid “spin-up” problems with the model, the simulation was initiated at 18:00 UTC, 28 March 2006 and finished at 00:00 UTC, 30 March 2006. The necessary initial and boundary condi-tions were produced using the Global Final (FNL) Analyses on 1.0×1.0 degree grids covering the entire globe every six hours.
All six domains used by the WRF modeling system have the same vertical structure consisting of 31 σ -levels extend-ing from 1000 to 100 hPa. The followextend-ing model parameteri-zations have been chosen to simulate atmospheric physics:
– The Monin-Obukhov (Eta) scheme for surface layer physics (Monin and Obukhov, 1954; Janjic, 1990, 1994),
– the Mellor-Yamada-Janjic TKE scheme for turbulence in the PBL and in the free atmosphere (Janjic, 1990, 1994),
– the Ferrier (new Eta) microphysics scheme was used in order to simulate atmospheric microphysics’ procedure (Ryan, 1996),
– the Rapid Radiative Transfer Model – RRTM (Mlawer, 1997) scheme was used as solver for processes having to do with long wave radiation and the Dudhia scheme (Dudhia, 1989) for the short wave. In this specific case the radiation module ran every 5 min due to the fact that parameterization of the eclipse was inserted in this mod-ule as will be described below.
3.2.2 Parameterization of the eclipse
There were three major obstacles in the effort to simulate the eclipse and its effects in the atmosphere using a meteorolog-ical modeling system:
Fig. 8. Short wave radiation reaching the surface at three grid
points, one in the centre of Athens (37.975◦, 23.732◦)and the
oth-ers at Kastelorizo (36.015◦, 29.583◦)and Thessaloniki (40.633◦,
22.950◦)for the non-eclipse (control) and eclipse runs. Observed
global radiation data at Thission (centre of Athens), Kastelorizo and Thessaloniki are also shown. Vertical lines denote the onset, maxi-mum and end of eclipse at Kastelorizo.
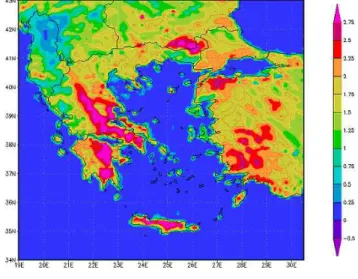
Fig. 9a. Difference of air temperature at 2m between non-eclipse
(control) and eclipse run at 10:00 UTC in domain 2 (Greece).
1. To insert the eclipse path into model’s subroutines in a way that it would only affect a specific area on Earth’s surface according to the time of the day.
2. To reproduce the percentage of the eclipse correspond-ing to the latitude and longitude of each grid point of the six domains.
3. To simulate the reduction of solar insolation depending on the time of the day.
The problem of simulating the eclipse was solved by varying the solar constant used to drive the WRF’s schemes. The variation was each time proportional to the distance from the
Fig. 9b. As in Fig. 9a, but at 11:00 UTC.
Fig. 9c. As in Fig. 9a, but at 12:00 UTC.
center of the shadow, which in this way was considered as a circle moving on Earth with a specific velocity. Every time the radiation scheme was called (set every 5 min) the distance of each grid point from the centre of the shadow was used in a formula which calculated the reduction of solar constant and thus the solar insolation. The obscuration in the large domain began at 09:30 UTC and ended at 13:30 UTC.
In order to investigate the effects caused by the eclipse on meteorological parameters, the WRF modeling system ran twice, once with the moving umbra of the Moon in radiation schemes, and once with the original radiation solver. 3.2.3 Simulated effects of the eclipse
Solar radiation response
As expected, the radiation flux was the variable which was first affected by the eclipse. Figure 8, presents the simulated
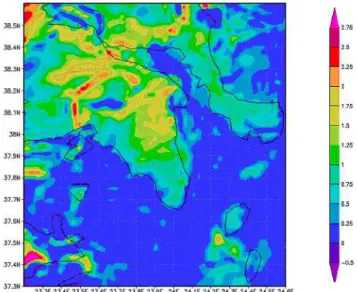
Fig. 10a. Difference of air temperature at 2 m between non-eclipse
(control) and eclipse run at 10:00 UTC in domain 3 (Athens).
and observed time series of global solar radiation reaching the earth’s surface at three selected grid points of different obscuration across Greece: one in the center of Thessaloniki (northern Greece), another one in the center of Athens (cen-tral Greece) and a third at Kastelorizo (southern Greece). Re-sults are derived for the control (no-eclipse) and the eclipse run at a 30-min time step. In the control run of WRF, global solar radiation follows the expected diurnal path. A pro-nounced reduction of the incoming shortwave radiation was simulated at all selected sites during the eclipse hours. The percentage of reduction was proportional to the obscuration percentage. At the southern site (Kastelorizo) the simulated decrease of the solar irradiance between 09:30–11:00 UTC was 92%, in very close agreement with the observed (95%). The corresponding simulated reduction at the central and northern sites were 75% and 72%, respectively. The ob-served reduction for the same time interval at these sites was higher (84% at Athens and 85% at Thessaloniki) due to the added effect of cloudiness.
Temperature and wind response
Due to the changes in radiation fluxes, a surface temperature response is expected. The area averaged amplitude of surface temperature response due to the eclipse was found to be up to 0.9◦C at 11:30 UTC for domain 3 (Athens area) and up to 0.7◦C at 11:30 UTC for the domain 2 (Greece). The effect of the eclipse in both cases was minimized by the sea, which occupied a large part of the domains selected for simulation. The temperature anomalies between the control and eclipse runs at 10:00 UTC, 11:00 UTC and 12:00 UTC are illustrated in Figs. 9a–c and 10a–c for domains 2 (Greece) and 3 (Athens), respectively.
Fig. 10b. As in Fig. 10a, but at 11:00 UTC.
Fig. 10c. As in Fig. 10a, but at 12:00 UTC.
At 10:00 UTC, the simulated temperature response is no-ticeable mainly over southern Greece with more pronounced anomalies over mountainous areas. A significant temperature anomaly is observed over Greece and Athens at 11:00 UTC (Figs. 9b, 10b) which – according to observations – is very close to the time of the minimum temperature occurrence at most of the stations. The simulated temperature response at 11:00 UTC over land areas of domain 3 is of the order of 2.7◦C (depending on the distance from the sea) which is in perfect agreement with observations at the Athens stations. At 12:00 UTC larger anomalies are observed to the north-east of the country (Fig. 9c) following the eclipse evolution while in Athens area (Fig. 10c) the anomalies decrease as temperature has recovered substantially near the end of the
Fig. 11. Variation of temperature at 2 m at a grid point in the centre
of Athens for the non-eclipse (control) and eclipse runs. Observed temperature data at Thission (centre of Athens) during the eclipse hours are also shown. Vertical lines denote the onset, maximum and end of eclipse at Kastelorizo.
event. For the other domains, the temporal variation of the temperature difference was similar (not shown).
In Fig. 11, the 2-m temperature variation at a grid point at the centre of Athens for the control and eclipse runs is illus-trated. The same figure shows the variation of the observed surface temperature at 1.5 m at Thission (centre of Athens) during the eclipse hours at a 30-min step. The simulated temperature response is of the order of 2.8◦C at 11:00 UTC (near the mid-eclipse) while the observed temperature drop at Thission was 2.6◦C. Apart from the amplitude of the tem-perature drop, the timing of the simulated response is also consistent with the observations. At Finokalia, the simulated temperature response was 1.9◦C, somewhat lower than the observed (2.3◦C) but consistent with observed differences between central and southern stations.
The strong temperature signal demonstrated in Figs. 9, 10 wasn’t associated with a pronounced dynamic response. The simulated horizontal wind fields (not shown here) don’t ex-hibit any significant difference between the control and the eclipse runs. This is in contrast to the findings of Gross and Hense (1999) who found a well defined signal reminiscent to a large scale land-sea circulation, while Vogel et al. (2001) simulated a small effect on wind speed except for the slopes of the mountains where the effect was more pronounced.
4 Concluding remarks
Meteorological observations in Greece during the total solar eclipse of 29 March 2006, showed a strong eclipse-induced response on all variables.
A dramatic reduction of the incident solar radiation was observed at all sites, proportional to the percentage of the sun obscuration.
The magnitude of surface air temperature decrease was not determined by the percentage of sun obscuration but by a combination of several factors such as the surrounding en-vironment and local cloudiness. Despite the larger sun ob-scuration, coastal southern stations experienced a less pro-nounced temperature drop mainly due to the influence of the sea, which confined the effect of the eclipse. Surface air temperature drop ranged from 2.3◦C (southern stations) to 2.7◦C (Athens), while the formation of low and thick cloudi-ness during the eclipse played an important role for the pro-nounced temperature drop (3.9◦C) observed at the northern station. Elevated sites experienced a faster decrease and in-crease of temperature, while at most sites the temperature minimum occurred 12–14 min after the maximum phase of the eclipse.
A decrease in surface wind speed was observed at all sites as eclipse progressed towards maximum phase, while at Kastelorizo – within the totality path – a significant reduc-tion of wind gustiness was observed for a period of 40 min symmetric to totality.
The effect of the eclipse on meteorological variables was simulated using the Weather Research and Forecast (WRF) mesoscale meteorological model. A substantial reduction of the incoming solar radiation, proportional to obscuration per-centage, was found at all domains, in good agreement with observations.
Strong anomalies over the land were revealed, with the most noticeable meteorological effect being the drop in sur-face air temperature. The stronger temperature anomalies were simulated at 11:00 UTC, near the time of the observed minimum temperature occurrence. The simulated amplitude of temperature drop was in very good agreement with obser-vations at the southern and central sites. The influence of the sea on the eclipse effects was also revealed by WRF since simulated temperature response at the southern stations was less pronounced compared to central stations.
WRF did not simulate any eclipse induced dynamic re-sponse.
Acknowledgements. We are grateful to the Environmental Services
Department of the Athens International Airport and to the Hellenic National Meteorological Service for kindly providing us with meteorological data. We also thank the Laboratory of Atmospheric Physics and the Laboratory of Meteorology & Climatology of the Aristotle University of Thessaloniki for providing data from their actinometric and meteorological stations. The work of D. Melas and Phd student I. Lisaridis has been partially supported by the research project 03ED 344 (PENED2003) funded by the Hellenic GSRT and the European Social Fund.
References
Ahrens, D., Iziomon, G. M., Jaeger, L., Matzarakis, A., and Mayer, H.: Impacts of the solar eclipse of 11 August 1999 on routinely recorded meteorological and air quality data in south-west Ger-many, Meteorol. Z, 10(3), 215–223, 2001.
Amiridis, V., Melas, D., Papayannis, A., Balis, D. S., Founda, D., Lysaridis, I., Mamouri, E., Giannakaki, E., Gerasopoulos, E., and Zerefos, C.: Aerosol Lidar observations and model calcu-lations of the Planetary Boundary Layer evolution over Greece, during the solar eclipse of 2006, Atmos. Chem. Phys. Discuss., 7, 13 537–13 560, 2007.
Anderson, J.: Meteorological changes during a solar eclipse, Weather, 54(7), 207–215, 1999.
Anderson, R. C., Keefer, D. R., and Myers, O. E.: Atmospheric pressure and temperature changes during the 7 March 1970 solar eclipse, J. Atmos. Sci., 29, 583–587, 1972.
Anfossi, D., Schayes, G., Degrazia, G., and Goulart, A.: Atmo-spheric turbulence decay during the solar total eclipse of 11 Au-gust 1999, Bound.-Lay. Meteorol., 111, 301–311, 2004. Antonia, R. A., Chambers, A. J., Phong-Anant, D., Rajagopalan, S.,
and Sreenivasan, K. R.: Response of Atmospheric SL Turbulence to a partial Solar Eclipse, J. Geophys. Res., 84, 1689–1692, 1979. Aplin, K. L. and Harrison, R. G.: Meteorological effects of the eclipse of 11 August 1999 in cloudy and clear conditions, Proc. R. Soc. Lond. A, 459, 353–371, doi:10.1098/rspa.2002.1042, 2002.
Clayton, H. H.: The eclipse cyclone and the diurnal cyclones, Ann. Astron. Observ. Harvard College, 43, 5–33, 1901.
Dolas, P. M., Ramchandran, R., Sen Gupta, K., Patil, S. M., Jadhav, P. N.: Atmospheric surface-layer processes during the total solar eclipse of 11 August 1999, Bound.-Lay. Meteorol., 104, 445– 461, 2002.
Dudhia, J.: Numerical study of convection observed during the winter monsoon experiment using a mesoscale two-dimensional model, J. Atmos. Sci., 46, 3077–3107, 1989.
Eaton, F. D., Hines, J. R., Hatch, W. H., Cionco, R. M., Byers, J., Garvey, D., and Miller, D. R.: Solar eclipse effects observed in the planetary boundary layer over a desert, Bound.-Lay. Meteo-rol., 83, 331–346, 1997.
Eckermann, S. D., Broutman, D., Stollberg, M. T., Ma, J., Mc-Cormack, J. P., and Hogan, T. F.: Atmospheric effects of the total solar eclipse of 4 December 2002 simulated with a high-altitude global model, J. Geophys. Res., 112, D14105, doi:10.1029/2006JD007880, 2007.
Fernandez, W., Castro, V., and Hidalgo, H.: Air temperature and wind changes in Costa Rica during the total solar eclipse of July 11, 1991, Earth, Moon and Planets, 63, 133–147, 1993. Fernandez, W., Hidalgo, H., Coronel, G., and Morales, E.: Changes
in meteorological variables in Coronel Oviedo, Paraguay, during the total solar eclipse of 3 November 1994, Earth, Moon and Planets, 74, 49–59, 1996.
Gross, P. and Hense, A.: Effects of a total solar eclipse on the mesoscale atmospheric circulation over Europe – A model ex-periment, Meteorol. Atmos. Phys., 71, 229–242, 1999.
Hanna, E.: Meteorological effects of the solar eclipse of 11 August 1999, Weather, 55, 430–446, 2000.
Janjic, Z. I.: The step-mountain coordinate: Physical package, Mon. Weather Rev., 118, 1429–1443, 1990.
Janjic, Z. I.: The step-mountain eta coordinate model: Further de-velopment of the convection, viscous sub-layer, and turbulent closure schemes, Mon. Weather Rev., 122, 927–945, 1994. Krishnan, P., Kunhikrishnan, P. K., Muraleedharan Nair, S.,
Ravin-dran, S., RamachanRavin-dran, R., Subrahamanyam, D. B., and Venkata Ramana, M.: Observations of the atmospheric surface layer parameters over a semi arid region during the solar eclipse of August 11th, 1999, Proc. Indian Acad. Sci. (Earth Planet. Sci.), 113, 353–363, 2004.
Mihalopoulos, N., Stephanou, E., Kanakidou, M., Pilitsidis, S., and Bousquet, P.: Tropospheric aerosol ionic composition in the Eastern Mediterranean region, Tellus, 49B, 314–326, 1997. Mlawer, E. J., Taubman, S. J., Brown, P. D., Iacono, M. J., and
Clough, S. A.: Radiative transfer for inhomogeneous atmo-sphere: RRTM, a validated correlated-k model for the longwave, J. Geophys. Res., 102(D14), 16 663–16 682, 1997.
Monin, A. S. and Obukhov, A. M.: Basic laws of turbulent mixing in the surface layer of the atmosphere., Contrib.Geophys. Inst. Acad. Sci., USSR, 151, 163–187, 1954 (in Russian).
Narasimha, R., Prabhu, A., Narahari Rao, K., and Prasad, C. R.: Atmospheric Boundary Layer Experiment, Proc. INSA Bull, 48, 175–186, 1982.
Ryan, B. F.: On the global variation of precipitating layer clouds, B. Am. Meteorol. Soc., 77, 53–70, 1996.
Szalowski, K.: The effect of the solar eclipse on the air tempera-ture near the ground, J. Atmos. Solar-Terr. Phys., 64, 1589–1600, 2002.
Segal, M., Turner, R. W., Prusa, J., Bitzer, J. R., and Finley, S. V.: Solar eclipse effects on shelter air temperature, B. Am. Meteorol. Soc., 77, 89–99, 1996.
Stoev, A., Stoeva, P., Valev, D., Kiskinova, N., and Tasheva, T.: Dynamics of the microclimatic parameters of the ground atmo-spheric layer during the total solar eclipse on August 11, 1999, Geophys. Res. Abstr., 7, 10209, 2005.
Vogel, B., Baldauf, M., and Fiedler, F.: The influence of a solar eclipse on temperature and wind in the Upper-Rhine Valley – A numerical case study, Meteorol. Z., 10, 207–214, 2001. Zanis, P., Zerefos, C. S., Gilge, S., Melas, D., Balis, D., Ziomas, I.,
Gerasopoulos, E., Tzoumaka, P., Kaminski, U., and Fricke, W.: Comparison of measured and modeled surface ozone concentra-tions at two different sites in Europe during the solar eclipse on August 11, 1999, Atmos. Environ., 35, 4663–4673, 2001. Zerefos, C. S., Balis, D. S., Zanis, P., Meleti, C., Bais, A. F.,
Tour-pali, K., Melas, D., Ziomas, I., Galani, E., Kourtidis, K., Pa-payannis, A., and Gogosheva, Z.: Changes in surface UV solar irradiance and ozone over the Balkans during the eclipse of Au-gust 11, 1999, Adv. Space Res., 27, 1955–1963, 2001.