HAL Id: hal-00330697
https://hal.archives-ouvertes.fr/hal-00330697
Submitted on 15 Oct 2008
HAL is a multi-disciplinary open access
archive for the deposit and dissemination of
sci-entific research documents, whether they are
pub-lished or not. The documents may come from
teaching and research institutions in France or
abroad, or from public or private research centers.
L’archive ouverte pluridisciplinaire HAL, est
destinée au dépôt et à la diffusion de documents
scientifiques de niveau recherche, publiés ou non,
émanant des établissements d’enseignement et de
recherche français ou étrangers, des laboratoires
publics ou privés.
Spatial variability of phytoplankton pigment
distributions in the Subtropical South Pacific Ocean:
comparison between in situ and predicted data
J. Ras, Hervé Claustre, J. Uitz
To cite this version:
J. Ras, Hervé Claustre, J. Uitz. Spatial variability of phytoplankton pigment distributions in the
Subtropical South Pacific Ocean: comparison between in situ and predicted data. Biogeosciences,
European Geosciences Union, 2008, 5 (2), pp.353-369. �hal-00330697�
www.biogeosciences.net/5/353/2008/
© Author(s) 2008. This work is distributed under the Creative Commons Attribution 3.0 License.
Biogeosciences
Spatial variability of phytoplankton pigment distributions in the
Subtropical South Pacific Ocean: comparison between in situ and
predicted data
J. Ras1,2, H. Claustre1,2, and J. Uitz1,2,*
1UPMC Univ Paris 06, UMR 7093, Lab. d’Oc´eanographie de Villefranche sur mer, 06238 Villefranche-sur-mer, France 2CNRS, UMR 7093, LOV, 06230 Villefranche-sur-Mer, France
*now at: Marine Physical Laboratory, Scripps Institution of Oceanography, University of California at San Diego, 95000
Gilman Drive, La Jolla, CA 92093-0238, USA
Received: 29 August 2007 – Published in Biogeosciences Discuss.: 2 October 2007 Revised: 17 January 2008 – Accepted: 25 January 2008 – Published: 12 March 2008
Abstract. In the frame of the BIOSOPE cruise in 2004,
the spatial distribution and structure of phytoplankton pig-ments was investigated along a transect crossing the ultra-oligotrophic South Pacific Subtropical Gyre (SPSG) between the Marquesas Archipelago (141◦W–8◦S) and the Chilean upwelling (73◦W–34◦S). A High Performance Liquid Chro-matography (HPLC) method was improved in order to be able to accurately quantify pigments over such a large range of trophic levels, and especially from strongly oligotrophic conditions. Seven diagnostic pigments were associated to three phytoplankton size classes (pico-, nano and microphy-toplankton). The total chlorophyll-a concentrations [TChla] in surface waters were the lowest measured in the centre of the gyre, reaching 0.017 mg m−3. Pigment concentrations at the Deep Chlorophyll Maximum (DCM) were generally 10 fold the surface values. Results were compared to predictions from a global parameterisation based on remotely sensed sur-face [TChla]. The agreement between the in situ and pre-dicted data for such contrasting phytoplankton assemblages was generally good: throughout the oligotrophic gyre sys-tem, picophytoplankton (prochlorophytes and cyanophytes) and nanophytoplankton were the dominant classes. Rela-tive bacteriochlorophyll-a concentrations varied around 2%. The transition zone between the Marquesas and the SPSG was also well predicted by the model. However, some re-gional characteristics have been observed where measured and modelled data differ. Amongst these features is the ex-treme depth of the DCM (180 m) towards the centre of the gyre, the presence of a deep nanoflagellate population be-neath the DCM or the presence of a prochlorophyte-enriched
Correspondence to: J. Ras
population in the formation area of the high salinity South Pacific Tropical Water. A coastal site sampled in the eu-trophic upwelling zone, characterised by recently upwelled water, was significantly and unusually enriched in picoeu-caryotes, in contrast with an offshore upwelling site where a more typical senescent diatom population prevailed.
1 Introduction
East of Tahiti, the South East Pacific Ocean is charac-terised by very contrasting trophic environments, covering a large range of total chlorophyll-a concentrations [TChla]. These environments comprise the “permanently” (Dandon-neau et al., 2004) “hyper-oligotrophic” centre of the South Pacific Subtropical Gyre (SPSG; Longhurst, 1998; Claus-tre and Maritorena, 2003) where SeaWifs imagery presents average surface TChla concentrations of 0.02 mg m−3(http: //oceancolor.gsfc.nasa.gov/SeaWiFS/). This gyre is distin-guished by its hydrodynamic stability, its unique magnitude, the transparency of its waters (Morel et al., 2007) and ex-tremely weak sources of nutrients from deeper layers (Raim-bault et al., 2007) as well as from the atmospheric flux (Ma-howald, 2005; Wagener et al., 2008; Claustre et al., 2008). To the West, the mesotrophic environment of the Marquesas archipelago prevails in a predominantly HNLC (High Nu-trient Low Chlorophyll) zone (Claustre et al., 2008 and ref-erences therein). To the East, the waters become strongly eutrophic as the Chilean coastline is subjected to an offshore transport of surface waters, thus inducing strong hydrody-namics and the upwelling of deep, cold and nutrient-rich wa-ters at the coast (Longhurst, 1998; Claustre et al., 2008 and references therein).
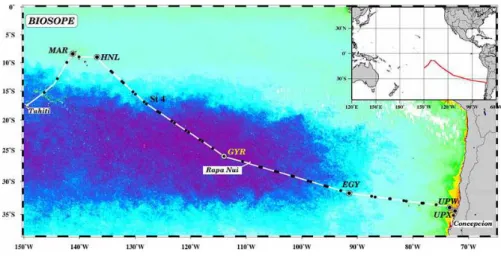
Fig. 1. Map of the BIOSOPE cruise track superimposed on a SeaWiFS ocean colour composite, the dark purple indicating the extremely low concentrations (0.017 mg m−3) of TChla.
The BIOSOPE cruise (BIOgeochemistry and Optics South Pacific Experiment), carried out from October to Decem-ber 2004, took place between Tahiti (French Polynesia) and Concepcion (Chile). It can be described as a voyage of ex-ploration across unique and contrasting environments where oceanographic data are still scarce to this day (Claustre and Maritorena, 2003). Besides the aspects of oceanographic in-vestigation aiming at the assessment of the biogeochemical and optical properties of the ocean as a function of surface water [TChla] the wide range of trophic conditions observed during this cruise was ideal for carrying out calibration and validation activities for ocean colour remote sensors.
During the past decades, high performance liquid chro-matography (HPLC) techniques have rapidly evolved, allow-ing for phytoplankton biomass and composition in the oceans to be described in detail using algal pigment biomarkers. Indeed, the [TChla] has been a widely used biomarker for the phytoplankton biomass in the oceans (Yentch and Men-zel, 1963; Parsons and Strickland, 1963; O’Reilly et al., 1998). Accessory pigments have either photosynthetic prop-erties allowing the phytoplankton cells to increase their light-harvesting spectrum, or a role of photoprotection in dissipat-ing the excess of light energy received and reducdissipat-ing the oxi-dation that takes place due to stress in conditions of strong ir-radiance. The major accessory pigments have also proven to be useful chemotaxonomic indicators (Goericke and Repeta, 1992; Wright and Jeffrey, 1987; Moore et al., 1995; Guillard et al., 1985). Hence, the chlorophyll-a and accessory pig-ment distributions have become important descriptors of the spatial and temporal variations of the autotrophic biomass and taxonomic composition. From the pigment composi-tion of natural communities, Claustre (1994), Vidussi et al. (2001), and recently Uitz et al. (2006), have proposed to derive pigment-based size classes relevant to picophyto-plankton (less than 2 µm), nanophytopicophyto-plankton (between 2
and 20 µm) and microphytoplankton (greater than 20 µm). Based on the statistical analysis of a global HPLC database, the proposed parameterisation allows these three pigment-based size classes and their vertical distribution to be re-trieved from remotely sensed TChla concentrations (Uitz et al., 2006). Although the database was extensive (∼2400 pro-files), extremely few profiles were from the South East Pa-cific so that the “global” parameterisation might be some-what biased not taking into consideration certain characteris-tics of this rather unknown and vast area.
Thus, in the context of the BIOSOPE cruise, the objec-tives related to the analysis of the distribution of phytoplank-ton pigments are double. The first aim of this study is es-sentially descriptive and explorative where the spatial (along transect and vertical) distribution of phytoplankton pigments is analysed in this “mare incognita” of the South-East Pa-cific Ocean. The second aim is to investigate whether the in situ distributions of pigment-based size classes conform with the predicted distributions derived from the application of the Uitz model to the remotely sensed (SeaWiFS) TChla con-centrations. By doing so, it is expected that any difference between measured and predicted distributions could be scru-tinized and further interpreted in terms of distinct regional features of the South-East Pacific relative to the mean (global ocean) trend.
2 Material and methods
2.1 Sampling area
Sampling was performed between the 26 October and the 11 December 2004 in the South Pacific along a transect starting in the vicinity of the Marquesas archipelago (141◦W, 8◦S) and ending in the upwelling of the Chilean coast (73◦W, 35◦S) (Fig. 1). Six sites along this transect were studied
over 2- to 5-day periods: MAR: Marquesas archipelago (141.3◦W; 8.4◦S); HNL: HNLC area east of the Marque-sas islands (136.8◦W; 9◦S); GYR: centre of the South Pa-cific gyre (about 300 nautical miles west of the “navel of the world”, a native name for Easter Island; 114◦W, 26◦S); EGY: eastern border of the gyre (91.4◦W, 31.8◦S); UPW: upwelling site situated above the abyssal plain, about 70 nau-tical miles from the coast (73.3◦E; 34◦S); UPX: upwelling site situated above the continental shelf, about 18 nautical miles from the coast (72.4◦E, 34.5◦S). In addition, twenty one short-term (less than 5 h) stations were studied each day during the transit between the long stations.
2.2 Sample collection and storage
Seawater samples were collected using a CTD-rosette system equipped with 21 twelve litre Niskin bottles. The samples for pigment analysis were collected at about 10 depths, twice a day, from the 09:00 a.m. and noon CTD casts (local time).
The water samples were vacuum filtered through 25 mm diameter Whatman GF/F glass fibre filters (0.7 µm particle retention size). Filtered volumes varied between 5.6 L in the hyper-oligotrophic waters and 1 L in the upwelling zone. The filters were immediately stored in liquid nitrogen then at – 80◦C until analysis on land.
2.3 Chlorophyll and carotenoid pigment extraction and analysis
Extraction and analysis of the BIOSOPE samples were com-pleted between the 7 March and the 27 April 2005. The fil-ters were extracted at –20◦C in 3 mL methanol (100%), dis-rupted by sonication and clarified one hour later by vacuum filtration through Whatman GF/F filters. The extracts were rapidly analysed (within 24 h) by HPLC with a complete
Ag-ilent Technologies system (comprising LC Chemstation
soft-ware, a degasser, a binary pump, a refrigerated autosampler, a column thermostat and a diode array detector)
The pigments were separated and quantified following an adaptation of the method described by Van Heukelem and Thomas (2001). Modifications to this method allowed for increased sensitivity in the analysis of ultra-oligotrophic wa-ters. As an example of the sensitivity and resolution of the method, Figs. 2a and b represent two typical chromatograms originating from the centre of the gyre (surface and Deep Chlorophyll Maximum respectively) where at least sixteen pigment peaks were identified.
The sample extracts (100% methanol), premixed (1:1) with a buffer solution (tetrabutylammonium acetate or TBAA 28 mM), were injected onto a narrow reversed-phase C8 Zorbax Eclipse XDB column (3×150 mm; 3.5 µm parti-cle size) which was maintained at 60◦C. Separation was achieved within 28 min with a gradient between a solution (A) of TBAA 28 mM: methanol (30:70; v:v) and a solution (B) of 100% methanol according to the following program:
Fig. 2. HPLC chromatograms from (a) the surface and (b) the DCM at 180 m at the hyper-oligotrophic GYR station. Detection absorp-tion wavelength is 450 nm.
(t(min);%B;%A), (0;10;90), (25;95;5), (28;95;5). A diode array detector allowed for the absorption of most pigments to be detected at 450 nm, while chlorophyll-a and its deriva-tives were detected at 667 nm and bacteriochlorophyll-a at 770 nm. The diode array absorption spectra of each peak were used for identification purposes.
Pigment concentrations (in mg m−3) were calculated from the peak areas with an internal standard correction (Vitamin E acetate, Sigma) and external calibration standards which were provided by DHI Water and Environment (Denmark).
This method has proven to be satisfactory in terms of resolution, sensitivity, accuracy and precision (Hooker et al., 2005), with the detection of about 25 separate phyto-plankton pigments (listed in Table 1), with a lower limit of detection (3 times Signal:Noise ratio) for chlorophyll-a of 0.0001 mg m−3and with an injection precision of 0.4%. 2.4 Phytoplankton pigment-based size classes
While TChla is the universal proxy for phytoplankton or-ganisms, accessory pigments (chlorophylls-b and c, and caroteno¨ıds) are specific to phytoplankton groups (Table 1), and their respective proportion to TChla is a proxy of the community composition (e.g. Gieskes et al., 1988; Jeffrey and Vesk, 1997; Mackey et al., 1996; Pr´ezelin et al., 2000).
Table 1. List of the pigments used in this study, along with their abbreviations, calculation and their taxonomic significance (From Jeffrey and Vesk, 1997). The main algal groups used here to describe the phytoplankton community composition are indicated in bold.
Chlorophylls Abbreviation Sum Taxonomic or biogeochemical
significance
Chlorophyll-a Chla Chla + allomers + epimers All – except Prochlorophytes
Divinyl Chlorophyll-a DVChla Prochlorophytes
Total Chlorophyll-a TChla Chla + DVChla + Chld a All
Chlorophyll-b Chlb Green algae
Divinyl Chlorophyll-b DVChlb Prochlorophytes
Total Chlorophyll-b TChlb Chlb + DVChlb Green algae, Prochlorophytes
Chlorophyll-c2 Chlc2 Various
Chlorophyll-c3 Chlc3 Prymnesiophytes, Chrysophytes
Bacteriochlorophyll-a BChla Photoheterotrophic bacteria
Peridinin Peri Dinoflagellates
19′-Butanoyloxyfucoxanthin But Pelagophytes, prymnesiophytes
Fucoxanthin Fuco Diatoms, prymnesiophytes,
some Dinoflagellates
19′-Hexanoyloxyfucoxanthin Hex Prymnesiophytes
Zeaxanthin Zea Cyanobacteria, Prochlorophytes
Alloxanthin Allo Cryptophytes
Diatoxanthin Diato Various
Diadinoxanthin Diadino Various
Lutein Lut Chlorophytes
Neoxanthin Neo Green algae
Violaxanthin Viola Green algae
Prasinoxanthin Pras Prasinophytes
Carotenes Car a-Car + b-Car Various
Chlorophyllide-a Chlda Chlda + Chlda-like Senescent diatoms
Phaeophorbide a Phda Phda + Phda-like Grazor faecal pellets
Phaeophytin a Phtna Grazor faecal pellets
Here we used the pigment grouping method proposed by Claustre (1994) and Vidussi et al. (2001) and recently improved by Uitz et al. (2006). Seven pigments are used as biomarkers of several phytoplankton taxa: fucox-anthin, peridinin, alloxfucox-anthin, 19′-butanoyloxyfucoxanthin, 19′-hexanoyloxyfucoxanthin, zeaxanthin, total chlorophyll-b (for abbreviations see Table 1). These taxa are then gathered into three size classes (micro-, nano-, and picophytoplank-ton), according to the average size of the cells. The fraction of each pigment-based size class with respect to the total phy-toplankton biomass is calculated as follows:
Greater than 20 µm : fmicro=(1.41[Fuco]+1.41[Peri])/wDP (1a)
2 to 20 µm : fnano=(0.60[Allo]+0.35[But]+1.27[Hex])/wDP (1b)
Less than 2 µm : fpico=(0.86[Zea]+1.01[TChlb])/wDP (1c)
where wDP is the sum of the concentration of the seven weighted diagnostic pigments:
wDP=1.41[Fuco]+1.41[Peri]+0.60[Allo]+0.35[But] (2)
+1.27[Hex]+0.86[Zea]+1.01[TChlb]
Each diagnostic pigment is associated to a coefficient which represents an estimate of the average ratio of the TChla con-centration to the diagnostic pigment concon-centration. These
coefficients have been obtained by multiple regression anal-ysis, performed on a global pigment database (Uitz et al., 2006). Eventually the TChla biomass associated with each class is derived according to:
[TChla]micro=fmicrox[TChla] (3a)
[TChla]nano=fnanox[TChla] (3b)
[TChla]pico=fpicox[TChla] (3c)
2.5 Computation of the in situ derived euphotic depth The depth of the euphotic zone (Ze), representing the depth where irradiance is reduced to 1% of its surface value, was computed using the in situ [TChla] profiles according to the model developed by Morel and Maritorena (2001). The water column [TChla] was progressively integrated with increasing depths and Ze was consequently determined through an iterative process which is described in Morel and Berthon (1989).
2.6 Remotely sensed surface chlorophyll-a used to derive the phytoplankton vertical community composition The algorithm developed by Uitz et al. (2006) was applied, and the vertical profiles of [TChla] associated with the three
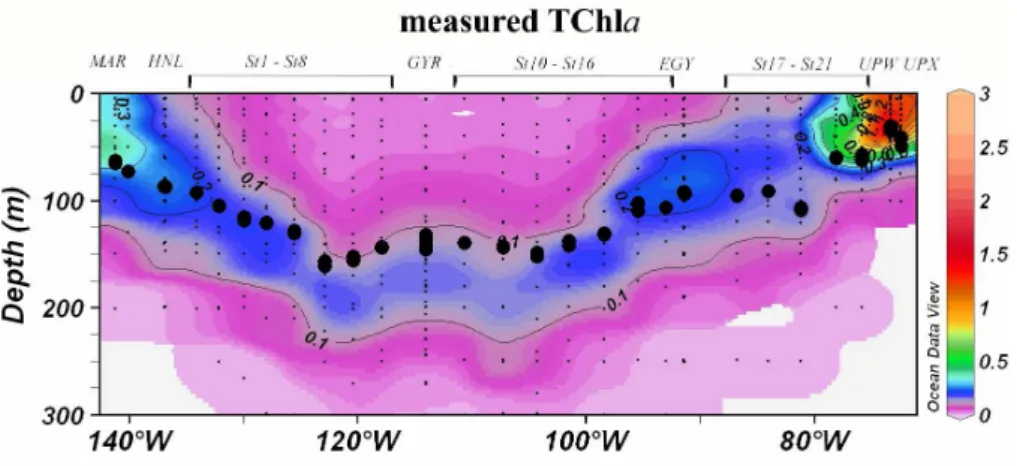
Fig. 3. Contour plot of the measured TChla concentrations (mg m−3) for the Biosope cruise transect. Large black dots represent the depth of the euphotic layer, Ze (m). Small black dots represent collected water samples at each sampling station. (Ocean Data View (ODV) software, version 3.0.1, R. Schlitzer, http://odv.awi-bremerhaven.de/, 2005).
afore-mentioned pigment-based size classes were derived. This implies the use of the near-surface TChla concentra-tions, which can be obtained from remotely sensed ocean colour.
For each station sampled during the BIOSOPE cruise, the corresponding near-surface [TChla] was extracted from Sea-WiFS imagery ([TChla]sat, mg m−3), given the geographic
location and date of sampling. When no [TChla]sat was
available, values were extracted from the SeaWiFS images corresponding to ±1 day, ±2 days, or ±3 days, with respect to the date of in situ sampling. For 39% of the stations, the date of SeaWiFS and in situ measurements coincided, for 42% they were 1-day shifted, for 10% they were 2-day shifted, and for 9% they were 3-day shifted. This strategy was chosen in order to keep all the data. A detail of the full procedure to derive vertical profiles is given in Uitz et al. (2006). Only a short summary is given below.
Firstly, the satellite derived euphotic depth was computed from the [TChla]satvalue by using successively the
statisti-cal relationship linking [TChla]satand the column-integrated
content (Eq. 8 of Uitz et al., 2006), and that of Morel et Mar-itorena (2001) relating the column-integrated content and
Zesat. The euphotic depth was then compared to the mixed
layer depth (Zm) to determine whether the water column was stratified (i.e. Ze≥Zm) or mixed (i.e. Ze<Zm). For strat-ified waters, the [TChla]sat value was used to generate
di-mensionless profiles (with respect to depth and to biomass) of TChla associated with micro-, nano-, and picophytoplank-ton. Depth profiles were restored to physical units by mul-tiplying the depths by Zesat and the concentrations by the
mean TChla concentration within the euphotic layer. For mixed waters, the [TChla]sat value was used to determine
the proportion of each pigment-based size class, eventually multiplied by the [TChla]satvalue, and extended through the
water column to generate uniform vertical profiles.
3 Results
3.1 General hydrographic conditions
General hydrographic conditions, including the distribution of temperature and salinity, are detailed in the introduction of this special issue (Claustre et al., 2008).
3.2 Pigment distribution
In terms of algal biomass (Fig. 3), the surface TChla concen-trations were lowest at the hyper-oligotrophic centre of the SPSG (0.017 mg m−3at station 6), while the highest surface values were found at both ends of the transect in the eutrophic upwelling area (up to 1.5 mg m−3) and in the mesotrophic
Marquesas area (0.200 to 0.400 mg m−3). Furthermore, a
progressive deepening of the DCM towards the centre of the gyre could be observed, varying from 50 m depth in the Mar-quesas area to 180 m in the centre of the gyre (reaching 190 m at Station 6). Pigment concentrations at the DCM in the SPSG were generally 10 fold those observed at the surface (Fig. 4a). Down to 50 m at the Chilean upwelling, the TChla profile is generally homogenous.
The mean clear sky daily PAR irradiance at the surface is 51.8 mol quanta m−2d−1(Huot et al., 2007). This covers
the whole transect, the variability due to latitude being in-significant. Figure 3 illustrates how the Ze, which therefore corresponds to the 0.5 mol quanta m−2d−1isolume, closely follows the position of the DCM except in the centre of the gyre where the DCM is clearly below the Ze.
In contrast with TChla, the accessory pigments do not all exhibit the same East-West “symmetrical” distribution. Figure 5 illustrates the vertical distribution of 6 representa-tive pigments.
Total chlorophyll-b or TChl-b (Fig. 5a), reflecting both chlorophytes, prasinophytes (chlorophyll-b) and prochlorophytes (divinyl chlorophyll-b), showed minimum
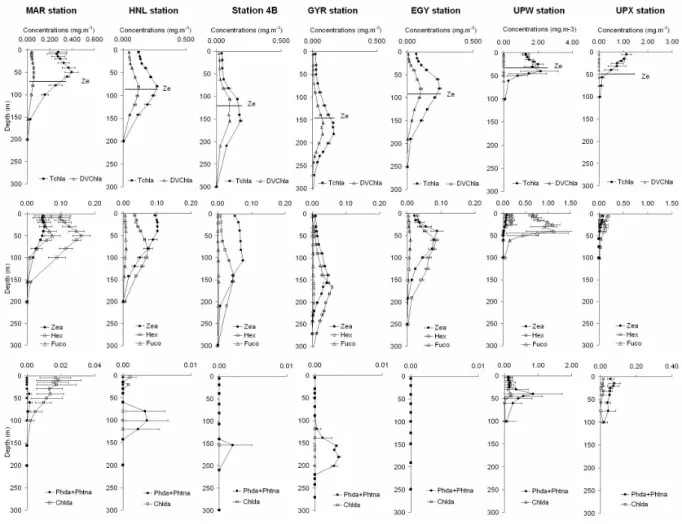
Fig. 4. Average vertical pigment profiles (mg m−3) at the MAR, HNL, St4B, GYR, EGY, UPW and UPX sites: (a) Total chlorophyll-a and divinyl chlorophyll-a, the horizontal lines represent the depth of the euphotic layer (Ze); (b) zeaxanthin, 19′-hexanoyloxyfucoxanthin and fucoxanthin; (c) degradation products: phaeophorbidea+phaeophytina and chlorophyllide-a. Horizontal bars represent the average value ±SD.
concentrations at the surface of the gyre (less than 0.001 mg m−3), while the deep maximum (down to 200 m)
could reach more than 0.100 mg m−3. Maximum concen-trations were encountered at station 20 (0.245 mg m−3) and
station UPX (0.400 mg m−3). Because divinyl chlorophyllb
is totally absent in the upwelling zone, this feature is likely the signature of green eukaryotes. A remarkable feature in the gyre system is the high TChl-b concentration below the DCM which is essentially composed of divinyl chlorophyll-b (reaching up to 100% of TChlb).
Divinyl chlorophyll-a or DVChl-a, (Figs. 4a and 5b), rep-resentative of prochlorophytes, was detected over the whole studied area, except for the upwelling zone, with surface wa-ter concentrations varying around 0.040 mg m−3at the MAR station, increasing to 0.050 at the HNL station then pro-gressively decreasing to 0.003 mg m−3 in the centre of the gyre. East of the gyre, surface concentrations did not exceed 0.008 mg m−3. At depth, the distribution of DVChla concen-trations generally followed that of the DCM (Fig. 4a).
The photoprotecting zeaxanthin or Zea (Figs. 4b and 5c), found in cyanobacteria and prochlorophytes, showed very low surface values in the centre of the gyre (around 0.010 mg m−3 at the surface) and progressively increas-ing concentrations with depth, with a maximum (about 0.050 mg m−3) above the DCM, around 150 m. A particular zone, coinciding with the South Pacific Tropical Water mass between HNL and station 4, was characterised by high and constant zeaxanthin concentrations between the surface and 100 m depth. In the upwelling area, zeaxanthin was detected in very low concentrations, while the photoprotecting diadi-noxanthin and diatoxanthin, (essentially typical pigments of diatoms and prymnesiophytes) significantly increased (data not shown).
19′-Hexanoyloxyfucoxanthin or Hex (Figs. 4b and 5d), representative of chromophyte nanoflagellates, was detected throughout the whole studied area, with highest concentra-tions at the extremities of the transect: in the Marquesas archipelago (0.060–0.130 mg m−3and 0.130–0.180 mg m−3
Fig. 5. Vertical cross sections for pigment concentrations (mg m−3) across the BIOSOPE cruise transect. (a) Total chlorophyll-b; (b) divinyl chlorophyll-a; (c) zeaxanthin; (d) 19′-hexanoyloxyfucoxanthin; (e) fucoxanthin; (f) bacteriochlorophyll-a.
at the surface and 50 m depth respectively), around stations 20 and 21 (0.140 mg m−3and 0.400 mg m−3 at the surface and 50 m depth respectively) and at station UPW (0.140– 0.230 mg m−3 and 0.320 mg m−3 at the surface and 40 m depth respectively). The 19′-hexanoyloxyfucoxanthin con-centrations at the UPX site were lower than 0.067 mg m−3. Lowest concentrations were found at the centre of the gyre: 0.005 mg m−3at the surface and 0.050 mg m−3at the DCM. Interestingly, throughout the central gyre the Hex concen-trations were twice higher around 270 m depth than at the surface (0.011 mg m−3).
Fucoxanthin or Fuco (Figs. 4b and 5e), a tracer of di-atoms, was found in very low amounts throughout the SPSG. Significant concentrations were only found in the Marque-sas waters (0.020 to 0.080 mg m−3at the surface and up to 0.100 mg m−3at 50 m depth) and in the upwelling zone, par-ticularly at station UPW (0.700 and 1.600 mg m−3at the sur-face and at 40 m depth respectively). Fucoxanthin concentra-tions did not exceed 0.200 mg m−3at station UPX.
At the MAR station, bacteriochlorophyll-a concentrations (BChl-a, Fig. 5f) in the first 100 m varied around 0.0015 and 0.0035 mg m−3. At the HNL station, they were variable but lower than at MAR (between 0.0010 and 0.0016 mg m−3),
although a slight deep maximum was observed around 80m
depth (0.0015 to 0.0033 mg m−3). The surface BChla concentrations within the gyre system remained extremely low and close to detection limits (0.0005 mg m−3), while
a BChla deep maximum was observed around 100 m (0.0010 mg m−3). In the upwelling area, the BChla
concen-trations were the highest measured over the whole transect (between 0.0020 and 0.0090 mg m−3).
Minor pigments such as prasinoxanthin and alloxanthin, respectively associated to prasinophytes and cryptophytes, were never detected in the Marquesas area and hardly in the SPSG (data not shown). However, prasinoxanthin, as-sociated to chlorophyll-b, as well as neoxanthin, violax-anthin and lutein (typical indicators of chlorophytes and prasinophytes), were found in significant concentrations at the coastal upwelling UPX site, thus suggesting an important localised contribution of green picophytoplankton in these waters.
Chlorophyllide-a or Chlida and phaeopigments (Fig. 4c) were scarce in the gyre, sometimes detectable at the DCM. Chlida was present in significant and variable amounts at the MAR and UPW stations. The degradation products derived from the demetallation of chlorophyll-a associated to grazing activities (phaeophorbide-a and phaeophytin-a) were found in high concentrations essentially in the upwelling area, with
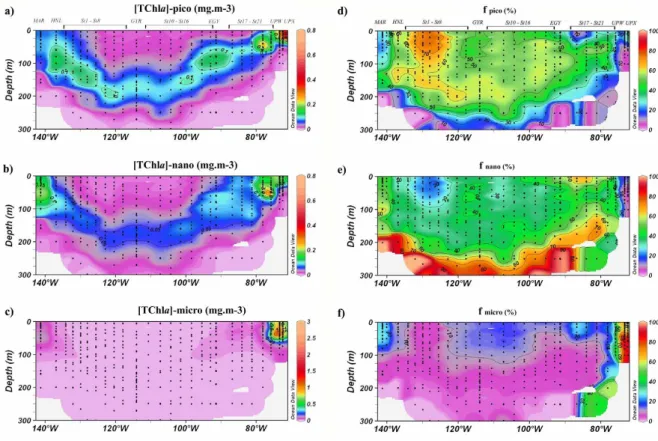
Fig. 6. Biosope cruise cross sections of in situ TChla concentrations in mg m−3(a–c) and percentages (e–g) associated to the pico-, nano-and microphytoplankton size classes. Black dots represent sampling points.
the phaeopigment to TChla ratio increasing constantly with depth up to values of 1.500. Degradation pigment concentra-tions generally showed a good correlation with the fucoxan-thin concentrations (data not shown).
3.3 Distribution of the phytoplankton pigment based size classes
Picophytoplankton, represented by cyanobacteria and prochlorophytes in this study, present similar variations to TChla (Fig. 6a), with a deep maximum coinciding with the DCM (around 180 m in the centre of the gyre). Picophytoplankton is unusually high at the UPX station. In terms of percentages of TChla, the highest values for picophytoplankton (>70%) are found associated with South Pacific Tropical Water (SPTW) between stations 2 and 5 (Fig. 6d). Elsewhere in the gyre, the proportion of picophytoplankton varies between 40 and 60% down to 250 m. Nanophytoplankton in the gyre system varies in concentrations and proportions that are comparable to the picophytoplankton (Figs. 6b and 6e), although below 250 m, it is found in proportions greater than 60% (essentially due to the quasi dominance of Hex). At the MAR station, nanophytoplankton is the predominant class. Surface waters at stations 17 and 18 also present relatively high proportions
of nanophytoplakton (>60%), while minimal proportions are found in the SPTW area (<30%) and in the upwelling zone. Microphytoplankton, as for fucoxanthin, points to the scarcity in diatom populations across the gyre system (Fig. 6c). Interestingly, a slight increase in the proportion of essentially fuco-containing phytoplankton is observed in the surface waters of the central gyre (>10%, Fig. 6f) while proportions are less than 10% in the rest of the gyre system. The Marquesas waters are also enriched in fucoxanthin-containing microphytoplankton (>20%). In the upwelling zone, microphytoplankton represents more than 60% of the TChla biomass. The contribution of peridinin to the microphytoplankton pool is generally low, but there are some exceptions: for example the Peri to Fuco ratio is particularly high (>2) in the SPTW area and at sites 15 and 20.
3.4 TChla biomass and pigment-based size classes: mod-elled versus in situ data
3.4.1 Global trends in Tchla
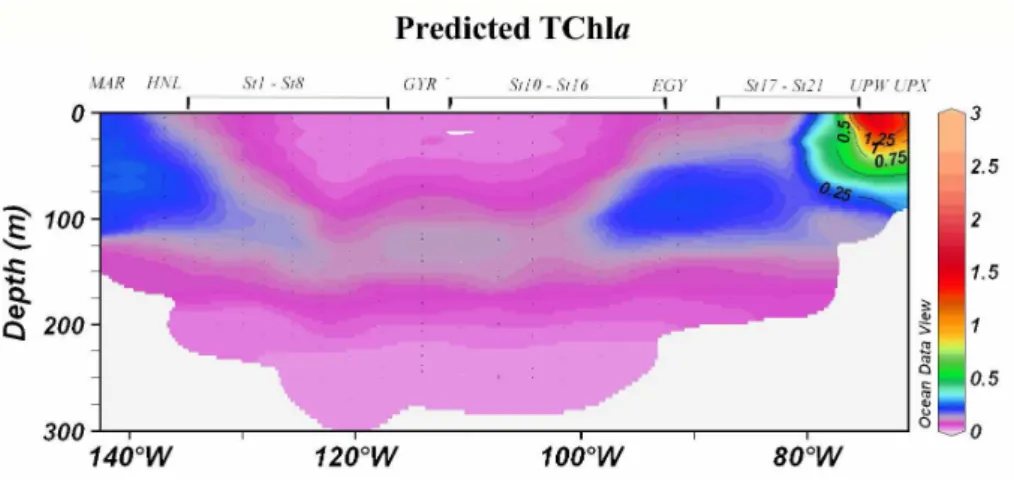
The vertical sections of the TChla concentrations obtained from in situ measurements and from the model are presented in Figs. 3 and 7, respectively. The comparison between these
Fig. 7. Contour plot of the predicted TChla concentrations (mg m−3) for the BIOSOPE cruise transect. (Ocean Data View (ODV) software, version 3.0.1, R. Schlitzer, http://odv.awi-bremerhaven.de/, 2005).
In situ data from the BIOSOPE cruise Predicted data for the BIOSOPE cruise
0 10 20 30 40 50 60 70 80 0.0 0.1 1.0 10.0 [T C h la ]1 .5 Z e (% ) 0 20 40 60 80 100 0.0 0.1 1.0 10.0 [TChla] surf (mg.m-3) [T C h la ] su rf ( % )
%pico %nano %micro
b) 0 10 20 30 40 50 60 70 80 0.0 0.1 1.0 10.0 [T C h la ]1 .5 Z e ( % ) 0 20 40 60 80 100 0.0 0.1 1.0 10.0 [TChla] surf (mg.m-3) [T C h la ] su rf (% ) a)
Fig. 8. Composition of the phytoplankton population as a function of surface TChla concentrations for in situ and model data. (a) integrated percentages of pico-, nano- and microphytoplankton between 0 and 1.5 Ze and (b) surface percentages of pico-, nano- and microphytoplank-ton.
two figures illustrates the capacity of the model to reproduce the general trends in the horizontal and vertical distribution of the TChla. Notably, the model simulates the gradient observed in the surface concentrations with extremely low values in the core of the gyre (≈0.030 mg m−3) and higher
values at the extremities of the transect, i.e. in the vicin-ity of the Marquesas Islands and of the upwelling of Chile (≈1.500 mg m−3). It also reproduces the surface maximum
at each end of the transect as well as the deepening of the maximum in the centre of the gyre. Besides these similarities however, the depth of the TChla maximum is significantly underestimated in the core of the gyre (≈120 m according to the model vs. 180 m following in situ measurements).
3.4.2 Global trends in pigment-based size classes
In a first approach we considered the contribution of the three pigment-based size classes to the total phytoplankton biomass as a function of the surface [TChla]. To do so, the same procedure as described in Uitz et al. (2006) was used. Namely, the average contribution of each phytoplank-ton size class was calculated for the surface layer on the one hand, and for the 0–1.5 Ze layer on the other hand, for nine trophic categories defined by successive intervals of sur-face [TChla]. The resulting contributions are compared to those obtained from the global dataset from which the model has been derived (Fig. 6 in Uitz et al., 2006). The changes
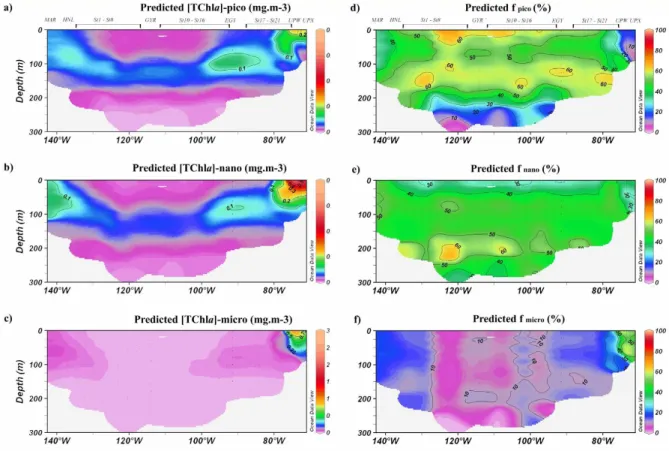
Fig. 9. Cross sections of the predicted TChla concentrations along the BIOSOPE transect for pico-, nano- and microphytoplankton, expressed in mg m−3(a–c) and percentages (d–f).
in the contribution of the three pigment-based size classes as a function of the surface [TChla] display the same gen-eral trend for both datasets (Fig. 8). Indeed, the contribu-tion of microphytoplankton tends to increase with the sur-face TChla concentration, and reaches up to 50–60% for a surface [TChla] of 1.000 mg m−3. In contrast, picophyto-plankton dominate in oligotrophic conditions (≈50% for a surface [TChla] of 0.030 mg m−3) and nanophytoplankton in mesotrophic conditions (≈50% for a surface [TChla] of 0.500 mg m−3).
3.4.3 Deviations with respect to the global trends
The comparison between in situ data and predictions shows that, at a first order, the model performs well for the wide range of trophic situations encountered along the BIOSOPE transect (Fig. 8). The sections of the absolute and relative TChla concentrations of micro-, nano- and picophytoplank-ton obtained from the model are presented in Fig. 9, to be compared to Fig. 6 (in situ data). In terms of absolute con-centrations, the model displays similar values to those mea-sured in situ. The global trends are also well represented in terms of relative values, as expected from Fig. 8. This ex-ercise thus represents an a posteriori validation of the model considering that the BIOSOPE dataset was not included in
the database from which the model has been derived. In ad-dition, this comparison exercise allows the identification of several features where the phytoplankton composition is not typical of the model-based composition associated to a given surface [TChla]. These particularities may be related to the very unique spatial and temporal features (large- or small-scale) that occurred within the study region. Within the fol-lowing discussion, several areas, characterized by atypical pigment distributions and associations, will be depicted.
4 Discussion
4.1 General trends
4.1.1 Dominance of picophytoplankton in the South Pacific Subtropical Gyre
Between stations 1 and 16 (from 13.5◦S; 132.1◦W to 31.4◦S; 93◦W), picophytoplankton is generally the most abundant size class (50–60% of the phytoplankton biomass down to 250 m). This observation is consistent with other studies in tropical and subtropical areas of the world ocean (Claustre and Marty, 1995; Bidigare and Ondrusek, 1996; Mackey et al., 1996; Dandonneau et al., 2006). In these
strongly illuminated waters, cyanobacteria essentially dom-inate the phytoplankton populations. Synechococcus are more abundant at the surface and Prochlorococcus at depth (Fig. 11b and Fig. 11c). When DVChla concentrations from the BIOSOPE cruise were compared with data from the Atlantic subtropical gyre systems (Uitz et al., 2006), it resulted that such low surface concentrations had never yet been measured and that, as for TChla, the deep maxi-mum concentration was significantly deeper than observed elsewhere (data not shown). The effect of photoacclima-tion (Falkowski and LaRoche, 1991; Partensky et al., 1996; Claustre and Marty, 1995) may explain this observation. It can also lead to an eventual increase of the accessory pig-ments to TChla ratios with depth (MacIntyre et al., 2002). However this is not a rule, since the pigments do not all react similarly with changing irradiance. Prochlorophytes are known to reach maximal relative abundances in highly stratified and extremely nutrient-depleted waters (Partensky et al., 1999; Johnson and Howd, 2000). Either variations in community structure or photoadaptive processes within the cells (phenotypic versus genotypic modifications), may explain the observed vertical structure of the prochloro-phyte population with divinyl chlorophyll-a prevailing in the upper 180 m (DCM included) while a layer of divinyl chlorophyll-b-rich water sits at the base of the DCM
(DVChl-b/DVChl-a<0.1 above 150 m and ≈2 at 300 m depth, see
also Fig. 11a). Goericke and Repeta (1993) and Parten-sky et al. (1996) made similar observations in the North At-lantic. Moore and Chisholm (1999), Partensky et al. (1999), Johnson et al. (2006), Bouman et al. (2006) and Garczarek et al. (2006) support the hypothesis that several genetically different prochlorophyte populations coexist over a vertical light gradient. These ecotypes would be characterised by varying DVChlb to DVChla ratios indicating their adapta-tion to low-light (below the thermocline) or high-light (in the upper mixed layer) environments. The extent of the depth reached by prochlorophyte populations may not only depend on light and on nutrients, but may also be limited by temper-ature. Indeed, in the SPSG, the divinyl chlorophyll-a and divinyl chlorophyll-b concentrations were always detected above the 11◦C isotherm, as has been previously observed by Dandonneau et al. (2006) and Partensky et al. (1999). 4.1.2 Ubiquity of nanophytoplankton in the South Pacific Throughout most of the SPSG, nanophytoplankton, essen-tially represented by Hex, corresponded to 40–50% of the TChla biomass down to 200 m depth (Fig. 11d). The ubiq-uity of the nanophytoplankton class, even in conditions of hyper-oligotrophy and high irradiance, reflects a strong ca-pacity for adapting to the extreme conditions encountered along the transect and as well as at great depths where nu-trients become available. Caution must be taken with the definition of nanophytoplankton as it is essentially based on the presence of Hex and But. In the study area, especially at
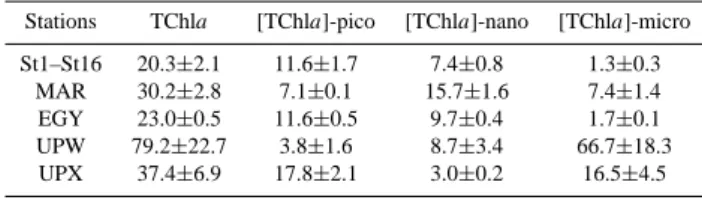
Table 2. Average values ± SD of the 0–1.5 Ze integrated TChla contents (mg m−2) associated to the total phytoplankton biomass and to the three pigment-based size classes: pico-, nano- and mi-crophytoplankton between stations 1 and 16 for the gyre system and for stations MAR, EGY, UPW and UPX.
Stations TChla [TChla]-pico [TChla]-nano [TChla]-micro
St1–St16 20.3±2.1 11.6±1.7 7.4±0.8 1.3±0.3
MAR 30.2±2.8 7.1±0.1 15.7±1.6 7.4±1.4
EGY 23.0±0.5 11.6±0.5 9.7±0.4 1.7±0.1
UPW 79.2±22.7 3.8±1.6 8.7±3.4 66.7±18.3
UPX 37.4±6.9 17.8±2.1 3.0±0.2 16.5±4.5
the surface, these pigments which are typical for flagellates could however belong to smaller cells which may be part of the picophytoplankton pool. Further information would be needed to assess the real definition of size classes relative to the pigment composition in such oligotrophic waters. 4.1.3 Importance of photoheterotrophic bacteria in
olig-otrophic waters
BChla-containing photosynthetic bacteria were most repre-sentative in the centre of the SPSG, with average surface BChla/TChla ratios of 2% progressively decreasing down to 0% at 170 m depth (Fig. 11f). These values are much lower than the range of 5 to 10% mentioned by Kolber et al. (2001). The results from the BIOSOPE cruise agree bet-ter with Cottrell et al. (2006) who measured ratios between 0.3% and 2.6% in the Mid-Atlantic Bight and are higher than those measured by Goericke (2002) in the oligotrophic Cali-fornia Current System (0.7%). This is consistent with paral-lel measurements done by Lami et al. (2007) who found high standing stocks of aerobic anoxygenic phototrophic (AAP) bacteria above the DCM in the SPSG.
4.1.4 The Marquesas Archipelago – HNLC transition zone Comparison with the model data essentially focuses on the transition between the MAR and HNL sites, as the pigment distribution differs from one site to another. At the MAR site, the average integrated TChla biomass between the surface and 1.5 Ze varied around 30.2±2.8 g m−2 (Table 2). Bidi-gare and Ondrusek (1996) measured values (between 0 and 150 m) ranging from 24 to 30 mg TChla m−2 in the same
area. Nanophytoplankton was the predominant size class (50–60%) between 0 and 175 m as equally predicted by the model. This is well represented by the Hex distribution. Above 80 m depth, the microphytoplankton pool had similar proportions to picophytoplankton (20–25% each), while be-low 80 m it decreased to less than 10% (Figs. 6d and f). The MAR site was also the only site of the transect (apart from the upwelling), where signs of diatom senescence could be found. Microscopic observations showed significant counts
Fig. 10. Contour plot of the Photoprotection Index (PI) across the BIOSOPE transect. The large black dots represent the depth of the euphotic layer (Ze). The small black dots represent the collected water samples at each station. (Ocean Data View (ODV) software, version 3.0.1, R. Schlitzer, http://odv.awi-bremerhaven.de/, 2005).
of diatoms and a low number of dinoflagellate populations (Gomez, personal communication, 2006). The proportion of peridinin also remained low, confirming the weak contribu-tion of the dinoflagellate populacontribu-tion. This is in agreement with previous observations in the Equatorial Pacific Ocean (Bidigare and Ondrusek, 1996). However precautions may need to be taken with the interpretation of the peridinin con-centrations, as dinoflagellates that do not contain peridinin, like certain Gymnodinium sp., have already been observed in these waters (Chavez et al., 1990; Landry et al., 2000).
As expected, the HNL site, being “upstream” of the South Equatorial Current, was more typical of the stratified olig-otrophic gyre waters, with a two fold increase in the pro-portion of picophytoplankton (Fig. 6d). A strong propro-portion of picophytoplankton, essentially prochlorophytes, prevailed around 130 m. An unusually high contribution of DVChlb was also observed at this depth. Nanophytoplankton repre-sented about 30% of the total TChla biomass (Fig. 6e). The proportion of microphytoplankton showed a discrete maxi-mum around 60 m but remained below 12% (Fig. 6f), with a higher contribution of peridinin (dinoflagellates). It appears that the algal population at the HNL site is influenced by the proximity of the more hydrodynamically stable South Pacific Tropical Water formation area rather than the turbulent wa-ters of the Marquesas Islands (Signorini et al., 1999). 4.2 Geographical particularities in the pigment distribution
and associations
4.2.1 Extreme depth of the DCM in the Central South Pa-cific subtropical gyre
The chlorophyll maximum has rarely been observed to reach such remarkable depths in the global ocean as those encoun-tered here. Although comprehensive, the dataset on which the model is based does not include data collected in such extreme oligotrophic conditions as those encountered during
the BIOSOPE cruise. Unsurprisingly, this made it difficult to predict the extent of the chlorophyll maximum in the centre of the gyre. Although some small nuances exist in the pig-ment distribution, the main and more important particular-ity of the SPG remains its exceptional transparency (Morel et al., 2007). This is likely the result of exceptional weak diffusive nutrient fluxes from the deep nutricline. Through-out the gyre, the integrated TChla concentrations between 0 and 1.5Ze varied around 20.3±2.1 mg m−2(Table 2) and
fall within the range of those measured between 0 and 250 m by Claustre and Marty (1995) in the North Tropical At-lantic Ocean. This implies that although the phytoplank-ton biomass can develop at larger depths than in other parts of the world ocean, the biomass integrated down to 1.5 Ze seemingly remains comparable to other subtropical gyre sys-tems. The phytoplankton community therefore follows the same general trends as observed for other gyres with the no-ticeable difference that the distribution is more extended (di-luted) over the geometric depth. Actually with respect to eu-photic depth (the ratio Z/Ze) the DCM in the SPG is located deeper than in other gyres. The DCM is generally associated to the depth of the euphotic zone in other subtropical gyres (Letelier et al., 2004; Uitz et al., 2006), while for the most oligotrophic stations of the SPG, it was located at ∼1.2 Ze (i.e. at 190 m for Ze=160 m). Consequently, phytoplankton at the level of the DCM and below has developed the most extreme adaptation characteristics with respect to light.
The adaptation to these extreme optical conditions can also be investigated through light intensity, characterised by the photoprotection index PI:
PI=(Diadinoxanthin + Diatoxanthin + Zeaxanthin)/[TChla] , (4) As expected, the values of the PI increase towards the sur-face, but more interestingly, the depths of the euphotic layer along the cruise track appear to closely follow the vertical variations in the PI (Fig. 10).
Fig. 11. Cross sections for pigment concentrations normalised to Total chlorophyll-a across the BIOSOPE cruise transect. (a) Total chlorophyll-b/TChl-a; (b) Divinyl Chlorophyll-a/TChl-a; (c) Zeaxanthin/TChla; (d) 19′-Hexanoyloxyfucoxanthin/TChla; (e) Fucoxanthin/TChla; (f) Bacteriochlorophyll-a/TChl-a.
4.2.2 A deep nanoflagellate population
A sudden increase in the proportion of nanophytoplankton was observed at the base of the DCM (Fig. 11d). This feature has been observed in other subtropical gyre systems (Claus-tre and Marty, 1995; Monger et al., 1999), but the reasons for its existence are still unclear. Claustre and Marty (1995) suggest that this deep nanoflagellate population can develop close to the nutricline, which is the case here. Other types of measurements from the cruise indicated that this deep layer was particularly rich in coccoliths (Beaufort et al., 2007). Twardowski et al. (2007) observed a high backscattering ra-tio in this layer and suggest that this populara-tion may corre-spond to the coccolithophorid Florispharea profunda. 4.2.3 Slight increase in microphytoplankton in the centre
of the SPSG
The microphytoplankton group was extremely sparse in the SPSG. Nevertheless, in the 0–80 m surface layer, a slight in-crease in the proportion of microphytoplankton, essentially represented by fucoxanthin (Fig. 11e), was observed at the centre of the gyre (particularly station 11). In contrast,
Gomez (2007), in accordance with the model results, de-scribes a distinct decrease of the diatom population towards the centre of the gyre and towards the surface. Therefore according to microscopic observations this small increase of fucoxanthin should not originate from a diatom population (Gomez, personal communication), unless the diatom cells are smaller than 15 µm (lower limit of detection for the mi-croscopic method).
Certain endosymbiont cyanobacteria, attached to particu-lar diatom genera, directly fix dinitrogen and can supply all the nitrogen required to their host (Carpenter, 2002). Ven-rick (1974) and Scharek et al. (1999) have reported that sev-eral diatom species of the genera Hemiaulus or
Rhizosole-nia in association with the diazotroph cyanobacteria Riche-lia intracellularis are able to survive in oligotrophic
sur-face waters. Indeed, although in low abundance, Hemiaulus
hauckii were observed by microscopy to be the only diatom
species at the surface at station 12 (Gomez, personal com-munication, 2006). Nevertheless, very little is yet known about these symbioses. Other large species of diatoms
(Eth-modiscus, Rhizosolenia mats) or dinoflagellates (Pyrocystis)
nutrient-poor conditions (Villareal et al., 1999; Singler and Villareal, 2005), but apart from the presence of Nitzschia and Dactyliosolen between 200 and 300 m depth in the gyre, no significant microscopic observations are available. An alternative explanation may be the presence of other Fuco-containing phytoplankton groups, such as haptophytes or pelagophytes, but no other associated pigments behave like Fuco in this area, except for Peri which shows higher propor-tions in the surface waters of the SPSG. Hardy et al. (1996) and Gomez (personal communication, 2006) have observed small dinoflagellates to occur in the surface waters of the central gyre. Certain species of dinoflagellates are known to contain Fuco, especially when Peri is absent (Morden and Sherwood, 2002). So even though Fuco and Peri do not cor-relate well, one can hypothesise that the Fuco contribution in these waters may partly originate from dinoflagellate popu-lations.
4.2.4 Very strong signature of prochlorophytes in the South Tropical Surface Water
The North-western border of the South Pacific Subtropical Gyre is under the influence of the South Equatorial Cur-rent (SEC) and represents typical HNLC (High Nutrient Low Chlorophyll) conditions. Between stations 2 and 5, the rea-sons for the particularly high proportion of picophytoplank-ton (Fig. 6d), and more precisely Prochlorococcus, down to 150 m, seem unclear. Their development is nevertheless associated to the remarkably high-salinity waters (36.5) of the South Tropical Surface Water (STSW), where a stronger evaporation rate relative to precipitation occurs (Johnson and McPhaden, 1999) and surface nutrient levels remain, as in the rest of the gyre system, below detection limits (Raimbault, 2007). This water mass can be characterised by a very spe-cific prochlorophyte-dominated picophytoplanktonic popu-lation. A a consequence, the Zea/TChla ratios are also ex-ceptionally high (greater than 1) above 65 m depth (Fig. 11c). It is also the only part of the transect where the relative Fuco concentration represents less than 2.5% of the TChla biomass (Fig. 11e). As the surface TChla biomass in this zone is not exceptional in comparison to the rest of the gyre, the model does not predict such an unusual distribution in the phytoplankton population. The prevailing conditions and the exceptional phytoplankton population in this area would definately deserve further investigation.
4.2.5 High variability in community structure in the up-welling area
Only the upwelling region was characterised by a proportion of microphytoplankton above 30% (Fig. 6f). This was also reflected by the model data (Fig. 9f). However both sites seem to have been very different in a taxonomical point of view, a difference which could not be predicted by the model. Table 2 summarizes, for the 0 to 1.5 Ze layer, the differences
observed between these 2 sites, with a higher and more vari-able integrated TChla biomass at UPW than at UPX, the for-mer being dominated by the microphytoplankton and the lat-ter by equivalent proportions of pico- and microphytoplank-ton. The offshore UPW station was characteristic of a typ-ically mature spring bloom with higher biomass concentra-tions essentially represented by diatoms which had probably been advected offshore from the upwelling zone. This is con-firmed by the nutrient concentrations (Raimbault et al., 2007) that showed near-depletion in the surface waters of the UPW site and which may attribute the decrease of phytoplankton biomass towards the surface as a beginning of nutrient star-vation. Furthermore, signs of pigment degradation related to senescence and grazing were highest for this site (Fig. 5c). Stuart et al. (2004) had similar results along the Chilean coast, i.e. typical upwelling features with high phytoplank-ton biomass (above 10 mg m−3) and
microphytoplankton-predominant populations, especially above the shelf break, and lower concentrations over the continental shelf and off-shore regions. Only one site in their study presented unusu-ally high relative concentrations of Chlb and Zea.
The surface waters of the coastal UPX site were domi-nated by a picoeukaryotic community (49 to 70% of pico-phytoplankton between the surface and 30 m depth), while it represented less than 10% of the TChla biomass at the diatom-dominated UPW site. The pigments associated to the picoeukaryotic chlorophytes, prasinophytes and crypto-phytes were essentially found in the upwelling zone only, with absolute and relative concentrations several fold higher at the UPX site than at UPW. The flow cytometry data also indicated a maximum in concentrations of picoeukaryotes at this site (Grob, 2007). According to the temperature pro-files, UPX was seemingly the site of recent upwelling of cold deep waters and the observed phytoplankton community was probably at an early stage of development. Experimental tests by Duarte et al. (2000a and b) on a Mediterranean com-munity showed how increasing nutrient inputs lead to an ini-tial autotrophic response of picophytoplankton (particularly
Synechoccocus) which is later rapidly replaced by a stronger
and more robust population of microphytoplankton. Further-more, Larsen et al. (2004) and Bratbak et al. (1990) also witnessed an increase in autotrophic picoeukaryotes and/or cyanobacteria preceding a diatom spring bloom. Claustre et al. (1994) observed a similar event along a geostrophic front, where a ubiquitous flagellate biomass, associated to recently upwelled water, was observed to develop rapidly before be-ing dominated by a slower developbe-ing diatom population. The picophytoplankton population at UPX was dominated by picoeukaryotes and not cyanobacteria (very low zeaxanthin concentrations) nor flagellates (the nanophytoplankton class varied at background levels at less than 10%, values which are largely overestimated by the model), but the observations of Claustre et al. (1994), Duarte et al. (2000a, b) and Larson et al. (2004) could corroborate the idea that this young pico-phytoplankton community had quickly responded to a recent
input of nutrients at the surface before being taken over by a diatom-dominated population. These transient communities are not usually observed in eutrophic zones as they probably occur at small time-scales. They are thus difficult to measure and even more to forecast with global models like the one used in this study.
5 Conclusions
As expected, the surface waters of the South Pacific Sub-tropical Gyre are the site of extremely low concentrations of phytoplankton biomass, requiring highly sensitive ana-lytical techniques. The HPLC anaana-lytical method applied in this study was especially modified in order to adapt to such low concentrations and due to the low limits of detection obtained, an accurate and precise coverage of the different phytoplankton pigments with taxonomical significance has been achieved.
A phytoplankton pigment parameterisation, based on re-motely sensed surface TChla concentrations was applied to the BIOSOPE transect and the predicted values were com-pared to the in situ data. In a first approach, the general pat-terns produced by the model were relatively well validated by the in situ data across such contrasting environments. How-ever, in detail, this has revealed certain areas where the phy-toplankton populations deviate from their typical composi-tion that would be expected from the surface TChla concen-trations. These are specific temporal or spatial features that cannot be depicted by a global parameterisation. The pig-ment signatures observed during the BIOSOPE cruise thus point to new issues and questions which could be the ob-ject of upcoming studies regarding the development of phyto-plankton populations in the extreme conditions encountered in the ultra-oligotrophic center of the gyre, in the high salin-ity SPTW formation area or in eutrophic upwelling zones in general.
The outcome of such a comparison is a very promising new methodology for identifying atypical structures: indeed the model used here could be applied to data from other parts of the global ocean and could thus become a useful tool for rapidly pinpointing pigment associations and distributions that deserve special interest.
Acknowledgements. We thank the captain and crew of the R/V
Atalante for their pleasant cooperation during the BIOSOPE cruise. We also appreciate the time and effort provided by B. Gentili for computations. D. Tailliez and C. Marec are warmly thanked for their efficient help in CTD rosette management and data processing. This is a contribution of the BIOSOPE project of the LEFE-CYBER program. This research was funded by the Centre National de la Recherche Scientifique (CNRS), the Institut des Sciences de l’Univers (INSU), the Centre National d’Etudes Spa-tiales (CNES), the European Space Agency (ESA), The National Aeronautics and Space Administration (NASA) and the Natural Sciences and Engineering Research Council of Canada (NSERC). Edited by: E. Boss
References
Beaufort, L., Couapela, M., Bucheta, N., and Claustre, H.: Cal-cite production by Coccolithophores in the South Pacific Ocean: from desert to jungle, Biogeosciences Discuss., 4, 3267–3299, 2007,
http://www.biogeosciences-discuss.net/4/3267/2007/.
Bidigare, R. R. and Ondrusek, M. E.: Spatial and temporal variabil-ity of phytoplankton pigment distributions in the central equato-rial Pacific Ocean, Deep-Sea Res. II, 43(4–6), 809–833, 1996. Bouman, H. A., Ulloa, O., Scanlan, D.J., Zwirglmaier, K., Li, W.
K. W., Platt, T., Stuart, V., Barlow, R., Leth, O., Clementson, L., Lutz, V., Fukasawa, M., Watanabe, S., and Sathyendranath, S.: Oceanographic Basis of the Global Surface Distribution of Prochlorococcus Ecotypes, Science, 312, 918–921, 2006. Bratbak, G., Heldal, G. M., Norland, S., and Thingstad, T. F.:
Viruses as partners in spring bloom microbial trophodynamics, Appl. Environ. Microbiol., 56, 1400–1405, 1990.
Carpenter, E. J.: Marine Cyanobacterial symbioses, Biol. Environ., 102B, 1, 15–18, 2002.
Chavez, F. P., Buck, K. R., and Barber, R. T.: Phytoplankton taxa in relation to primary production in the Equatorial Pacific, Deep-Sea Res., 37, 11A, 1733–1752, 1990.
Claustre, H.: The trophic status of various oceanic provinces as re-vealed by phytoplankton pigment signatures, Limnol. Oceanogr., 39, 5, 1206–1210, 1994.
Claustre, H., Kerherv´e, P., Marty, J. C., Prieur, L., Videau, C., and Hecq, J. H.: Phytoplankton dynamics associated with a geostrophic front: ecological and biogeochemical implications, J. Mar. Res., 52, 711–742, 1994.
Claustre, H. and Maritorena, S.: The many shades of ocean blue, Science, 302, 1514–1515, 2003.
Claustre, H. and Marty, J. C.: Specific phytoplankton biomasses and their relation to primary production in the tropical North Atlantic, Deep-Sea Res. I, 42, 8, 1476–1493, 1995.
Claustre, H., Sciandra, A., and Vaulot, D.: Introduction to the spe-cial section: bio-optical and biogeochemical conditions in the South East Pacific in late 2004 – the BIOSOPE cruise, Biogeo-sciences Discuss., 5, 605–640, 2008,
http://www.biogeosciences-discuss.net/5/605/2008/.
Cottrell, M. T., Mannino, A., and Kirchman, D. L.: Aerobic anoxy-genic phototrophic bacteria in the Mid-Atlantic Bight and the North Pacific gyre, Appl. Environ. Microbiol., 72, 1, 557–564, 2006.
Dandonneau, Y., Deschamps, P. Y., Nicolas, J. M., Loisel, H., Blan-chot, J., Montel, Y., Thieuleux, F., and Becu, G.: Seasonnal and interannual variability of ocean colour and composition of phy-toplankton communities in the North Atlantic, Equatorial Pacific and South Pacific, Deep-Sea Res. II, 51, 303–318, 2004. Dandonneau, Y., Montel, Y., Blanchot, J., Giraudeau, J., and
Neveux, J.: Temporal variability in phytoplankton pigments, picoplankton and coccolithophores along a transect though the North Atlantic and tropical southwestern Pacific, Deep-Sea Res. I, 53, 4, 689–712, 2006.
Duarte, C. M., Agusti, S., and Agawin, N. S. R.: Response of a Mediterranean phytoplankton community to increased nutrient inputs: a mesocosm experiment, Mar. Ecol. Progress Ser., 195, 61–70, 2000a.
Duarte, C. M., Agusti, S., Gasol, J. M., Vaqu´e, D., and Vazquez-Dominguez, E.: Effect of nutrient supply on the biomass struc-ture of planktonic communities: an experimental test on a Mediterranean coastal community, Mar. Ecol. Progress Ser., 206, 87–95, 2000b.
Falkowski, P. G. and LaRoche, J.: Acclimation to spectral irradi-ance in algae, J. Phycol., 27, 8–14, 1991.
Garczarek, L. Dufresne, A., Rousvoal, S., West, N., Mazard, S., Marie, D., Claustre, H., Raimbault, P., Post, A., and Partensky, F.: High Vertical and Low Horizontal Microdi-versity of Prochlorococcus Genotypes in the Mediterranean Sea in Summer, FEMS Microbiol. Ecol. doi:10.1111/j.1574-6941.2007.00297.x, 2006.
Gieskes, W. W. C., Kraay, G. W., Nontji, A., Setiapermana, D., and Sutomo, D.: Monsoonal alternation of a mixed and a layered structure in the phytoplankton of the euphotic zone of the Banda Sea (Indonesia): A mathematical analysis of algal pigment fin-gerprints, Netherlands J. Sea Res., 22, 123–137, 1988.
Goericke, R.: Bacteriochlorophyll-a in the ocean: is anoxygenic bacterial photosynthesis important?, Limnol. Oceanogr., 47, 1, 290–295, 2002.
Goericke, R. and Repeta, D. J.: The pigments of Prochlorococcus marinus: the presence of divinyl chlorphyl a and b in a marine procaryote, Limnol. Oceanogr., 37, 2, 425–433, 1992.
Goericke, R. and Repeta, D. J.: Chlorophylls-a and b and di-vinyl chlorophylls-a and b in the open subtropical North Atlantic Ocean, Mar. Ecol. Progress Ser., 101, 3, 307–313, 1993. G´omez, F., Claustre, H., Raimbault, P., and Souissi, S.: Two
High-Nutrient Low Chlorophyll phytoplankton assemblages: the trop-ical central Pacific and the offshore Per´u-Chile Current, 4, 1535– 1554, 2007.
Grob, C., Ulloa, O., Claustre, H., Alarcon, G., Huot, Y., and Marie, D.: Contribution of picoplankton to the particulate attenuation coefficient (cp) and organic carbon concentration (POC) in the eastern South Pacific, 4, 1461–1497, 2007.
Guillard, R. R. L., Murphy, L. S., Foss, P., and Liaaen-Jensen, S.: Synechococcus spp. as likely zeaxanthin-dominant ultra-phytoplankton in the North Atlantic, Limnol. Oceanogr., 30, 2, 412–414, 1985.
Hardy, J., Hanneman, A., Behrenfield, M., and Horner, R.: Environ-mental biogeography of near-surface phytoplankton in the south-east Pacific ocean, Deep-Sea Res. I, 43, 10, 1647–1659, 1996. Hooker, S. B., Van Heukelem, L., Thomas, C. S., Claustre,
H., Ras, J., Barlow, R., Sessions, H., Schluter, L., Perl, J., Trees, C., Stuart, V., Head, H., Clementson, L., Fishwick, J.,
Llewellyn, C., and Aiken, J.: The second SeaWiFS HPLC Anal-ysis Round-Robin Experiment (SeaHARRE-2), NASA, God-dard Space Flight Center, Maryland, Technical Memorandum NASA/TM-2005-212787, 112 pp., 2005.
Huot, Y., Babin, M., Bruyant, F., Grob, C., Twardowski, M. S., and Claustre, H. : Does chlorophyll-a provide the best index of phytoplankton biomass for primary productivity studies?, Bio-geosciences, 4, 853–868, 2007,
http://www.biogeosciences.net/4/853/2007/.
Jeffrey, S. W. and Vesk, M.: Introduction to marine phytoplank-ton and their pigment signatures, in: Phytoplankphytoplank-ton pigment in oceanography: Guidelines to modern methods, edited by: Jef-frey, S. W., Mantoura, R. F. C., and Wright, S. W., UNESCO, 33–84, 1997.
Johnson, G. C. and McPhaden, M. J.: Interior pycnocline flow from the Subtropical to the Equatorial Pacific Ocean, J. Phys. Oceanogr., 29, 12, 3073–3089, 1999.
Johnson, Z. and Howd, P.: Marine photosynthetic performance forcing and periodicity for the Bermuda Atlantic Time Series, 1989–1995, Deep-Sea Res. I, 47, 8, 1485–1512, 2000.
Johnson, Z. I., Zinser, E. R., Coe A., McNulty N. P., Malcolm E., Woodward S., and Chisholm S. W.: Niche partitioning among Prochlorococcus ecotypes along Ocean-scale environmental gra-dients, Science, 311, 1737–1740, 2006.
Kolber, Z. S., Plumley, F. G., Lang, A. S., Beatty, J. T., Blankenship, R. E., VanDover, C. L, Vetriani, C., Koblizek, M., Rathgeber, C., and Falkowski, P. G.: Contribution of aerobic photoheterotrophic bacteria to the carbon cycle in the ocean, Science, 292, 2492– 2495, 2001.
Lami, R., Cottrel, M. T., Ras, J., Ulloa, O., Obernosterer, I., Claus-tre, H., Kirchman, D. L., and Lebaron, P.: High abundances of aerobic anoxygenic photosynthetic bacteria in the South Pacific Ocean, Appl. Environ. Microbiol., 73, 13, 4198–4205, 2007. Landry, M. R., Ondrusek, M. E., Tanner, S. J., Brown, S. L.,
Con-stantinou, J., Bidigare, R. R., Coale, K. H., and Fitzwater, S.: Biological response to iron fertilization in the eastern equatorial Pacific (IronEx II). I. Microplankton community abundances and biomass, Mar. Ecol. Progress Ser., 201, 27–42, 2000.
Larsen, A., Fonnes Flaten, G. A., Sandaa, R. A., Castberg, T., Thyrhaug, R., Erga, S. R., Jacquet, S., and Bratbak, G.: Spring phytoplankton bloom dynamics in Norwegian coastal waters: Microbial community sucession and diversity, Limnol. Oceanogr., 49, 1, 180–190, 2004.
Letelier, R. M., Karl, D. M., Abbott, M. R., and Bidigare, R. R.: Light driven seasonnal patterns of chlorophyll and nitrate in the lower euphotic zone of the North Pacific Subtropical Gyre, Lim-nol. Oceanogr., 49(2), 508–519, 2004.
Longhurst, A. R.: Ecological geography of the sea, Academic Press, London, 398 pp., 1998.
MacIntyre, H. L., Kana, T. M., Anning, T., and Geider, R.: Photoac-climation of photosynthesis irradiance response curves and pho-tosynthetic pigments in microalgae and cyanobacteria, J. Phycol., 38, 17–38, 2002.
Mackey, M. D., Mackey, D. J., Higgins, H. W., and Wright, S. W.: CHEMTAX – a program for estimating class abundances from chemical markers: Application to HPLC measurements of phy-toplankton, Mar. Ecol. Progress Ser., 144, 265–283, 1996. Mahowald, N. M., Baker, A. R., Bergametti, G., Brooks, N.,
and Tegen, I.: Atmospheric global dust cycle and iron in-puts to the ocean, Global Biogeochem. Cy., 19, GB4025, doi:10.1029/2004GB002402, 2005.
Monger, B. C., Landry, M. R., and Brown, S. L.: Feeding selection of heterotrophic marine nanoflagellates based on the surface hy-drophobicity of their picoplankton prey, Limnol. Oceanogr., 44, 8, 1917–1927, 1999.
Moore, L. R., Goericke, R., and Chisholm, S. W.: Comparitive physiology of Synechoccus and Prochlorococcus: influence of light and temperature on growth, pigments, fluorescence and absorptive properties, Mar. Ecol. Progress Ser., 116, 259–275, 1995.
Moore, L. and Chisholm S.W.: Photophysiology of the Marine Cyanobacterium Prochlorococcus: Ecotypic Differences among Cultured Isolates, Limnol. Oceanogr., 44, 3, 1, 628–638, 1999. Morden, C. W. and Sherwood, A. R.: Continued evolutionary
sur-prises among dinoflagellates, Proc. Natl. Acad. Sci. USA., 99, 18, 11 558–11 560, 2002.
Morel, A. and Berthon, J. F.: Surface pigments, algal biomass pro-files and potential production of the euphotic layer: relationships reinvesitaged in view of remote sensing applications, Limnol. Oceanogr., 34, 1545–1562, 1989.
Morel, A. and Maritorena, S.: Bio-optical properties of oceanic wa-ters: a reappraisal, J. Geophys. Res., 106, C4, 7163–7180, 2001. Morel, A., Gentili, B., Claustre, H., Babin, M., Bricaud, A., Ras, J., and Tieche, F.: Optical properties of the “clearest” natural waters, Limnol. Oceanogr., 52, 1, 217–229, 2007.
O’Reilly, J. E., Maritorena, S., Mitchell, B. G., Siegel, D. A., Carder, K. L., Garver, S. A., Kahru, M., and McClain, C.: Ocean color chlorophyll algorithms for SeaWiFS, J. Geophys. Res., 103, C11, 24 937–24 954, 1998.
Parsons, T. R. and Strickland, J. D. H.: Discussion of spectrophoto-metric determination of marine plankton pigments with revised equations of as certaining chlorophyll-a and carotenoids, J. Mar. Res., 21, 3, 155–163, 1963.
Partensky, F., Blanchot, J., Lantoine, F., Neveux, J., and Marie, D.: Vertical structure of picophytoplankton at different trophic sites of the tropical northeastern Atlantic Ocean, Deep-Sea Res. I, 43, 8, 1191–1213, 1996.
Partensky, F., Hess, W. R., and Vaulot, D.: Prochlorococcus, a Ma-rine Photosynthetic Prokaryote of Global Significance, Micro-biol. Mol. Biol. R., 63, 1, 106–127, 1999.
Pr´ezelin, B. B., Hofmann, E. E., Mengelt, C., and Klinck, J. M.: The linkage between Upper Circumpolar Deep Water (UCDW) and phytoplankton assemblages on the west Antarctic Peninsula continental shelf, J. Mar. Res., 58, 165–202, 2000.
Raimbault, P., Garcia, N., and Cerrutti, F.: Distribution of inorganic and organic nutrients in the South Pacific Ocean. Evidence for long-term accumulation of organic matter in nitrogen-depleted waters, 4, 3041–3087, 2007.
Scharek, R., Latasa, M., Karl, D. M., and Bidigare, R. R.: Temporal variations in diatom abundance and downward vertical flux in the oligotrophic North Pacific gyre, Deep-Sea Res. I, 46, 1051–1075, 1999.
Signorini, S. R., McClain, C. R., and Dandonneau, Y.: Mixing and phytoplankton bloom in the wake of the Marquesas Islands, Geo-phys. Res. Lett., 26, 3121–3124, 1999.
Singler, H. R. and Villareal, T. A.: Nitrogen inputs into the euphotic zone by vertically migrating Rhizosolenia mats, J. Plankton Res., 27, 6, 545–556, 2005.
Stuart, V., Ulloa O., Alarcon, G., Sathyendranath, S., Major, H., Head, E. J. H., and Platt, T.: Bio-optical characteristics of phy-toplankton populations in the upwelling system off the coast of Chile, Rev. Chil. Hist. Natl., 77, 87–105, 2004.
Twardowski, M. S., Claustre, H., Freeman, S. Stramski, D., and Huot, Y.: Optical Backscattering Properties of the “Clearest” Natural Waters, Biogeosciences Discuss., 4, 2441–2491, 2007, http://www.biogeosciences-discuss.net/4/2441/2007/.
Uitz, J., Claustre, H., Morel, A., and Hooker, S.: Vertical distribu-tion of phytoplankton communities in open ocean: an assessment based on surface chlorophyll, J. Geophys. Res., 111, C08005, doi:10.1029/2005JC003207, 2006.
Van Heukelem, L. and Thomas, C. S.: Computer-assisted high-performance liquid chromatography method development with applications to the isolation and analysis of phytoplankton pig-ments, J. Chromatogr. A, 910, 31–49, 2001.
Venrick, E. L.: The distribution and significance of Richelia in-tracellularis Schmidt in the North Pacific Central Gyre, Limnol. Oceanogr., 19, 3, 437–445, 1974.
Vidussi, F., Claustre, H., Manca, B. B., Luchetta, A., and Marty, J. C.: Phytoplankton pigment distribution in relation to upper thermocline circulation in the eastern Mediterranean Sea during winter, J. Geophys. Res., 106, C9, 19 939–19 956, 2001. Villareal, T. A., Joseph, L., Brzezinski, M. A., Shipe, R. F.,
Lip-schultz, F., and Altabet, M. A.: Biological and chemical charac-teristics of the giant diatom Ethmodiscus (Bacillariophyceae) in the central north Pacific gyre, J. Phycol., 35, 896–902, 1999. Wagener, T., Guieu, C., Losno, R., Bonnet S., and Mahowald,
N.: Revisiting atmospheric dust export to the South Hemisphere ocean, Global Biogeochem. Cy., doi:10.1029/2007GB002984, in press, 2008.
Wright, S. W. and Jeffrey, S. W.: Fucoxanthin pigment markers of marine phytoplankton analysed by HPLC and HPTLC, Mar. Ecol. Progress Ser., 38, 259–266, 1987.
Yentsch, C. S. and Menzel, D. W.: A method for the determination of phytoplankton chlorophyll and phaeophytin by fluorescence, Deep-Sea Res., 10, 221–231, 1963.