A
B
C
Mix10X+O3 MIX10X 0 20 40 60 80 100 120 140 160Testis volume Seminiferous cord Interstitium
Mix1X
*
*
%
of control
Figure 2: Effect of the MIX before or after ozonation on rat fetal testis development. Testis were explanted from 15.5-day-old rat fetuses cultured for 3 days. Cross sectional areas of the whole testis (A) and seminiferous cords (B) were measured for all sections. The interstitium volume was calculated as the difference between the total testis and the seminiferous cords. Quantitative data are expressed as % of the respective control cultures (C) and are represented as the mean ± SEM from 3 to 4 cultures. *p<0.05 in the paired statistical comparison with the corresponding control values.
Figure 3:Effect of the MIX before or after ozonation on the total numbers of Sertoli cells and gonocytes in the 15.5-day-old rat fetal testis cultured for 3 days. Sertoli cells (red dots) and Gonocytes (green dots) were counted on histological sections after immunohistochemical detection of AMH (A). Scale bar represents 20μm.
Quantitative data are expressed as % of the control cultures (B) and are represented as the mean ± SEM from 3 to 4 cultures. *p<0.05 compared with the corresponding control testis using a paired t-test.
0 20 40 60 80 100 120 140
Sertoli cell / testis Gonocyte / testis
% c o n tr o l Mix10X+O3 Mix1X MIX10X
B
*
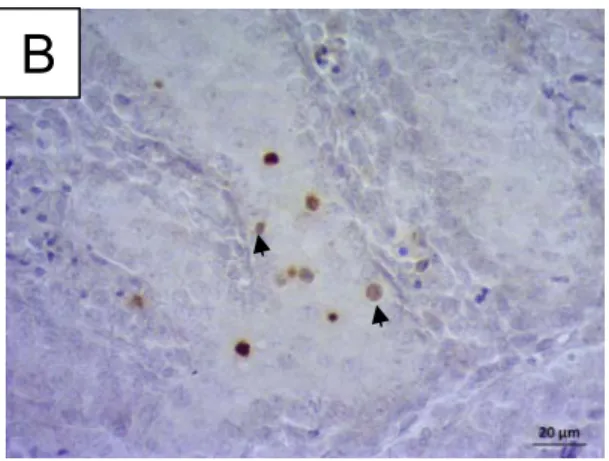
Figure 4: Effect of the MIX before or after ozonation on cell proliferation and apoptosis in testes from 15.5 days old rat fetuses in organ culture for 3 days. A: Proliferative Sertoli cells and Gonocytes were identified using PCNA and AMH double staining. Only PCNA-negative gonocytes (asterix) could be observed, but PCNA-positive (arrowhead) and PCNA-negative (arrow) Sertoli cells (positive for AMH) were counted. B: Apoptotic cells were identified as cleaved-caspase 3- positive (arrowheads). C: the percentage of PCNA-positive Sertoli cells was measured in at least 400 cells and is represented as the mean ± SEM from 3 cultures. D: Apoptosis was quantified as the percentage of tubules containing none, 1-3 cells or more cleaved-caspase 3 positive cells in at least 60 tubules per sample (n=6 and 3 for the Mix 10X and the Mix 10X +O3respectively)
*
A
C
0 10 20 30 40 C Mix 10X C Mix 10X + O3 % proliferati v e S ertoli cel lsB
D
MIX10X+O3 Control MIX10X % Tubule s 0 20 40 60 80 1000 cell/tubules 1-3 cells/tubule > 3 cells
*
*
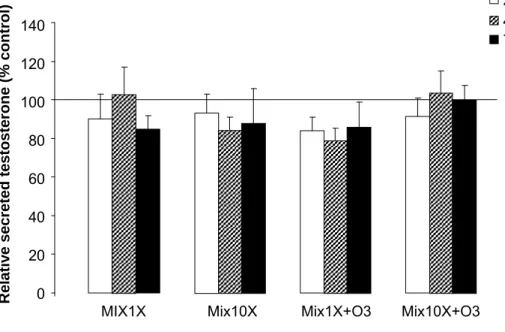
Figure 5:Effect of the MIX before or after ozonation on testosterone secretion from 15.5 days old rat fetal testes in organ culture for 3 days. Media were changed every 24 h and their testosterone content was measured by ELISA. Values (mean ± SEM) are the relative testosterone secretion, expressed as the percentage of the control value from 6 to 9 cultures. 0 20 40 60 80
MIX1X Mix10X Mix1X+O3 Mix10X+O3
R e la ti v e secre te d test os
MIX 10X + 50 μg/L O3 EtOH (0.01%) +50 μg/L O3
Supplemental Table 2.Retention times and molecular ion mass to charge ratios of target compounds and their labelled surrogates
LOD: Limit of detection
12 0.24 4.2 295.18 297.18 17α-ethinylestradiol 13C2- 17α-ethinylestradiol 2.5 0.05 1.2 287.17 Estriol 7.5 0.15 3.3 271.18 273.18 -Estradiol 13C2-β-Estradiol 6.5 0.13 4.4 269.16 271.16 Estrone 13C2- Estrone Method LOD (ng/L) HPLC-MS LOD (µg/L) Retention time (min) [M-H] -Compound
Supplemental Table 3: Sertoli cells and Gonocytes average diameters measured out of at least 100 cells 12.06 ± 0.40 11.93 ± 0.35 12.55 ± 0.30 7.93 ± 0.13 8.06 ± 0.13 7.74 ± 0.45 Controls 10X MIX 10X MIX + O3 Gonocytes Sertoli cells
Supplemental Figure 1:Effect of the MIX before or after ozonation on 15.5 days old rat fetal testes development in organ culture for 3 days. Immunostaining for AMH (A-C) was done to visualize Sertoli cell cytoplasm and seminiferous cord structure.
Immunostaining for P450 Side-chain cleavage (D-F) was done to visualize Leydig cells (Asterix). Analysis of successive sections showed that the compared to controls (A and D), neither the the 10X MIX (B and E) nor the 10X MIX + O3 (C and F) had an effect on seminiferous cord organization (A-C), AMH expression in Sertoli cells (A-C) and
P450scc expression in Leydig cells F). Scale bar represents 20μm (A-C) or 15μm (D-F).