DESCRIPTION AND APPLICATIONS OF A 3D MATHEMATICAL MODEL FOR
HORIZONTAL ANODE BAKING FURNACES
Mounir Baiteche1, Duygu Kocaefe1, Yasar Kocaefe1, Daniel Marceau1,
Brigitte Morais2, Jacques Lafrance2
1University of Quebec at Chicoutimi, Dept. of Applied Sciences, 555, boul. De l’Université, Chicoutimi, Quebec, Canada G7H 2B1
2Aluminerie Alouette Inc., 400, Chemin de la Pointe-Noire, C.P. 1650, Sept-Îles, Quebec, Canada, G4R 5M9
Keywords: Carbon anodes, horizontal anode baking furnace, 3D model, analysis of furnace performance Abstract
In aluminum industry, carbon anodes are consumed continuously during alumina reduction in the electrolysis cells. Anodes are made of calcined coke, butt, and recycled anode particles and pitch as the binder. Green anodes are baked in large furnaces where they attain specific properties in terms of density, mechanical strength, and electrical conductivity. Baking is an important and costly step in carbon anode production. The proper operation of the furnace provides the required anode quality. Mathematical modeling allows the prediction of the heating profile of anodes during baking. Taking into account all the important phenomena, a 3-dimensional transient mathematical model was developed to reproduce numerically the different stages of the baking process in the furnace. The predictions give a detailed view of the furnace operation and performance. In this article, the 3D model is described, and the results on the impact of various parameters on furnace behavior are presented.
Introduction
The production of carbon anodes for the primary aluminum industry is carried out in several steps. A mixture of raw materials [1] (calcined coke, recycled anodes, butts, and coal tar pitch) is prepared and mixed or kneaded to make a paste. Using this paste, green anodes are formed in a vibro-compactor [2]. The green anodes are baked in large furnaces specially designed for the baking of carbon anodes [3]. Anode baking is one of the most important and most expensive steps of the manufacturing process [4]. The total baking cost is estimated to exceed 60% [5]. The anode baking furnaces are considered as a countercurrent heat and mass exchanger [6].
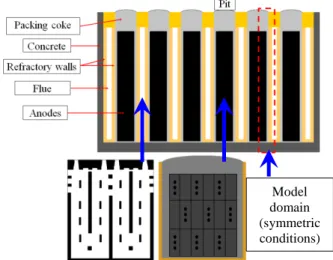
The particularity of a baking furnace is that the anodes are kept in pits covered with packing coke during the baking process because their movement is risky due to their likely combustion upon exposure to air at high temperatures. The pits are surrounded by flue walls built with refractory bricks. Figure1 shows a cross section of a horizontal anode baking furnace and the model domain when the symmetry can be assumed (discussed in the next section). This type of furnace is composed of two rows arranged in parallel. Each row contains several sections, each of which consists of flues and pits. The anodes are covered with packing coke (granular calcined coke) which serves as a mechanical support for anodes during baking, a thermal insulator to reduce heat losses, and a barrier to air to avoid the burning of anodes [7]. The anodes are first preheated and then heated to temperatures between 1000°C to 1200°C; and this is followed by the cooling phase. These steps occur during a fire cycle as various ramps move through the furnace. Preheating of the anodes is achieved through the combustion of volatiles [8] while much of the energy necessary to achieve the maximum desired temperature for the baking of anodes is provided by the combustion of fuel (either natural gas or oil).[9].
A considerable number of phenomena occur during the baking of anodes. The baking process must be carried out under conditions that will provide the anode quality needed.
Figure 1 : A schematic view of a horizontal anode baking furnace and the model domain if symmetry could be assumed Changes occur in and around the furnace during its design life, and variations in its operation may result in different qualities of anodes [10]. Control of these variations is essential in order to maintain the anode quality, which is important for the stability of electrolytic cells [11, 12]. Plant tests can also be carried out to test the effect of the changes in the furnace operation on the quality of anodes [13, 14]. Such tests are usually expensive and could intervene with the production. One solution to alleviate this problem is the simulation of the baking furnace and the baking process using mathematical models to predict and test numerically the impact of operational parameters or geometry on the furnace performance and anode quality [15, 16].
In this article, a three-dimensional transient model for horizontal anode baking furnaces will be presented along with some of the results of a number of simulations.
Mathematical model
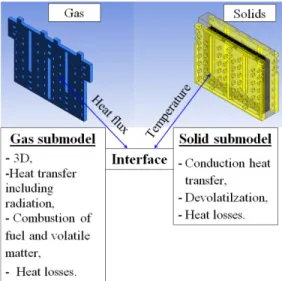
A 3D transient mathematical model was built; and it takes into account all the important phenomena occurring in the horizontal anode baking furnace. The model is built in two separate parts that constitute the furnace; one part is the flue where the gas circulates and the combustion of fuel and volatiles occur. The second part represents the solids: anodes arranged in several rows and columns, the packing coke covering the anodes, and the refractory wall which separates the pit from the flue. In the transient 3D model, each part is built separately with exact geometric details, and then an interface was created linking the two parts to represent the entire furnace.
Model domain (symmetric conditions)
A baking furnace comprises of flues and pits, thus the combination of a flue and a pit could be taken as a basic unit. In most cases, for reasons of computer memory (mesh size) and computation time, half of a flue and half of a pit (half of gas, refractory wall, packing coke, and half of anode blocks) are considered in modelling as shown in Figure 1 by the red frame. However, the 3D model considers the complete representation of the flue and pit geometries if required in cases such as the study on the impact of flue wall deformation on the baking process. The mathematical model was developed using the Ansys CFX-commercial code. Phenomena that occur in the two part of the furnace (solids and gas) are different so specific equations are solved in each part of the model. On the gas side (flue), the flow, heat transfer (including radiation), and mass transfer equations are solved. The solution accounts for the combustion of fuel and volatiles. On the solid side, the heat transfer by conduction is solved, considering the variation of the thermal diffusivity of various solids as a function of temperature and the evolution of volatiles from the anodes. The heat losses from the furnace to the surroundings are also considered.
Figure 2 shows an overview of the model of the baking furnace with an entire pit and two adjacent complete flues. The model was constructed based on the geometry presented by Chen [17].
Figure 2: Overview of the 3D mathematical model The modeling of anode baking furnaces started in the early 1980s. The first models are of the type known as process models. In this type of models, the geometry of the flue is usually simplified, and the flow is not solved in detail. Mass and energy balances are performed on the gas after which an assessment is made on solids to predict the temperature in anodes at different stages of baking. Among the first models developed, the one presented by Furman and Martirena [18] was specially designed for a vertical furnace. Several models were developed later with similar simplifications, each time including further details and better representation of the baking process [19-21]. In these studies, most of the phenomena were handled using simplified or empirical approaches (air infiltration, devolatilization, combustion, pressure variation in flue, etc.). More detailed process models started to appear in the literature [22-25].
For the analysis of the furnace geometry, the first trials were seen in 1981 [26]. In this work, a mathematical model was developed based on heat balance to determine the anode temperature profile during baking, and a physical model was built to visualize the flow in the flue for different geometries using water as the fluid.
More complex 3D models began to be developed in order to further analyze the geometry of the baking furnace. The geometry of the flue determines the gas flow distribution and the resulting heat and mass exchange with the solids, combustion and temperature distributions. Using these models, detailed velocity and temperature profiles are obtained, and the geometry of the flue can be modified to improve the baking process as it was presented in the work of Kocaefe et al. [27]. Other works of similar nature have appeared since [28, 29]. The detailed information provided by the 3D mathematical help evaluate how various changes in geometry or operation affect the process. In the 3D model presented in this paper, all important phenomena occurring during anode baking are considered along with the geometric details of the flue and the pit. To simulate an anode baking furnace, the governing equations are solved [30].
In the flue (gas side), the following equations are solved: - Continuity equation
𝜕𝜕𝜕𝜕
𝜕𝜕𝜕𝜕 + ∇ ∙(𝜕𝜕𝜌𝜌) = 0 - Navier-Stokes (momentum) equation
𝜕𝜕(𝜕𝜕𝜌𝜌)
𝜕𝜕𝜕𝜕 + ∇ ∙(𝜕𝜕𝜌𝜌 ⊗ 𝜌𝜌) = −∇𝑃𝑃 + ∇ ∙ 𝜏𝜏 + 𝑆𝑆𝑀𝑀
- Energy equation (with the contribution of radiative heat transfer using P1 or Monte Carlo)
𝜕𝜕(𝜕𝜕ℎ𝑡𝑡𝑡𝑡𝑡𝑡)
𝜕𝜕𝜕𝜕 − 𝜕𝜕𝑃𝑃
𝜕𝜕𝜕𝜕 + ∇ ∙(𝜕𝜕 𝜌𝜌 )
= ∇ ∙ (𝜆𝜆 ∇𝑇𝑇) + ∇ ∙ (𝜌𝜌 ∙ 𝜏𝜏) + 𝜌𝜌 ∙ 𝑆𝑆𝑀𝑀+ 𝑆𝑆𝐸𝐸
- Equations for chemical species (mass transfer) 𝜕𝜕𝜕𝜕𝑌𝑌𝑖𝑖 𝜕𝜕𝜕𝜕 + 𝜕𝜕𝜕𝜕𝑌𝑌𝑖𝑖𝑢𝑢𝑗𝑗 𝜕𝜕𝑥𝑥𝑗𝑗 = − 𝜕𝜕𝜕𝜕𝑌𝑌𝑖𝑖𝑢𝑢𝑗𝑗 𝜕𝜕𝑥𝑥𝑗𝑗 + 𝑊𝑊𝑖𝑖𝜔𝜔̇𝑖𝑖
- The equations of k-ε turbulence model 𝜕𝜕(𝜕𝜕𝜌𝜌) 𝜕𝜕𝜕𝜕 + ∇ ∙(𝜕𝜕 𝜌𝜌 𝜌𝜌) = ∇ ∙ ��𝜇𝜇 +𝜇𝜇𝜎𝜎𝑡𝑡 𝑘𝑘� ∇𝜌𝜌� + 𝑃𝑃𝑘𝑘+ 𝑃𝑃𝑘𝑘𝑘𝑘 − 𝜕𝜕 𝜀𝜀 𝜕𝜕(𝜕𝜕𝜀𝜀) 𝜕𝜕𝜕𝜕 + ∇ ∙(𝜕𝜕 𝜌𝜌 𝜀𝜀) = ∇ ∙ ��𝜇𝜇 + 𝜇𝜇𝑡𝑡 𝜎𝜎𝜀𝜀� ∇𝜀𝜀� + 𝜀𝜀 𝜌𝜌 (𝐶𝐶𝜀𝜀1 (𝑃𝑃𝑘𝑘 + 𝑃𝑃𝜀𝜀𝑘𝑘) − 𝐶𝐶𝜀𝜀2𝜕𝜕 𝜀𝜀)
- The rate for the combustion reaction [24] 𝜔𝜔̇𝑖𝑖= 𝜌𝜌0 𝜕𝜕 �𝜌𝜌� 𝑒𝑒𝜀𝜀 �
−𝐸𝐸
𝑅𝑅𝑅𝑅� �𝑚𝑚𝑚𝑚𝑓𝑓𝑓𝑓𝑓𝑓𝑓𝑓�𝑎𝑎 �𝑚𝑚𝑚𝑚𝑂𝑂 2�
𝑘𝑘
In the pit (solids), the model solves the following equations: - The transfer of heat by conduction
𝜑𝜑�⃗ = −𝜆𝜆 ∇��⃗𝑇𝑇 - The evolution of volatiles [31] from anodes
𝜕𝜕𝜕𝜕 𝜕𝜕𝜕𝜕 = 𝜌𝜌0 𝑒𝑒�
−𝐸𝐸
𝑅𝑅𝑅𝑅� (1 − 𝜕𝜕)𝑛𝑛 Measurement campaigns
The anode temperatures in the furnace are difficult to measure [32-34]. Their arrangement in the furnace and the corrosive nature of the medium make the measurement of temperatures in the entire volume for one complete cycle quite challenging. However, measurements at some points can provide information on the transient evolution of the temperature in the positions where the thermocouples are placed. A campaign was carried out in the plant to measure the anode temperatures in a pit at the positions shown in Figure 3. After the anodes were loaded into the pit, K-type thermocouples were placed on the anodes in the top row before filling the pit with packing coke.
Figure 3 : Arrangement of thermocouples on anodes for temperature measurement
The thermocouples were connected to a data logger to record changes in temperature throughout the baking cycle. Measured temperatures were compared with the predicted model results at the same positions where the thermocouples were placed.
Crucibles filled with a certain amount of green petroleum coke were placed in the holes of the anodes in order to determine the final anode temperatures via the measurement of calcined-coke crystalline length. These were also compared with the results predicted by the 3D model.
Results and discussions
In the furnace, gas composition changes due to the combustion of fuel and volatiles. This change in the composition results in change in gas mass fractions all gases including CO2, H2O, and
O2. Figure 4 shows the O2 mass fraction along the furnace. The
concentrations of gases CO2 and H2O are important since they
participate in the heat exchange by radiation in the flue. The absorption coefficients along the furnace were calculated based on the CO2 and H2O gas concentrations for the radiative heat transfer
calculations.
Figure 4: Variation of O2 mass fraction along the furnace (for a
fire cycle of 10 sections excluding the forced cooling side) Several simulations were performed with the transient 3D model for validation by comparing the predicted results with the measured temperatures. In cases where the temperatures are high, the radiative heat transfer is important. A number of radiation models available in the code Ansys CFX were tested taking into account the variation of the gas absorption coefficient along the furnace as a function of the CO2 and H2O concentrations (due to
the combustion, in different sections, of fuel and volatiles coming from the carbonization of pitch in anode during baking); and two appear to be suitable for modelling the heat transfer by radiation in the flue of a baking furnace: P1 and Monte Carlo.
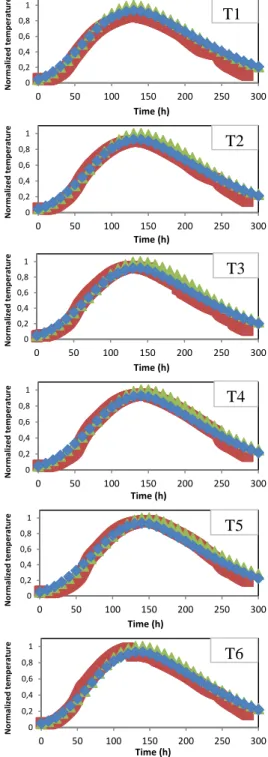
A study was carried out for validation using the measured anode temperatures during baking. The results are presented in Figure 5 for six positions on anodes (as illustrated in Figure 3) where the measured values are compared with the predicted values obtained using the P1 and Monte Carlo radiation models. There appears to be a reasonably good agreement between the results predicted by the model and the measurements obtained from the furnace. The results also show P1 and Monte Carlo models give similar results.
The Monte Carlo model was chosen to carry out the rest of the simulations of the baking furnace with the transient 3D model.
Figure 5 Comparison of measured (red, thermocouples 1 to 6 in Figure 3) and predicted temperature profiles obtained with the two
radiation models (Monte-Carlo: green, P1: blue)
The results of the maximum anode temperatures determined with the crystalline length measurements of the calcined petroleum coke in the crucibles were compared with those predicted by the transient 3D model at the same locations. Figure 6 shows the calculated temperature contours in the anodes as well as the prediction accuracy at four positions, determined by dividing the measured value by the calculated value at that position. The comparison made using the measurements at various points
0,06 0,08 0,1 0,12 0,14 0,16 0,18 0,2 0,22 0,24 1 2 3 4 5 6 7 8 9 10 O2 m ass f ra ct io n Section number 0 0,2 0,4 0,6 0,8 1 0 50 100 150 200 250 300 No rm al ize d t em pe ra tur e Time (h)
T1
0 0,2 0,4 0,6 0,8 1 0 50 100 150 200 250 300 No rm al ize d t em pe ra tur e Time (h)T2
0 0,2 0,4 0,6 0,8 1 0 50 100 150 200 250 300 No rm al ize d t em pe ra tur e Time (h)T3
0 0,2 0,4 0,6 0,8 1 0 50 100 150 200 250 300 No rm al ize d t em pe ra tur e Time (h)T4
0 0,2 0,4 0,6 0,8 1 0 50 100 150 200 250 300 No rm al ize d t em pe ra tur e Time (h)T5
0 0,2 0,4 0,6 0,8 1 0 50 100 150 200 250 300 No rm al ize d t em pe ra tur e Time (h)T6
(including the four reported here) indicates a good agreement between model predictions and plant data.
Figure 6 Contours of the predicted temperatures in the anodes and comparison with the measured values at four positions The results of the validation study indicate that the transient 3D model can reproduce the temperature profiles measured on anodes with acceptable accuracy and thus the model could be used for further studies.
The transient 3D model allows visualizing in detail the evolution of temperature in the furnace throughout the fire cycle. Figure 7 shows the three transverse planes in a section where the temperature contours are presented in Figure 8 at different times during baking. These contours show the temperatures in the flue, refractory wall, packing coke, and anode blocks (the flue on the right hand side and the anodes on the left hand side). Plane 2, which is in the middle, shows the temperatures in the baffle as well (as indicated by black box in Figures 7 and 8).
Figure 7 Positions of the transversal planes in given section on which the temperatures are presented in Figure 8.
The temperature contours shown in Figure 8 represent different stages of baking. Figure 8a shows the temperature distribution during preheating at 40 and 70 hours of the baking cycle. Similarly, Figure 8b gives the temperature contours at 90 and 140 hours of the baking cycle. In these figures, the flue gas temperatures are higher than the anode temperatures as expected. During the cooling period, the anode temperatures are higher than the flue gas temperatures as shown in Figure 8c 180 and 250 hours of the baking cycle. The direction of gas flow is from the Plane 1 side to the Plane 3 side as can be seen from all the
temperature contours in different planes at a given time. Figure 8 Temperature contours on the transversal planes shown in Figure 7 in the furnace at different stages of baking:
(a) preheating, (b) heating, and (c) cooling. a
b
c
Plane 1 Plane 2 Plane 3 Plane 1 Plane 2 Plane 3
Preheating 40 hours Preheating 70 hours
Heating 90 hours Heating 140 hours
Cooling 180 hours Cooling 250 hours
Plane 1 Plane 2 Plane 3 Plane 1 Plane 2 Plane 3
Plane 1 Plane 2 Plane 3 Plane 1 Plane 2 Plane 3
Gas flow Cooling sections
The work presented by Maiwald et al. [35] shows that the condition of a flue wall in a horizontal baking furnace is an important factor for its operation and the production of good quality carbon anodes. Aging of the flue is usually accompanied by its deformation. This creates difficulties in loading and unloading anodes in the pits. From the thermal point of view, the heating pattern of the anodes may also be altered; and in such situations, the specific fuel consumption is usually adversely affected. This type of problem can be studied comprehensively with a 3D model considering the entire pit and flue geometries. The transient 3D model developed in this project was used to determine the impact of the deformation of a flue on one side of a pit while keeping the flue on the other side unchanged (straight). In Figure 9, the two cases are shown schematically. Figure 9a shows a pit with two straight flues on both sides. Figure 9b represents a pit with one straight flue and one deformed flue.
Figure 9 Schematic representation of a) two straight flues and (b)one straight/one deformed flue surrounding a pit ((a) represents
a new section and (b) represents an old section)
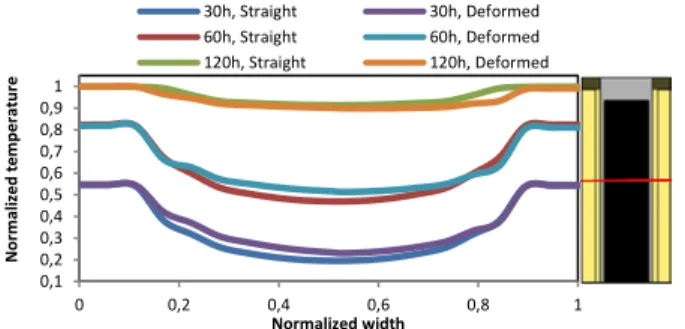
The results of the comparison of temperature profiles on a line in the transverse direction are given in Figure 11. The red line on the image shows the position of the temperature profiles across the two flues and the pit in-between. Temperature profiles are presented at different times during baking: 30, 60, and 120 hours. During the preheating period (30 and 60 hours) where the heating rate is relatively high, the temperature differences between the two cases are more pronounced and the anode temperatures are higher in the case with the deformed flue. More rapid heating could change the devolatilization pattern, and consequently affect the anode quality. After 120 hours, both profiles approach each other due to soaking in the heating section.
Also, the temperature profiles are symmetrical in the case of straight flues; however, the profiles are no longer symmetrical for the case with the deformed flue. Anodes are not heated uniformly from both sides due to the deformation of the one of the flues.
Figure 10 Comparison of temperature profiles during baking for the two cases shown in Figure 10. The image on the right shows
the position of the profile.
Conclusions
A transient 3D mathematical model was developed for horizontal anode baking furnaces. This model takes into account all the important phenomena that occur during baking and represents exactly the furnace geometry. The validation of the model was carried out by comparing the predictions with the plant data, and a suitable radiation model was selected. The results indicate that the model gives reasonably good predictions. Once validated, the model was used for the simulation of the furnace under different conditions. Here, some results of the study on the impact of the deformation of flue walls on the anode baking process are presented.
Acknowledgements
The technical and financial support of Aluminerie Alouette Inc. as well as the financial support of the National Science and Engineering Research Council of Canada (NSERC), Développement économique Sept-Îles, the University of Québec at Chicoutimi (UQAC), and the Foundation of the University of Québec at Chicoutimi (FUQAC) are greatly appreciated.
Nomenclature 𝜕𝜕 Density [kg/m]
𝜕𝜕 Time [s] 𝜌𝜌 Velocity [m/s] 𝑃𝑃 Pressure [Pa] 𝜏𝜏 Share stress tensor 𝑆𝑆𝑀𝑀 Momentum source
ℎ𝑡𝑡𝑡𝑡𝑡𝑡 Specific total enthalpy [J/kg] 𝜆𝜆 Thermal conductivity [W/m K] 𝑇𝑇 Temperature [°C]
𝑆𝑆𝐸𝐸 Energy source [W/m3 s]
𝑌𝑌𝑖𝑖 Mass fraction of component i in the fluid
𝑥𝑥𝑗𝑗 Spatial coordinates
𝑢𝑢𝑗𝑗 Velocity of fluid component j [m/s] 𝑊𝑊𝑖𝑖 Molecular weight of component i [kg/mol]
𝜌𝜌 Turbulence kinetic energy per unit mass [m2/s2]
𝜇𝜇 Molecular dynamic viscosity [kg/m s] 𝜇𝜇𝑡𝑡 Turbulent viscosity [kg/m s]
𝜎𝜎𝑘𝑘 , 𝜎𝜎𝜀𝜀 Constant for the k- 𝜀𝜀 turbulence model
𝜀𝜀 Turbulence dissipation rate [m2/s3]
𝑃𝑃𝑘𝑘 , 𝑃𝑃𝜀𝜀𝑘𝑘 and 𝑃𝑃𝑘𝑘𝑘𝑘 Shear production of turbulence
𝐶𝐶𝜀𝜀1 𝜌𝜌 − 𝜀𝜀 turbulence model constant
𝐶𝐶𝜀𝜀2 𝜌𝜌 − 𝜀𝜀 turbulence model constant
𝜑𝜑�⃗ Heat flux density [W/m2]
𝜕𝜕 Conversion factor for devolatilization 𝜌𝜌0 Devolatilization pre-exponential factor [s-1]
𝐸𝐸 Activation energy [J/mol]
𝑅𝑅 Universal gas constant: 8.314 [J/K mol] 𝑛𝑛 Reaction order
𝜔𝜔̇𝑖𝑖 Reaction rate [kg/m3 s]
𝑚𝑚𝑚𝑚𝑓𝑓𝑓𝑓𝑓𝑓𝑓𝑓, 𝑚𝑚𝑚𝑚𝑂𝑂2 Fuel and O2 mass fractions References
1. Grindstaff, L.S. and E.E. Hardin, Production of pitch
and coke from raw petroleum coke, 1983, Google
Patents.
2. Sandvik, E., R. Blindheim and H.M. Bø, Vibration
Forming of Carbon Blocks, in Essential Readings in Light Metals: Electrode Technology for Aluminum Production2013, John Wiley and Sons. p. 339-350.
0,1 0,2 0,3 0,4 0,5 0,6 0,7 0,8 0,91 0 0,2 0,4 0,6 0,8 1 No rm al ize d t em pe ra tur e Normalized width 30h, Straight 30h, Deformed 60h, Straight 60h, Deformed 120h, Straight 120h, Deformed
3. Kvande, H., 3 - Production of primary aluminium, in
Fundamentals of Aluminium Metallurgy, R. Lumley,
Editor 2011, Woodhead Publishing. p. 49-69.
4. Hurlen, J. and T. Naterstad, Recent developments in
carbon baking technology. Jom-Journal of the Minerals
Metals & Materials Society, 1991. 43(11): p. 20-25. 5. Barham, B., S.G. Bunker and D. O'Hearn, States, firms,
and raw materials: The world economy and ecology of aluminum1994: Univ of Wisconsin Press.
6. Holdner, D.N., Procedure and apparatus for baking
carbon bodies, 1981, Google Patents.
7. Charette, A., Y. Kocaefe and D. Kocaefe, Le Carbone
dans l'Industrie d'Aluminium. 2012.
8. Dernedde, E., A. Charette, T. Bourgeois and L. Castonguay. Kinetic phenomena of the volatiles in ring
furnaces. in Light Metals. 1986. New Orleans, LA,
USA: Metallurgical Soc of AIME.
9. Keller, F., M.W. Meier and V. Gusberti, Specific
Energy Consumption in Anode Bake Furnaces. 2013.
10. Perruchoud, R.C., M.W. Meier and W.K. Fischer.
Survey on worldwide prebaked anode quality. in LIGHT METALS-WARRENDALE-PROCEEDINGS-. 2004.
TMS.
11. Bain, G.A., J.P. Pruneau and J. Williams, Effect of
prebake anode baking temperature on potroom performance. Met Soc AIME, TMS 1971, 11p, 1971.
12. Thonstad, J. and E. Olsen, Cell operation and metal
purity challenges for the use of inert anodes. JOM,
2001. 53(5): p. 36-38.
13. Belitskus, D.L., An evaluation of relative effects of coke,
formulation, and baking factors on aluminum reduction cell anode performance. Light Metals 1993, ed. S.K.
Das1992. 677-681.
14. Fischer, W.K., F. Keller, R.C. Perruchoud and S. Oderbolz. Baking parameters and the resulting anode
quality. in Light Metals: Proceedings of Sessions, TMS Annual Meeting (Warrendale, Pennsylvania). 1993.
Denver, CO, USA: Publ by Minerals, Metals & Materials Soc (TMS).
15. Baiteche, M., Y. Kocaefe, D. Kocaefe, B. Morais and J. Laffance. A 3D mathematical model of a horizontal
anode baking furnace as a design tool. in Materials Science and Technology Conference and Exhibition 2013, MS and T 2013. 2013. Montreal, QC.
16. Kocaefe, Y., N. Oumarou, M. Baiteche, D. Kocaefe, B. Morais and M. Gagnon. Use of mathematical modelling
to study the behavior of a horizontal anode baking furnace. in TMS Light Metals. 2013. San Antonio, TX.
17. Chen, E.S., Thermomechanical improvement of a flue
wall in anode baking furnace. Unitecr’95 Congress :
unified International Technical Conference on Refractories,: Fourth Biennial Worldwide Conference on Refractories, 1995. Vol : 3: p. 432 - 439.
18. Furman, A. and H. Martirena, A mathematical model
simulating an anode baking furnace. AIME Light
Metals, 1980: p. 515-522.
19. Bui, R.T., A. Charette and T. Bourgeois, Simulating the
process of carbon anode baking used in the
aluminum-industry. Metallurgical Transactions B-Process
Metallurgy, 1984. 15(3): p. 487-492.
20. Bui, R.T., A. Charette and T. Bourgeois, A
computer-model for the horizontal flue ring furnace. Ieee
Transactions on Industry Applications, 1984. 20(4): p. 894-901.
21. Bui, R.T., E. Dernedde, A. Charette and T. Bourgeois,
Mathematical simulation of a horizontal flue ring furnace. Journal of Metals, 1983. 35(12): p. 114-114.
22. Bourgeois, T., R.T. Bui, A. Charette, B.A. Sadler, A.D. Tomsett, M.E.T. Minerals and S.O.C. Mat,
Computer-simulation of a vertical ring furnace. Light Metals
19901990. 547-552.
23. Bui, R.T., A. Charette, T. Bourgeois and E. Dernedde,
Performance analysis of the ring furnace used for baking industrial carbon electrodes. Canadian Journal
of Chemical Engineering, 1987. 65(1): p. 96-101. 24. Dernedde, E., M.A. Thibault, R.T. Bui and A. Charette,
Simulating the dynamics of the anode baking ring furnace. Journal of Metals, 1984. 36(12): p. 95-95.
25. Peter, S., A. Charette, R.T. Bui, A. Tomsett and V. Potocnik, An extended two-dimensional mathematical
model of vertical ring furnaces. Metallurgical and
Materials Transactions B: Process Metallurgy and Materials Processing Science, 1996. 27(2): p. 297-304. 26. Keller, F. and J.H.M. Disselhorst, Modern anode bake
furnace developments. Light Metals: Proceedings of
Sessions, AIME Annual Meeting (Warrendale, Pennsylvania), 1980: p. 611-621.
27. Kocaefe, Y.S., E. Dernedde, D. Kocaefe, R. Ouellet, Q. Jiao and W.F. Crowell. 3D mathematical model for the
horizontal anode baking furnace. in Light Metals: Proceedings of Sessions, TMS Annual Meeting (Warrendale, Pennsylvania). 1996. Anaheim, CA, USA.
28. Severo, D.S., V. Gusberti and E.C.V. Pinto. Advanced
3D modelling for anode baking furnaces. in TMS Light Metals. 2005. San Francisco, CA.
29. Zhang, L.Q., C.G. Zheng and M.H. Xu, Simulating the
heat transfer process of horizontal anode baking furnace. Developments in Chemical Engineering and
Mineral Processing, 2005. 13(3-4): p. 447-458. 30. CFX, Solver theory guide. User Manual, 2010.
31. Kocaefe, D., A. Charette and L. Castonguay, Green
coke pyrolysis: investigation of simultaneous changes in gas and solid phases. Fuel, 1995. 74(6): p. 791-799.
32. Foosnæs, T., N. Kulset, H. Linga, G.R. Næumann and A. Werge-Olsen, Measurement and Control of the
Calcining Level in Anode Baking Furnaces, in Essential Readings in Light Metals2013, John Wiley & Sons, Inc.
p. 418-421.
33. Lossius, L.P., I. Holden and H. Linga, The equivalent
temperature method for measuring the baking level of anodes. Essential Readings in Light Metals: Electrode
Technology for Aluminum Production, Volume 4, 2013: p. 422-426.
34. Zupanič, F. and A. Šibila, Temperature distribution in
an anode baking furnace and its influence on the properties of carbon anodes. Metall, 2000. 54(9): p.
494-499.
35. Maiwald, D. and W. Leisenberg, Flue condition index -
A new challenge to increase flue lifetime, operational safety and fuel efficiency in open pit anode baking furnaces, in Light Metals 2006, Vol 3: Carbon Technology, T.J. Galloway, Editor 2006. p. 625-629.