HAL Id: tel-02475412
https://tel.archives-ouvertes.fr/tel-02475412
Submitted on 12 Feb 2020
HAL is a multi-disciplinary open access archive for the deposit and dissemination of sci-entific research documents, whether they are pub-lished or not. The documents may come from teaching and research institutions in France or abroad, or from public or private research centers.
L’archive ouverte pluridisciplinaire HAL, est destinée au dépôt et à la diffusion de documents scientifiques de niveau recherche, publiés ou non, émanant des établissements d’enseignement et de recherche français ou étrangers, des laboratoires publics ou privés.
Influence of hydrodynamics and correlation of metal
contents with settling velocities on contamination
distribution in a stormwater detention basin
Xiaoxiao Zhu
To cite this version:
Xiaoxiao Zhu. Influence of hydrodynamics and correlation of metal contents with settling velocities on contamination distribution in a stormwater detention basin. Environmental Engineering. Université de Lyon, 2019. English. �NNT : 2019LYSEI035�. �tel-02475412�
1
N°d’ordre NNT : 2019LYSEI035
THESE de DOCTORAT DE L’UNIVERSITE DE LYON
opérée au sein de
INSTITUT NATIONAL DES SCIENCES APPLIQUEES DE LYON
Ecole Doctorale
ED162
MECANIQUE, ENERGETIQUE, GENIE CIVIL, ACOUSTIQUE
Spécialité/ discipline de doctorat
: GENIE CIVILSoutenue publiquement le 26/06/2019, par :
Xiaoxiao ZHU
INFLUENCE OF HYDRODYNAMICS AND
CORRELATION OF METAL CONTENTS
WITH SETTLING VELOCITIES ON
CONTAMINATION DISTRIBUTION IN A
STORMWATER DETENTION BASIN
Devant le jury composé de :
DEWALS, Benjamin Professeur à Université de Liège Président
RUBAN, Véronique Directrice de recherche à IFSTTAR Rapporteure
SECHET, Philippe Maître de Conférences HDR à Grenoble INP Rapporteur
BERTRAND-KRAJEWSKI, Jean-Luc Professeur à INSA de Lyon Examinateur
BLANC-BISCARAT, Denise Maître de Conférences à INSA de Lyon Examinatrice
LE COZ, Jérôme Chargé de recherche – HDR à IRSTEA Examinateur
CLEMENS, Francois Professeur à TU Delft Examinateur
DEWALS, Benjamin Professeur à Université de Liège Examinateur
LIPEME KOUYI, Gislain Maître de Conférences HDR à INSA de Lyon Directeur de thèse GIBELLO, Claire Responsable Service Exploitation Métropole de Lyon Invitée
Cette thèse est accessible à l'adresse : http://theses.insa-lyon.fr/publication/2019LYSEI035/these.pdf © [X. Zhu], [2019], INSA Lyon, tous droits réservés
3
Cette thèse est accessible à l'adresse : http://theses.insa-lyon.fr/publication/2019LYSEI035/these.pdf © [X. Zhu], [2019], INSA Lyon, tous droits réservés
5
Acknowledgements
I would like to acknowledge all peoples and institutions who have contributed to the accomplishments of this thesis.
First of all, I would like to express my great gratitude to my supervisor, Gislain Lipeme Kouyi, for his continuous guidance and support of my PhD work, for his availability, motivation, enthusiasm and immense knowledge.
I am grateful to all the members of jury: Véronique Ruban and Philippe Sechet to report this thesis and their constructive comments; Benjamin Dewals as president and all other jury members Jean-Luc Bertrand-Krajewski, Francois Clements, Denise Blanc-Biscarat, Jérôme Le Coz to evaluate my PhD work and their constructive comments.
I would like to especially thank Jean-Luc Bertrand-Krajewski for welcoming me at DEEP and scientific guidance; Vincent Chatain, Mathieu Gauthier, Denise Blanc-Biscarat, Cécile Delolme and Jean-Baptiste Aubin for their bio-chemical and statistic knowledge and scientific guidance; Stéphane Vacherie, Nicolas Walcker, Serge Naltchayan, Dominique Babaud, Richard Poncet and Hervé Perier-Camby for all technical and data supports; Nathalie Dumont and David Lebouil for ICP analyse supports; Nathalie Goubet, Valérie Boiron, Frédérique Dutel and Agnès Brunella for all the administrative help.
I would also like to show my gratitude to Francois Clemens, Jérôme Le Coz and Joe Marner for their scientific suggestions on LSPIV. I appreciate the discussions on image treatment with Serge Miguet, Mihaela Scuturici, Catherine Pothier and Thomas Léglantier. Thanks to Laëtitia Bacot, for all the exchanges.
I would like to thank all the members of Laboratory DEEP, especially Coulomb team: Sylvie Barraud, Hélène Castebrunet, Pascal Le Gauffre, Frédéric Cherqui. Thanks to all Ph.D (past, present and future) and post-doc, especially Ainhoa and Alejandro, for all the exchanges (CFD group, conferences, daily discussions, etc), Hexiang for all scientific discussions and Robin, Céline, Christel, Santiago, Jérémie, Kamilia, Tanguy, Khiem, Luis, Rémy, Lucie, Ola, Manon, Quifang, Bomin, Valentine, Helen, Julie, Janett, Camille, Amin, Kévin, Ruben, Corrado, Bruno, for all types of happy discussions.
I would like to acknowledge OTHU, Métropole de Lyon, ANR CABRRES program, CSC for the scientific and financial supports.
Finally, I am very grateful to my family and friends, especially my parents, for their selfless support and love. Special thanks to my future husband Bonan, who not only shares my life, my happiness, my depression but also gives me scientific support all along of my thesis.
Cette thèse est accessible à l'adresse : http://theses.insa-lyon.fr/publication/2019LYSEI035/these.pdf © [X. Zhu], [2019], INSA Lyon, tous droits réservés
7
Abstract
Stormwater detention basins have three main functions: storing rainwater to prevent flooding, promoting settling of particulate pollutants, avoiding resuspension and remobilization of settled pollutants to the downstream. The design and the management of such facilities requires the knowledge of hydrodynamic and sediment characteristics, as well as the ability to predict areas where deposits are highly contaminated.
The main objective of this PhD work is to identify the areas where pollutant levels in sediments are high in detention and settling basin. The studied site is the stormwater detention basin (Django Reinhardt basin or DRB), which is an extended and dry basin at the outlet of an industrial watershed. This basin has been the subject of numerous investigations within the framework of the Field Observatory for Urban Water Management (or observatoire de terrain en hydrologie urbaine - OTHU in French).
First of all, the measurements of surface velocities by Large-Scale Particle Image Velocimetry (LSPIV) permits to better understand the hydrodynamic behaviour in the basin. These measurements were used to evaluate CFD (Computational Fluid Dynamics) models. This is the first time, to the author’s knowledge, this measurement technique has been applied in the case of stormwater management facilities. The results show that CFD models identify the main recirculation zone that promotes settling. These evaluated models were then used to simulate the transport of particulate pollutants, including sedimentation and resuspension. The exploitation of these simulations results enables to (i) identify the preferential areas where resuspended contaminated sediments may be conveyed to the downstream infiltration basin and (ii) predict the accumulation zones of some metals. Results also demonstrate that iron contents in sediments are strongly correlated to settling velocities and can be considered as a good indicator of the level of trace metal contamination of sediments.
The results obtained in this thesis contribute to improve the design of stormwater detention and settling basins and the management of contaminated sediments.
Keywords: Hydrodynamics, metal, resuspension, sediment, sedimentation, settling velocity, stormwater
Cette thèse est accessible à l'adresse : http://theses.insa-lyon.fr/publication/2019LYSEI035/these.pdf © [X. Zhu], [2019], INSA Lyon, tous droits réservés
9
Résumé
Les bassins de retenue-décantation ont trois fonctions principales : stocker les eaux pluviales pour éviter les inondations, favoriser la décantation des polluants particulaires, éviter la remise en suspension et la remobilisation des polluants décantés vers l’aval. La conception et la gestion de telles installations nécessitent de connaître les caractéristiques hydrodynamiques, celles des sédiments et de pouvoir prédire les zones où les dépôts sont fortement contaminés.
L’objectif principal de la thèse est d’identifier les zones où les teneurs en polluants sont élevées au niveau des sédiments des bassins de retenue-décantation. Le site d’étude est le bassin de rétention des eaux pluviales de Django Reinhardt (BDR), qui est un bassin sec à l’exutoire d’un bassin versant industriel. Ce bassin a fait l’objet de plusieurs études dans le cadre de de l'Observatoire de Terrain en Hydrologie Urbaine (OTHU).
Dans un premier temps, les mesures de vitesses de surface par LSPIV (Large-Scale Particle Image Velocimetry) ont permis de mieux comprendre l’hydrodynamique au sein de l’ouvrage. Ces mesures ont été exploitées pour évaluer les modèles CFD (Computational Fluid Dynamics). A notre connaissance, c’est la première fois que cette technique de mesure est appliquée au cas des ouvrages de gestion des eaux pluviales. Les résultats montrent que les modèles CFD identifient la principale zone de recirculation qui favorise la décantation. Ces modèles évalués ont ensuite été employés pour simuler le transport de polluants particulaires, leur sédimentation et leur remise en suspension. L’exploitation des résultats de ces simulations a permis d’indiquer les points où les sédiments sont remis en suspension et transférés vers le bassin d’infiltration à l’aval et de prédire les zones d’accumulation en métaux. Les résultats obtenus montrent également que les teneurs en fer dans les sédiments sont fortement corrélées aux vitesses de chute. Le fer pourrait être un bon indicateur du niveau de contamination des sédiments en certains métaux lourds.
Les résultats de cette thèse contribuent à améliorer les règles de conception des bassins de retenue-décantation des eaux pluviales et les stratégies de gestion des sédiments associés.
Mots-clés : Décantation, eaux pluviales, sédiments, métaux, remise en suspension, vitesse de chute, hydrodynamique
Cette thèse est accessible à l'adresse : http://theses.insa-lyon.fr/publication/2019LYSEI035/these.pdf © [X. Zhu], [2019], INSA Lyon, tous droits réservés
11
Table of contents
Acknowledgements ... 1 Abstract ... 7 Résumé ... 9 Table of contents ... 11 List of Figures ... 15 List of Tables ... 21List of Acronyms / Abbreviations ... 23
List of Variables ... 25
Introduction ... 27
Role of stormwater detention basin for urban stormwater management ... 28
Functions of stormwater detention basins and related challenges and scientific questions 28 Scientific investigations on DRB or other facilities and flow, and Research needs ... 30
Objectives and research strategy ... 35
Document structure ... 36
Chapter 1. Presentation of experimental site and sampling strategy ... 39
1.1. Experimental site ... 39
1.2. Strategy of sediment sampling ... 42
1.3. Design and installation of LW-HTS for sediments sampling at the inlet of DRB .. 43
1.3.1. Preliminary sediment sampling from measurement flume ... 43
1.3.2. Design of Hydrocyclone Trapping System (HTS) ... 45
1.3.3. CFD modelling of LW-HTS ... 46
1.3.4. Hydrodynamic behaviour ... 47
1.3.5. Particle tracking and trapping efficiency ... 49
1.3.6. Comparison of sediment characteristics from inlet and from traps in DRB .... 53
1.3.7. Section conclusions ... 56
1.4. Chapter conclusions... 56
Chapter 2. Application of LSPIV for free surface velocity measurement in DRB ... 57
2.1. Introduction ... 57
2.2. Methods and materials ... 58
Cette thèse est accessible à l'adresse : http://theses.insa-lyon.fr/publication/2019LYSEI035/these.pdf © [X. Zhu], [2019], INSA Lyon, tous droits réservés
12
2.2.1. Camera recording ... 58
2.2.2. LSPIV image treatment ... 59
2.2.3. Methodology and data exploitation ... 61
2.3. Results ... 65
2.3.1. Preliminary experiments in a small-sized laboratory condition - DSM-flux ... 65
2.3.2. Application for the DRB free surface velocity measurements ... 66
2.3.3. Evaluation of CFD modelling of DRB using LSPIV data ... 77
2.4. Discussions ... 81
2.4.1. Application of LSPIV in field stormwater detention basin ... 81
2.4.2. LSPIV benefits compared to other methods ... 81
2.4.3. Improvements for LSPIV application... 82
2.5. Chapter conclusions... 83
Chapter 3. Modelling of sediment resuspension and remobilization ... 85
3.1. Introduction ... 85
3.2. Methods and materials ... 86
3.2.1. CFD modelling ... 86
3.2.2. Determination of the amount of resuspended and remobilized particles ... 89
3.3. Results and discussions ... 90
3.3.1. Particle moving pattern with mean flow rate ... 90
3.3.2. Particle moving pattern under different flow rates ... 92
3.4. Chapter conclusions... 94
Chapter 4. Prediction of the distribution of trace metal contamination in DRB ... 97
4.1. Introduction ... 97
4.2. Methods and materials ... 99
4.2.1. Presentation of campaigns ... 99
4.2.2. Physical and chemical characterizations and determination of their correlation 100 4.3. Results ... 102
4.3.1. Physical and chemical characteristics from data of group I ... 102 4.3.2. Correlation between metal contents and settling velocity based on data of group II 105
13
4.3.3. Correlation matrix for different metals based on data of group II ... 107
4.3.4. Stability and variability of the correlation ... 107
4.3.5. Prediction of the distribution of trace metal contamination ... 110
4.4. Discussions ... 111
4.4.1. Use of Fe as indicator of pollution and for the prediction of contamination distribution ... 111
4.4.2. Use of settling velocity for stormwater detention basin sediments management 112 4.4.3. Relationship between sediments physical and chemical characteristics ... 112
4.4.4. Sediment management based on targeted dredging strategy ... 113
4.5. Chapter conclusions... 113
Conclusions and perspectives ... 115
Key conclusions ... 115
Perspectives ... 117
References ... 119
Appendix ... 133
Appendix A: Matlab code for Fe concentration distribution in DRB ... 133
Appendix B: Physical and chemical characteristics of sediments ... 135
Appendix C: Variability of the correlation between metal contents and settling velocity 138 Appendix D: New protocol for settling velocity distribution measurements ... 143
Présentation des résultats majeurs de la thèse – Résumé étendu exigé pour une thèse rédigée en anglais ... 147
Publications during the thesis ... 151
Cette thèse est accessible à l'adresse : http://theses.insa-lyon.fr/publication/2019LYSEI035/these.pdf © [X. Zhu], [2019], INSA Lyon, tous droits réservés
15
List of Figures
Figure 1. Hydrodynamic parameters and biophysico-chemical processes in detention-settling basins (Qe and Qs represent, respectively, the inlet and outlet flow rates, while Ce and Cs, represent respectively, the inlet and outlet concentrations of particles) (Lipeme Kouyi et al.,
2014a)………...26
Figure 2. Overall research strategy………...31
Figure 1.1. (a) Location of OTHU experimental sites in Lyon sewer system (adapted from OTHU website - http://www.graie.org/othu/): CSS = combined sewer system, CSOs = combined sewer overflow structures, WSUD = water sensitive urban design. (b) Django Reinhardt Basin (DRB) composed of a detention basin and infiltration basin. (c) Presentation of Chassieu catchment (Lipeme Kouyi et al., 2014b): blue lines surround the industrial watershed from which DRB receives water, orange lines represent the stormwater network. (d) Sketch of DRB. ... 40
Figure 1.2. (a) Scheme of measurement station for inlet water quality measurement, (b) photo of measurement flume. (Source: Nicolas Walcker) ... 42
Figure 1.3. (a) Sketch of DRB and sampling points, (b) Honeycomb-like sampling traps. .... 42
Figure 1.4. (a) Streamline of the fluid flow obtained by computational fluid dynamic (Q = 0.35 m3/s, main flow rate from inlet 1) and sediment characteristics, where locations of sediments of different sizes are represented in different colours: red circles for coarse particles, yellow for median, and green for fine. (b) Streamline of fluid flow and location of different sampling points (P01, P02, P04, P07, P12bis). (c) Sediment depth distribution measurement in Django Reinhardt basin. (adapted from Yan, 2013). ... 43
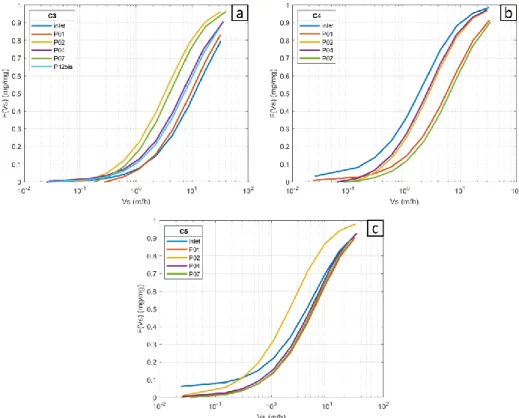
Figure 1.5. Comparison of physical characteristics of sediments collected from inlet flume and traps at P01, P07: (a) particle-size distribution, (b) cumulative particle-size distribution, (c) settling velocity distribution (except P01). ... 44
Figure 1.6. (a) Aerial view of basin (DRB), (b) Leaping-Weir and Hydrocyclone Trapping System (location shown in (a)), (c) Compositions of hydrocyclone. ... 46
Figure 1.7. Geometry of LW-HTS and some mesh details ... 47
Figure 1.8. Streamline of LW-HTS colored by velocity magnitude ... 47
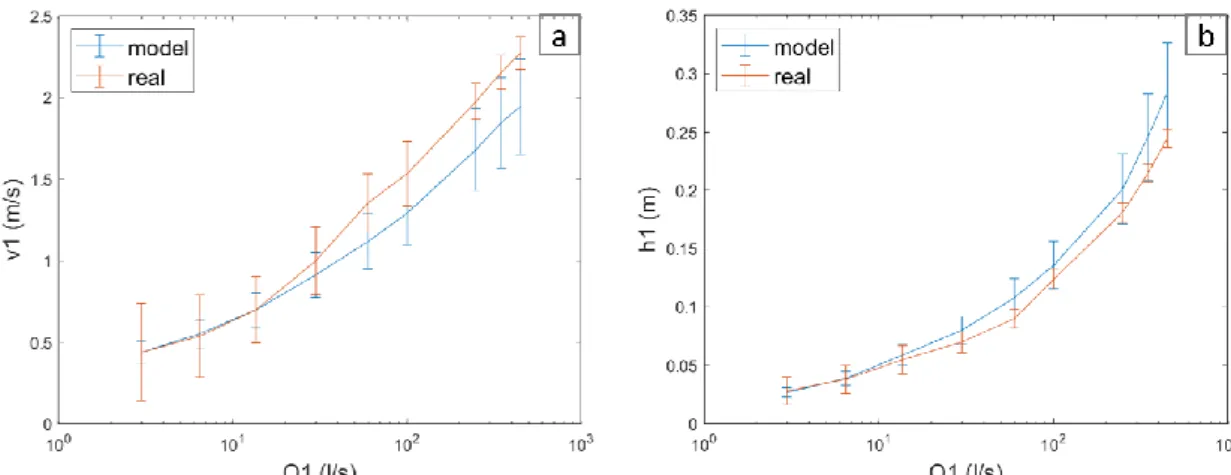
Figure 1.9. Comparison of measured and simulated water levels and mean velocities ... 48
Cette thèse est accessible à l'adresse : http://theses.insa-lyon.fr/publication/2019LYSEI035/these.pdf © [X. Zhu], [2019], INSA Lyon, tous droits réservés
16
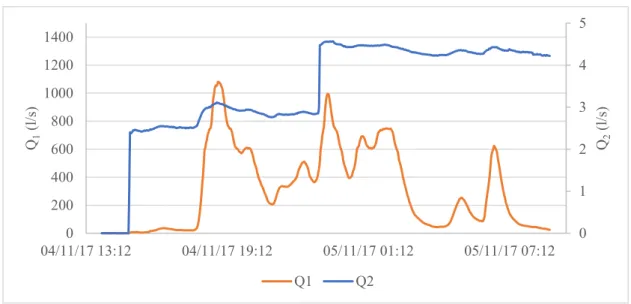
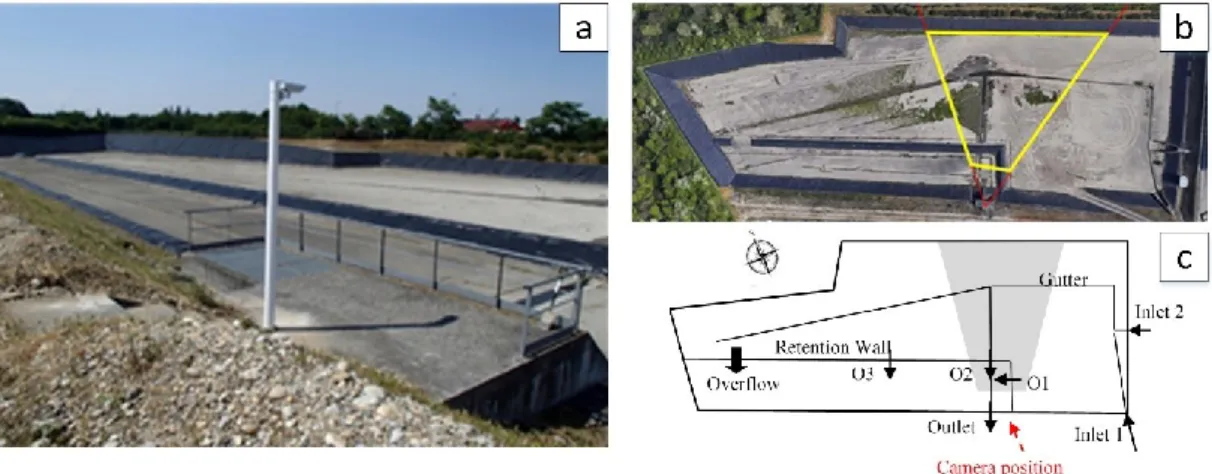
Figure 1.10. Example of 𝑄2 evolution due to trapped sediment at the T-connection of LW-HTS (rain event of 04-05 Nov 2017) ... 49 Figure 1.11. (a) Particle-size distribution, (b) cumulative particle-size distribution of injected and trapped artificial particles (obtained from experiments in situ) ... 50 Figure 1.12. Trapping efficiency according to CFD modelling results (𝑄1 = 13.65 l/s, particles of same characteristics of experiments) ... 51 Figure 1.13. (a-e) Trapping efficiency of HTS and (f-j) particles’ residence time in LW-HTS ... 52 Figure 1.14. Campaign timeline and sampling points for each campaign ... 53 Figure 1.15. Comparison of (a) & (c): particle -size distribution, (b) & (d) cumulative particle-size distibution of sediments from inlet and basin (C3 and C5, respectively). ... 55 Figure 1.16. Comparison of settling velocity distribution of sediments from inlet and basin (C3-C5) ... 55 Figure 2.1. (a) Camera Axis P1347 in situ, (b) Top view of DRB with camera viewshed surrounded by yellow lines (photo from Google Map). (c) Sketch of DRB with camera viewshed emphasized with grey background. ... 59 Figure 2.2. Schematic of DSM-flux in laboratory (Maté Marín et al., 2018) ... 62 Figure 2.3. Image orthorectification: (a) GPS measurement: base receiver of D-GPS Trimble, (b) GPS measurement: mobile receiver of D-GPS Trimble, measured at red point, corresponding to the vertical projection point (VPP) of Ground Control Point (GCP), (c) height measurement tool, pole with uniformly distributed markers (every 50 cm), with an example showing the pair of GCP (in blue) and VPP (in red), (d) raw image with GCPs, (e) orthorectified image with GCPs. ... 64 Figure 2.4. Comparison of PIV and ADV results (Q = 0.009 m3/s, boundaries of the
interrogation zone are marked as red lines): (a) Free surface velocity field with reduced measurement points obtained by PIV, (b) Velocity field at 2 cm under water surface obtained by ADV, (c) ADV measurement locations (•) and PIV calculations locations (*). Locations where relative differences of PIV and ADV results are less than 8% are represented in green, and in red when their relative differences range from 14% to 44%. Origin and x, y directions are marked in yellow. ... 66 Figure 2.5. Sensitivity test on length of image sequences: (a) Fudaa – 5s, (b) Fudaa – 10s, (c)
17
Fudaa – 18s, (d) PIVlab – 5s, (e) PIVlab – 10s, (f) PIVlab – 18s ... 67 Figure 2.6. Different scales of orthorectification: (a) original image (projective), (b) orthorectified image, (c) 0.1118 m/pixel, downsampling in x1, x2 and y, (d) 0.0437 m/pixel,
resolution unchanged in y, (e) 0.02 m/pixel, resolution unchanged in x1. x1, x2 and y are
represented in (b). ... 68 Figure 2.7. Sensitivity test on different scales of orthorectification: (a) Fudaa – 0.1118 m/pixel, (b) Fudaa – 0.0437 m/pixel, (c) Fudaa – 0.02 m/pixel, (d) PIVlab – 0.1118 m/pixel, (e) PIVlab – 0.0437 m/pixel, (f) PIVlab – 0.02 m/pixel ... 69 Figure 2.8. Sensitivity test on the size of IA and SA in Fudaa-LSPIV ... 70 Figure 2.9. Sensitivity test on the number of passes of different IA size in PIVlab: (a) 2 passes with IA size of 64, 32 pixels, (b) 3 passes with IA size of 64, 32, 16 pixels ... 71 Figure 2.10. Sensitivity test on PIVlab pre-treatment: (a) without pre-treatment, (b) CLAHE, (c) highpass, (d) intensity capping, (e) CLAHE + highpass, (f) CLAHE + intensity capping, (g) highpass + intensity capping, (h) CLAHE + highpass + intensity capping ... 72 Figure 2.11. Free surface velocity field extracted from 9 different videos with Fudaa-LSPIV: color bars represent the velocity magnitude in m/s ... 74 Figure 2.12. Free surface velocity field extracted from 9 different videos with PIVlab: color bars represent the velocity magnitude in m/s ... 75 Figure 2.13. Difference of velocity vectors extracted with Fudaa-LSPIV and PIVlab: color bars represent the magnitude of velocity vector differences in m/s, arrows represent their directions. ... 76 Figure 2.14. PIVlab treatment: (a) example of interrogation area(s), (b) treatment of velocities at image boundaries in PIVlab. ... 77 Figure 2.15. Free surface velocity field obtained by LSPIV and CFD modelling (color bars represent the velocity magnitude in m/s): (a-c) LSPIV, (d-f) CFD modelling. Black arrows indicate the recirculation direction, areas with red border represent camera viewshed. ... 78 Figure 2.16. (a) Streamline of the fluid flow obtained by CFD (Q = 0.35 m3/s, main flow rate). Locations of sediments of different sizes are represented in different colours: red circles for coarse particles, yellow for median and green for fine. (b) Sediment depth distribution measurement in DRB. Red borders represent the camera viewshed. (Adapted from Yan, 2013) ... 78
Cette thèse est accessible à l'adresse : http://theses.insa-lyon.fr/publication/2019LYSEI035/these.pdf © [X. Zhu], [2019], INSA Lyon, tous droits réservés
18
Figure 2.17. Comparison of CFD results obtained with symmetrical boundary (a/c/e) and VOF model (b/d/f) for free water simulation: (a&b) flow vector at free surface (limited at 1 m/s), (c&d) bed shear stress at the bottom, (e&f) bed turbulent kinetic energy at the bottom of DRB.
... 79
Figure 2.18. CFD modelling with 2 inlets (Q1 = 0.35 m3/s, Q2 = 0.175 m3/s)... 80
Figure 2.19. Wind direction illustration ... 80
Figure 3.1. Inlet flow rate against water depth for the rain event of 19-20 May 2017 ... 87
Figure 3.2. Correspondence of recorded particle status by model and real estimation status . 90 Figure 3.3. Escaped particle percentage with different (i) injection points, (ii) particle size, (iii) 𝐶𝐿(Q = 0.35 m3/s) ... 91
Figure 3.4. Escaped particle percentage with different inlet flow rates (𝐶𝐿 = 2) ... 93
Figure 3.5. Particle distribution with different (i) injection points, (ii) particle size, (iii) 𝐶𝐿 (Q = 0.35 m3/s) ... 93
Figure 3.6. Particle distribution with different inlet flow rates (𝐶𝐿 = 2) ... 94
Figure 4.1. Campaign timeline and sampling points for each campaign ... 99
Figure 4.2. Methodology of physical and chemical characterization ... 101
Figure 4.3. Principal component analysis (PCA) of physical and chemical characteristics based on the data of group I ... 103
Figure 4.4. (a-e) Correlation between metal contents [M] in g/kg DM and settling velocity (Vs) in mm/s based on data of group II; (f-j) Boxplot of different [M] with respect to each Vs. . 106
Figure 4.5. Correlation matrix of different trace metals contents in trapped particles: the distribution of each variable is listed on the diagonal. The bivariate scatter plots with their linear fits are displayed below the diagonal. The upper triangle contains the correlation coefficients and their significance levels. Each significance level is associated to a symbol: p-values of 0.001, 0.01, 0.05, 0.1 correspond to symbols of ***, **, * and , respectively. ... 107 Figure 4.6. (a-e) Distribution of concentrations of metals [M] and settling velocities (Vs): values from different campaigns are depicted by a set of colours, different markers are employed to discriminate locations, (f-j) Averaged metals concentrations (x-axis) and their coefficients of variation (y-axis): For particles of the same Vs, [M] are averaged among all
19
locations per campaign (marked as crosses and distinguished by colours), and among all campaigns per location (coloured in black and distinguished by markers). ... 109 Figure 4.7. Comparison of measured and simulated Fe and Pb contents distribution: P01, P02, P04, P07 locations are coloured in blue, orange, black and red, respectively. ... 111
Cette thèse est accessible à l'adresse : http://theses.insa-lyon.fr/publication/2019LYSEI035/these.pdf © [X. Zhu], [2019], INSA Lyon, tous droits réservés
21
List of Tables
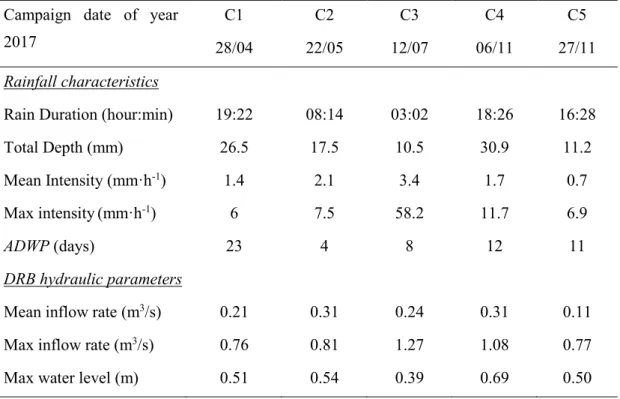
Table 1. Literature reviews and their relations to this PhD work……….29 Table 1.1. Characteristics of Django Reinhardt Basin (DRB) ... 41 Table 1.2. Comparison of physical characteristics of sediments collected from inlet flume and traps at P01 and P07 ... 45 Table 1.3. Dimensions of hydrocyclone ... 46 Table 1.4. Sediment transport modelling strategy ... 50 Table 1.5. Characteristics of the sampled rain events and corresponding hydraulic parameters in DRB ... 53 Table 1.6. Comparison of particle-size and settling velocity of sediments from inlet and basin ... 54 Table 2.1. Presentation of Fudaa-LSPIV and PIVlab tools for LSPIV image treatment ... 60 Table 2.2. ADV measuring parameters using Nortek Vectrino Velocimeter (Nortek, 2004) ... 63 Table 2.3 Optimized parameters applied in the LSPIV analysis ... 73 Table 3.1. Sediments characteristics of different sampling points (CFD inputs) ... 87 Table 3.2. Calculated BTKE thresholds from measured and calculated settling velocity ... 88 Table 4.1. Characteristics of the sampled rain events and corresponding hydraulic parameters in DRB ... 99 Table 4.2. Standard and protocols for physical and chemical analyses ... 100 Table 4.3. Physical and chemical characteristics of trapped sediments ... 104
Cette thèse est accessible à l'adresse : http://theses.insa-lyon.fr/publication/2019LYSEI035/these.pdf © [X. Zhu], [2019], INSA Lyon, tous droits réservés
23
List of Acronyms / Abbreviations
ADV Acoustic Doppler Velocimeter
APEO Alkylphenol ethoxylates
BSS Bed Shield Stress
BTKE Bed Turbulent Kinetic Energy
CFD Computational Fluid Dynamics
CLAHE Contrast Limited Adaptive Histogram Equalization
DCC Direct Cross Correlation
DFT Discrete Fourier transform
DRB Django Reinhart Basin
DSM-flux Device for Stormwater and combined sewer flows Monitoring and the control of pollutant fluxes
EDF Electricité de France – electricity of France company
GCPs Ground Control Points
HTS Hydrocyclone Trapping System
LOD Limit of detection
LOQ Limit of quantification
LW-HTS Leaping-Weir and Hydrocyclone Trapping System
IA Interrogative Area
Irstea National Research Institute of Science and Technology for Environment and Agriculture
LSPIV Large-Scale Particle Image Velocimetry
LWS Leaping-Weir System
NRMSD Normalized Root-Mean-Square Deviations
Cette thèse est accessible à l'adresse : http://theses.insa-lyon.fr/publication/2019LYSEI035/these.pdf © [X. Zhu], [2019], INSA Lyon, tous droits réservés
24
PAH Polycyclic aromatic hydrocarbon
PBDE Polybrominated diphenyl ethers
PIV Particle Image Velocimetry
PSVD Particle Settling Velocity Distribution
SA Searching Area
Sinlet Sediments sampled from inlet
Sbasin Sediments sampled from the bottom of basin
UVP Ultrasonic Velocity Profiler
25
List of Variables
ADWP Antecedent dry weather period
ART Average residence time
C Concentration
𝐶𝐿 Lagrangian time scale constant
CV Coefficient of variation
𝐷∗ Dimensionless particle diameter
𝑑 Particle diameter
Htotal Total Depth
F Forces
FD Drag coefficient depending on different particle’s and fluid’s characteristics
𝐺 Specific gravity
g Gravity acceleration
hmax Max water level
Imax Max intensity
Imean Mean Intensity
𝑘 Turbulent kinetic energy
[M] Metals concentrations
Q Inflow rate of DRB
Qmax Max inflow rate of DRB
Qmean Mean inflow rate of DRB
Q1 Inflow rate of LW-HTS
Q2 Flow rate between LWS and HTS
Cette thèse est accessible à l'adresse : http://theses.insa-lyon.fr/publication/2019LYSEI035/these.pdf © [X. Zhu], [2019], INSA Lyon, tous droits réservés
26
R Correlation coefficient
RD Rain Duration
RT Reference Time
𝑇 Integral time scale
𝑇𝐿 Fluid Lagrangian integral time
TSS TSS concentration
Turb Turbidity
u Velocity of the fluid
up Velocity of the particle 𝑢′, 𝑣′, 𝑤′ Velocity fluctuation
Vs Settling velocity
𝜀 Turbulent dissipation rate
𝜁 Normal distributed random number
𝜉 Coefficient
ρ Density of fluid
ρp Density of particle
27
Introduction
Impervious surfaces expand along with urbanization, which in turn leads to increasing quantities of urban runoff during wet weather, as well as deteriorating quality of receiving waters. On the one hand, urban runoff could be overloaded and cause flood to the downstream, which endangers human life and damages infrastructure. On the other hand, urban runoff waters are contaminated by many chemical compounds including trace metals, polycyclic aromatic hydrocarbons and endocrine disruptive chemicals (e.g. Barbosa et al., 2012; Gasperi et al., 2014; Zgheib et al., 2012). The overloaded and untreated runoff water contaminates streams, rivers and coastal water, and harms the health of aquatic habitats.
Under such circumstances, the undesirable impacts of stormwater runoff should be controlled by discreet management efforts and the concept of best management practice (BMP) is brought forward (Field and Tafuri, 2006). Stormwater detention basins are one of the most adopted BMPs in developed countries (Urbonas, 1994; Lawrence et al., 1996) and are effective to intercept and trap particulate pollutants (Maniquiz-Redillas et al., 2014). For example, they are found in most cities in France, Canada, US and other European countries (Urbonas, 1994). Their effectiveness has already been proven to prevent flooding and trap pollutants by sedimentation, such as suspended solids, trace metals, particulate nutrients and hydrocarbons (e.g. Marsalek and Marsalek, 1997; Maniquiz-Redillas et al., 2014).
The design and management of stormwater detention basins are then important to control stormwater quantity and quality. On the one hand, the volume of such basins should be large enough to receive stormwater coming from the watershed area. On the other hand, the geometry should be well designed to increase sediment removal performance by settling. For example, Persson (2000) found that length-to-width ratio, locations and numbers of inlets and outlets, and subsurface berm are key elements for basin design. A subsurface berm or island in front of the inlet is recommended for a better hydraulic performance concerning short-circuiting, effective volume and amount of mixing. In order to better design and manage such facilities, it is of great significance to understand the hydrodynamic behaviour and sediments transport mechanisms. Hence, this PhD research is carried out in this context and in the framework of ANR CABRRES national program (on physical, chemical, microbiological, ecotoxicological characterization of sediments and the role of hydrodynamics on the variability of their characteristics, Lipeme Kouyi et al., 2014a).
This introduction is organized in 5 sections. The first section introduces stormwater detention basins and their main roles for urban stormwater management. The second one reveals their functions and related challenges. The third section summarizes the scientific investigations on
Cette thèse est accessible à l'adresse : http://theses.insa-lyon.fr/publication/2019LYSEI035/these.pdf © [X. Zhu], [2019], INSA Lyon, tous droits réservés
28
Django Reinhardt Basin (DRB) and other similar basins and points out potential improvements. The main objectives of this PhD work and the general strategy to achieve them are then presented. Finally, the general structure of this document is explained.
Role of stormwater detention basin for urban stormwater management
Stormwater detention basins are key components of BMPs, which allow to reduce runoff peak flows and control flow rate to the downstream. These basins continue to evacuate stormwater after rain events and remain dry during dry weather. They are initially designed to avoid flooding, and are later proved to be efficient to trap sediments and their associated pollutants by means of settling (Grizzard et al., 1986; Loganathan et al., 1994; Randall et al.1982). Stormwater detention basins now have three main functions:
storing rainwater to prevent flooding,
trapping particulate pollutants thanks to settling processes
avoiding resuspension and remobilization of settled pollutants to the downstream. Thanks to the basin dimensions and the limitation of outflow, the runoff peaks can be reduced. As most of the pollutants, such as trace metals, Polycyclic Aromatic Hydrocarbons (PAHs) and some pathogenic bacteria, in urban stormwater are conveyed in particulate phase (e.g. Ashley et al., 2004; Barbosa et al., 2012; Gasperi et al., 2014; Zgheib et al., 2012), the decontamination procedure by stormwater detention basins through settling processes is appropriate. The removal percentage of total suspended solids (TSS) is found to be mainly between 50% and 91% (see e.g. Bardin, 1999; Chebbo, 1992; Torres, 2008). Meanwhile, they are nature-based solutions, which do not require extra energy.
Functions of stormwater detention basins and related challenges and scientific
questions
Stormwater detention basins are prone to accumulating large quantities of sediments that must be removed regularly in order to ensure their optimal trapping efficiency and guarantee their storage capacities. In addition, accumulated deposits in stormwater detention basins are ecosystems with a very rich fauna habitat, which could be resuspended by incoming water and represent a risk of contamination for surrounding superficial or underground aquatic environments. The dissemination in surrounding air of the bacterial contaminants adsorbed on really fine sediments (bacterial aerosol) could be a microbiological risk, e.g. through an inhalation of aerosols during maintenance (Bernardin-Souibgui et al., 2018). It is then essential to predict deposition zones and to mitigate the remobilization of particulate contaminants. Sustainable management of accumulated and contaminated sediments is also a big challenge as few reliable treatment or reuse method can be applied (e.g. Petavy et al., 2009).
29
Geochemical characterization can help to identify contamination zones, but requires large amounts of sampling procedures and laboratory measurements, which are complex, expensive and time-consuming. For example, Sébastian (2013) characterized sediments at twelve representative locations at the bottom, as well as at inlet and outlet of DRB. However, the analyses were limited to certain locations and the contamination distribution could not be drawn. On the other hand, computational fluid dynamic (CFD) or other modelling approaches could provide a convenient and low-cost way to determine contaminated deposition zones. Indeed, the knowledge of the velocity field (e.g. recirculation zones) is of great importance to predict sedimentation zones (Dufresne et al., 2009; Yan et al., 2014). For these purposes, their hydrodynamic behaviour (velocity fields, turbulence and shear stresses) and the mechanisms of the transport and transformations of sediments (sedimentation, resuspension, aggregation, collision and uptake of contaminants) have to be mastered. The use of an appropriate measurement technique to get a deep picture of velocity field seems useful.
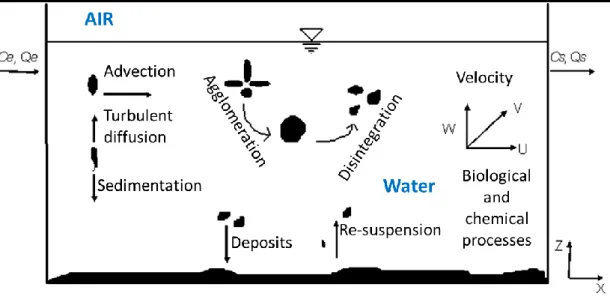
Figure 1 shows a simplified sketch of a detention-settling basin and highlights the key mechanisms inside. It also demonstrates the interaction between hydrodynamics and biophysico-chemical processes. Sediment transport process in flow includes advection by flow velocity, sedimentation and erosion (Julien, 2010). Deposits occur at the bottom of basin thanks to the gravity of sediments, while the settled sediments may also resuspend by the incoming flow when the forces from the flow (e.g. shear stress and turbulence) exceed the resistance forces (e.g. gravity and frictional force from the boundary). Scientists proposed two boundary thresholds for deposition and resuspension movements, i.e. the shear stress (e.g. Julien, 2010; Stovin and Saul; 1994; Vanoni, 1975) and the turbulent kinetic energy (e.g. Dufresne, 2008; Yan et al, 2014). In addition, sediment transformations, including agglomeration, disintegration and other biological and chemical processes (e.g. oxidation-reduction reaction, biodegradation, uptake of contaminants) often occur and their spatial variability is strongly impacted by the hydrodynamics of the basin (e.g. Becouze-Lareure et al., 2018; Bernardin-Souibgui et al., 2018).
Cette thèse est accessible à l'adresse : http://theses.insa-lyon.fr/publication/2019LYSEI035/these.pdf © [X. Zhu], [2019], INSA Lyon, tous droits réservés
30
Figure 1. Hydrodynamic parameters and biophysico-chemical processes in detention-settling basins (Qe and Qs represent, respectively, the inlet and outlet flow rates, while Ce and Cs, represent respectively, the inlet and outlet concentrations of particles) (Lipeme Kouyi et al., 2014a)
Following scientific questions related to above matters can be pointed out:
How does hydrodynamics (turbulence, shear flows, velocity field) interact with sediments and how this interaction affects sediments transport and transformations in settling-detention basins? What are their relationships?
Which indicator(s) can be enhanced from the interaction between hydrodynamics and sediments physico-chemical characteristics? How these indicators can help for the management of the accumulated contaminated sediments?
Scientific investigations on DRB or other facilities and flow, and Research needs
Different researches have been carried out about the evolution of microbiological, physical, chemical and ecotoxicological characteristics of accumulated sediments in DRB located at Chassieu, France. The hydrodynamic behaviour and mechanisms of the transport and transformations of sediments have also been studied in this facility.Torres (2008) characterized sediments collected from twelve points at the bottom of DRB and studied especially settling velocity distributions and their uncertainty. Both spatial and temporal variability on settling velocity distribution have been found (Torres et al., 2007). A 2D numerical model (Torres et al., 2008) for hydrodynamic and sediment transport simulation has been established accounting for inflow rate, water height, concentrations of TSS.
31
Sébastian (2013) investigated micropollutants in urban stormwater (from inlet and outlet of DRB) and in sediments. 100 substances have been analysed in dissolved and particulate phases in water at the inlet and outlet and 67% micropollutants have been detected. The removal efficiency of DRB has been proved regarding the majority of trace metals and PAH, as well as Polybrominated diphenyl ethers (PBDE) and Alkylphenol ethoxylates (APEO) for some rain events. High concentrations of micropollutants are observed in accumulated sediments, especially for trace metals and PAH. Negative removal efficiencies were also observed due to the resuspension of already settled micropollutants.
Yan (2013) established a 3D CFD model for the simulation of hydrodynamic behaviour and mechanism of sediment transport. A new boundary condition based on the comparison between Bed Turbulent Kinetic Energy (BTKE) and particles settling energy computed using their settling velocities has been proposed to determine sediment sedimentation and resuspension condition (Yan et al., 2014). The removal efficiencies and deposition zones are predicted and correspond to the observations.
Several investigations have also been realised in other stormwater basins and tanks. Dufresne (2008) carried out experiments and numerical modelling on a rectangular physical model. Flow pattern and sediment transports (efficiency, spatial distribution of deposits) have been performed. Particle tracking using a threshold value of BTKE boundary condition has been applied and compared with experimental results, and finally extended to a real large basin. El-Mufleh et al. (2013) characterized the trace metal fractionation in sediments from runoff water infiltration basins. For example, trace metals were observed to be very stable in small aggregates (10-50 µm). The study pointed out the role of the mobile trace metals fraction for stormwater sediments management. Isenmann (2016) developed an evaluation tool for stormwater decantation facility. The Euler-Lagrange method was used for flow and particle transport simulation in three basin models. New boundary conditions accounting for Bed Shear Stress (BSS) and BTKE have been proposed to determine the particle mobilization threshold. Vallet et al. (2016) developed a dynamic stormwater model for water quality simulation based on settling velocity distribution. Vezzaro et al. (2010) simulated the removal of micropollutants using a model based on relevant removal processes, such as settling, volatilization, sorption, biodegradation, and abiotic degradation.
Based on this research background, one can observe several studies on hydrodynamic behaviour through (i) experiments at laboratory scale or (ii) numerical modelling at laboratory pilots or field scales. But little is known on experimental measurements of hydrodynamic and sediments characteristics in a large-scale field basin. Indeed, the hydrodynamic behaviour strongly impacts mechanism of the transport and transformations of sediments, and is one of
Cette thèse est accessible à l'adresse : http://theses.insa-lyon.fr/publication/2019LYSEI035/these.pdf © [X. Zhu], [2019], INSA Lyon, tous droits réservés
32
the key reasons of spatio-temporal variability of sediments chemical, physical and microbiological characteristics (e.g. Bernardin- Souibgui et al., 2018; Lipeme Kouyi et al., 2018). The hydrodynamic behaviour and turbulence effects are not considered in numerous existent models for the fate of particulate pollutants in detention and settling basins. Besides, the current sampling strategy permits only sediments sampling from the bottom of basin, without an adapted inlet sediments sampling devices or techniques. In addition, the focus is not often placed on the role of both hydrodynamic and sediment characterizations in the determination of highly contaminated zones in spite of current sediment characterization researches. Hence, it is interesting to measure free surface velocity field in DRB and evaluate the numerical model, which has only be evaluated with observed deposition zone. The knowledge of priority cleansing or treatment zones accounting for sediments resuspension mechanism and contamination distribution could also help for the management of stormwater detention basin.
Table 1 indicates additional investigations regarding (i) use of CFD and PIV (Particle Image Velocimetry) for the understanding of hydrodynamic and sediment transport mechanisms and the design and management of stormwater facilities or structures; (ii) sediment characterization techniques and tracking indicators to assess contamination level; (iii) interactions and correlations between hydrodynamics and sediments’ physical and chemical characteristics, and points out key results and the way that these results may support this PhD work.
33 Table 1. Literature reviews and their relations to this PhD work
Literature works Objectives Studied
facilities/flows
Key results and
perspectives Relations to this PhD work He and Marsalek., 2014 Enhancing sedimentation and trapping sediment with a bottom grid structure
Settling tank Retained percentage of particles increased with the help of CFD
CFD model for
hydraulic condition
assessment and
facility design Park et al., 2008 Evaluation of settling
performance and hydrodynamic behaviour Sedimentation basins Removal efficiency improved with remodelled basins CFD simulation for basin remodelling MoayeriKashani et al., 2017 Experimental investigation of fine sediment deposition using PIV
Sediment basin 2D collecting efficiency of fine particles were evaluated by PIV
PIV for fine sediment deposition
investigation Vonk et al., 2015 Spatial variations in
sediment sources and sedimentation patterns
Mackenzie river Spatial variations in geochemical characteristics Geochemical techniques for sediment characterization Meyer et al., 2018 Real-time monitoring
of water quality
Small and middle scale river Advantage of real-time monitoring, identification of pollutions sources by interpreting the correlation between different parameters Water quality monitoring, correlation between different chemical parameters Bishop et al., 2000 Contamination and biological effects of contamination Stormwater ponds and natural wetland
Stormwater ponds are not clean ecosystems for
wildlife and need
contaminant monitoring
Sediment characterization
Jang et al.,2010 Residuals
characterization for reuse and disposal options
Roadway
stormwater system
Residuals are not a significant threat to environment concerning concentrations of metals and metalloids and trace organics Chemical characterization of sediments Rosenkrantz et al., 2008 Use of Hydra hexactinella for the assessment of the toxicity of stormwater and sediment samples
Retarding basins H. hexactinella tended to avoid the sediment–water interface when exposed to sediment from all retarding basins
Tracking indicator for contamination assessment
Cette thèse est accessible à l'adresse : http://theses.insa-lyon.fr/publication/2019LYSEI035/these.pdf © [X. Zhu], [2019], INSA Lyon, tous droits réservés
34
Literature works Objectives Studied
facilities/flows
Key results and
perspectives
Relations to this PhD work
Wik et al., 2008 Sediment quality assessment (physico-chemical parameters and contaminants) Road runoff detention systems (ponds, manholes and basins)
Low biological quality, extractable organic Zn is used as a tire wear marker, the maintenance is crucial to prevent contamination Tracking extractable organic Zn as metal indicator for contaminant Abarca et al., 2016 Response of particle size distributions to changes in water chemistry Andean mountain stream confluence
Response of particle size distributions to changes in water chemistry Chemical and hydrodynamic interactions Molinaroli et al., 2009 Relationship between hydrodynamic
parameters and grain size Contrasting transitional environment, shallow water Significant correlations were revealed, use of hydrodynamic energies for the understanding of
sediment transport mechanism Relationship between hydrodynamic and sedimentological parameters Schwab et al., 2008 Hydrodynamic approach to modelling phosphorus distribution
Lake Erie Spatial and temporal
distribution of phosphorus was obtained. Relationship between hydrodynamic and biochemical contamination distribution Bartholoma and Flemming., 2007 Progressive grain-size sorting along an intertidal energy gradient German Wadden Sea Progressive grain-size sorting along an intertidal energy gradient
Relationship between hydrodynamic energy gradient and sediment size Andral et al., 1999 Particle size distribution and hydrodynamic characteristics Runoff from motoways Sedimentation velocities on different particle size fractions were revealed
Relationship
between particle size distribution and sedimentation velocity Coppola et al., 2007 Quantitative investigations on the relationship on the particle size and
organic carbon
sorption
Washington
Margin and
Cascadia basin
Ultrafine particle fraction hosted the majority of organic carbon
Relation between sediments’ physical
and chemical
35
Objectives and research strategy
The design and management of such facility are of great interest, which lead to the main objectives of this PhD work, including:
Analysis and understanding of hydrodynamic behaviour through Large-Scale Particle Image Velocimetry (LSPIV) technique, and evaluation of numerical models;
Investigation of resuspension and remobilization of already settled sediments and determination of zones where sediments can be easily washed away by incoming stormwater and escape DRB;
Prediction of the distribution of trace metal contamination by coupling the correlation of metal contents and settling velocity with sediment transport model.
The field site used for this PhD work is DRB, which has been under monitoring and investigating for at least 20 years, and is designed with multi-elements reminded below to promote sediments settling:
Multi-inlets
Large surface area compared to depth to trap sediments (long residence time) A gutter which drives water during dry weather
A small tank at the centre of basin to trap hydrocarbon An overflow and three orifices towards outlet
In addition to current knowledge, this PhD work aims to bring new insights to the research community. The overall research strategy is illustrated in Figure 2.
Figure 2. Overall research strategy
Cette thèse est accessible à l'adresse : http://theses.insa-lyon.fr/publication/2019LYSEI035/these.pdf © [X. Zhu], [2019], INSA Lyon, tous droits réservés
36
First of all, a new device is necessary and important to collect sediments from the inlet. A Hydrocyclone Trapping System (HTS) is considered thanks to its function to separate solids from liquid by centrifugal force. The HTS is connected to the Leaping-Weir System (LWS) and they serve together as a sediment sampling system.
Hydrodynamic behaviour strongly impacts mechanisms of the transport and transformations of sediments. LSPIV is an image-based, efficient, low-cost and convenient technique for experimental free surface velocity field measurement, which has been widely used in riverine environments. The application of LSPIV in DRB helps to understand the hydrodynamic behaviour and evaluate the numerical model, which is a base for sediment transport simulation. The resuspension and remobilization of settled sediments could contaminate the downstream by carrying the associated pollutants. The investigations on sediment resuspension and remobilization mechanisms help to determine the priority cleansing zones where pollutants could be easily washed away and escape the basin.
A major part of pollutants are transported in a predominantly particulate phase in urban stormwater, while certain metals are relatively stable in the nature and could be used as indicators of contamination. The study of correlation between metal contents in sediments and settling velocity helps to connect sediments’ physical and chemical characteristics. The combination of such correlation with particle transport model enables to simulate chemical transport through physical aspects and predict contamination zone where specific treatment could be comprehensively applied.
The final results help to better design and manage stormwater detention basins by taking into considerations multiple aspects, i.e. hydrodynamic behaviour, sediment sedimentation and resuspension, and distribution of trace metal contamination.
Document structure
In addition to the introduction, conclusions and perspectives, this document is organized in four chapters:
Chapter 1 introduces the experimental site and sampling strategy. The chapter proposes then a new designed sampling device for inlet sediments characterizations. The design procedure and trapping efficiency of this new sampling equipment are also revealed in this chapter.
Chapter 2 presents the hydrodynamic behaviour in DRB thanks to the Large-Scale Particle Image Velocimetry (LSPIV) technique. The results are used as a support for numerical model evaluation and particle deposits prediction.
37
Chapter 3 describes the sediment resuspension behaviour in DRB using CFD models, which is based on the hydrodynamic model evaluated in Chapter 2.
Chapter 4 shows the research methodology and results on particulate pollutant transport and the distribution of trace metal contamination in DRB. The contamination distribution is obtained by analysing the correlation between metal contents and settling velocity and coupling such correlation with solid transport models.
General conclusions and the perspectives are given at the end of the document.
Cette thèse est accessible à l'adresse : http://theses.insa-lyon.fr/publication/2019LYSEI035/these.pdf © [X. Zhu], [2019], INSA Lyon, tous droits réservés
39
Chapter 1. Presentation of experimental site and sampling strategy
This chapter aims to present the experimental site, i.e. Django Reinhart stormwater detention Basin (DRB) and sediment sampling strategy. In addition to the traps for sediment sampling at the bottom of the basin proposed by Torres (2008), a new sampling device is designed in this PhD work for the interception of sediments from the inlet of DRB. Section 1.1 introduces DRB and its characteristics. A detailed presentation of sediment sampling strategy is then given in Section 1.2. Finally, Section 1.3 shows a method for the design of inlet sampling device and its trapping performance.
1.1. Experimental site
The thesis is carried out under the framework of the field observatory for urban water management (http://www.graie.org/othu/) or OTHU in French (standing for observatoire de terrain en hydrologie urbaine). OTHU is an observation-based partnership launched in Lyon (France) in 1999 and supported by the Greater Lyon Metropolis (La Métropole de Lyon, direction Eau et déchets) and the Rhone Mediterranean Corsica Water Agency (Agence de l’eau Rhône Mediterranée et Corse). OTHU aims to improve knowledge and develop new technology in the field of Urban Water Management. It promotes the cooperation among researchers from different scientific fields, as well as the collaboration between researchers and end-users. The observatory provides reliable data (climate parameters, water quantity and quality) obtained from (i) continuous field measurements and (ii) campaigns of field sampling and laboratory analysis, on five main experimental sites and more than 20 other sites and laboratory prototypes with flow monitoring activity (Figure 1.1a).
Cette thèse est accessible à l'adresse : http://theses.insa-lyon.fr/publication/2019LYSEI035/these.pdf © [X. Zhu], [2019], INSA Lyon, tous droits réservés
40
Figure 1.1. (a) Location of OTHU experimental sites in Lyon sewer system (adapted from OTHU website - http://www.graie.org/othu/): CSS = combined sewer system, CSOs = combined sewer overflow structures, WSUD = water sensitive urban design. (b) Django Reinhardt Basin (DRB) composed of a detention basin and infiltration basin. (c) Presentation of Chassieu catchment (Lipeme Kouyi et al., 2014b): blue lines surround the industrial watershed from which DRB receives water, orange lines represent the stormwater network. (d) Sketch of DRB.
41
The experimental and modelling investigations of this thesis are carried out in one of these sites, which is a stormwater detention basin, called Django Reinhart basin (DRB). The basin characteristics are presented in Table 1.1.
Table 1.1. Characteristics of Django Reinhardt Basin (DRB) Type of characteristics Characteristics
Location Chassieu, France (in the east part of the metropolis of Lyon
– Figure 1.1a)
Type of storm drainage system Separated stormwater drainage system
Function Dry basin designed to hold storm water to reduce local and
downstream flooding and to allow sediment settling Watershed type Industrial watershed of 185 ha, illustrated in Figure 1.1c
Impervious rate 75%
Bottom surface area 11 000 m²
Storage capacity 32 000 m3
Max outlet flow rate limit 0.35 m3/s (Bardin and Barraud, 2004)
Materials Bottom in bitumen and banks covered with plastic lining
Compositions 2 inlets (mainly inlet 1 operates), an outlet, a gutter guiding the flow to 3 orifices during dry periods and an overflow when the water height exceeds the retention wall (presented in Figure 1.1d).
Construction and maintenance Built in 1975, rehabilitated in 2002, cleaned in 2006 & total sediment removal in 2013.
Monitoring Continuous inflow and outflow rates, water levels in the basin, and inlet and outlet water quality measurements (pH, temperature, conductivity, turbidity). Inlet water quality is measured in a measurement station shown in Figure 1.2.
Cette thèse est accessible à l'adresse : http://theses.insa-lyon.fr/publication/2019LYSEI035/these.pdf © [X. Zhu], [2019], INSA Lyon, tous droits réservés
42
Figure 1.2. (a) Scheme of measurement station for inlet water quality measurement, (b) photo of measurement flume. (Source: Nicolas Walcker)
1.2. Strategy of sediment sampling
Five sampling points at the bottom of DRB (P01, P02, P04, P07, P12bis, illustrated in Figure 1.3a) are selected according to sediment accumulation zones and previous studies in order to better represent sediment characteristics in the basin (Sébastian et al., 2014b; Torres et al., 2007; Yan et al. 2014). Honeycomb-like sampling traps are installed before each rain event and collect settled sediments at each location during the rain event. As illustrated in Figure 1.4, P01 and P02 represent locations with medium particles (median size D50 of 40 - 200 µm) given their location near the inlet of basin and at the middle of flow pathway, respectively. P04 and P07 situate at the end of flow pathway and accumulate relatively fine sediments (median size D50 of 25 - 70 µm). P12bis is a special sampling point near a small tank designed to trap hydrocarbon and relatively medium and coarse sediments (median size D50 of 200 µm) are found at this point. For each point, 3 honeycomb-like traps (shown in Figure 1.3b) were placed in order to trap as many sediments as possible.
43
Figure 1.4. (a) Streamline of the fluid flow obtained by computational fluid dynamic (Q = 0.35 m3/s, main flow rate from inlet 1) and sediment characteristics, where locations of sediments
of different sizes are represented in different colours: red circles for coarse particles, yellow for median, and green for fine. (b) Streamline of fluid flow and location of different sampling points (P01, P02, P04, P07, P12bis). (c) Sediment depth distribution measurement in Django Reinhardt basin. (adapted from Yan, 2013).
The knowledge of the physical and chemical characteristics of incoming and existent sediments is important for the understanding of sediment transport mechanisms in DRB. It is not sure that properties of sediments collected in honeycomb-like sampling traps correspond to the incoming ones or the mixture with the existent settled particles. An appropriate sampling device is then required to collect sufficient and representative sediments from the inlet. The physical and chemical characteristics of incoming sediments can be used as input data of solid transport models. During this thesis, a new sampling device based on a Leaping-Weir connected to Hydrocyclone Trapping System (LW-HTS) was designed and installed to collect incoming sediments from the inlet of DRB, which will be presented in the next section.
1.3. Design and installation of LW-HTS for sediments sampling at the inlet of DRB
1.3.1. Preliminary sediment sampling from measurement flumeIn order to analyse the sediment characteristics from the inlet, preliminary sampling experiments were realised thanks to the measurement flume (Figure 1.2), where sediment and rainwater samples were collected from the main inlet pipe (inlet 1 in Figure 1.1d) during the rain event of 16 January 2017. Sediments from P01 and P07 were also collected during the
Cette thèse est accessible à l'adresse : http://theses.insa-lyon.fr/publication/2019LYSEI035/these.pdf © [X. Zhu], [2019], INSA Lyon, tous droits réservés
44
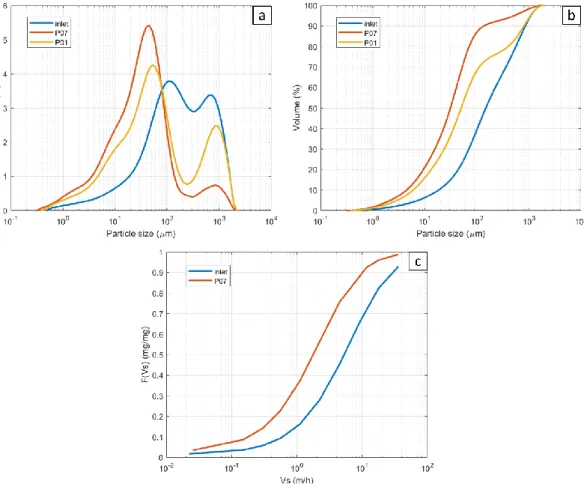
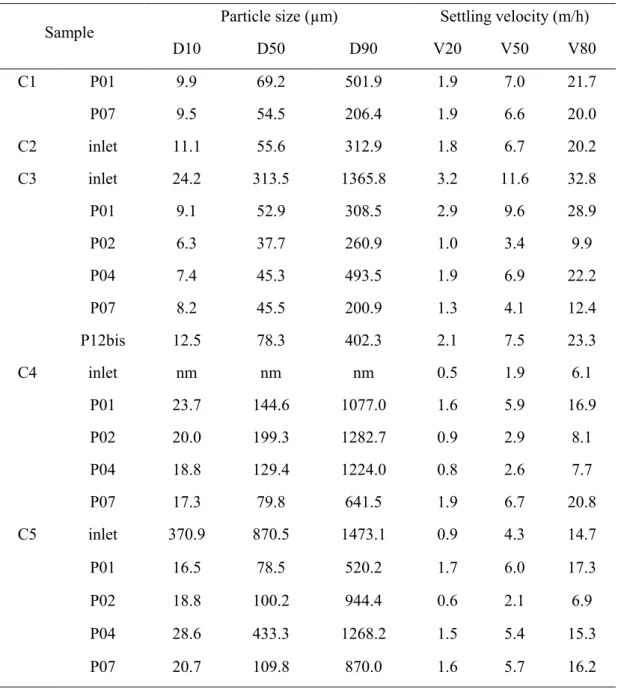
same campaign. The particle-size distribution and settling velocity distribution of sediments were analysed and compared (illustrated in Figure 1.5 and Table 1.2). The measurements were performed using Mastersizer 2000 laser diffraction granulometer and VICAS protocol (Chebbo et al, 2009) for particle-size distribution and settling velocity, respectively (details on these methods are also presented in Chapter 4). Results show that particle-size distribution of samples from P01 and P07 peaks at around 55 μm and 950 μm and that of samples from inlet peaks at around 105 μm and 800 μm. In general, both particle size and settling velocity of sediments from inlet are higher than those in the basin. Indeed, the sediments collected from measurement flume originate from the inlet 1 pipe, close to the bottom (by means of a peristaltic pump suction, see Figure 1.2a) and aggregate in the experimental flume. We assume that the peristaltic pump suction brings a mixture of all type of sediments (fine and coarse particles) in the measurement flume, no grain size fractionation is done to collect only particle which may settle in the basin, even if median particles size D50 (Table 1.2) have same order of magnitude as those observed in DRB by Lipeme Kouyi et al. (2018). Hence, a trapping system to collect more representative sediments from the inlet of DRB is required.
Figure 1.5. Comparison of physical characteristics of sediments collected from inlet flume and traps at P01, P07: (a) particle-size distribution, (b) cumulative particle-size distribution, (c) settling velocity distribution (except P01).
45
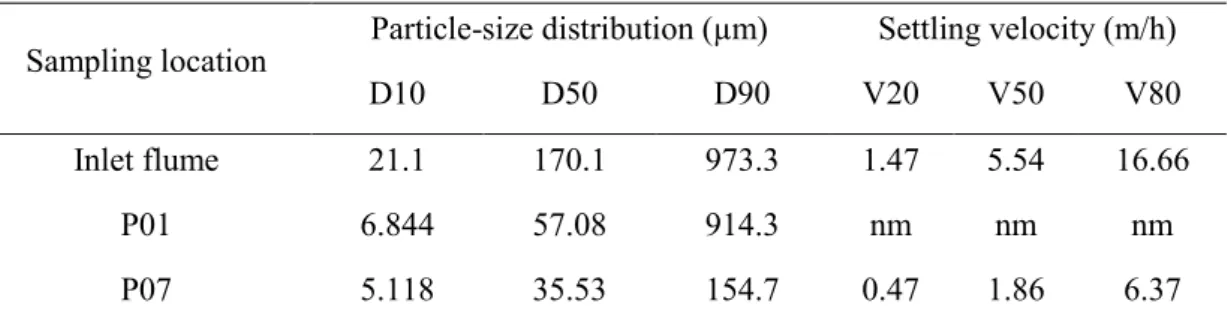
Table 1.2. Comparison of physical characteristics of sediments collected from inlet flume and traps at P01 and P07
Sampling location Particle-size distribution (µm) Settling velocity (m/h)
D10 D50 D90 V20 V50 V80
Inlet flume 21.1 170.1 973.3 1.47 5.54 16.66
P01 6.844 57.08 914.3 nm nm nm
P07 5.118 35.53 154.7 0.47 1.86 6.37
nm: not measured
D10: sieving size with 10% of particle mass passing through. V10: 10% of particle volume has a settling velocity inferior to V10.
1.3.2. Design of Hydrocyclone Trapping System (HTS)
A Leaping-Weir System (LWS) was designed and constructed at the inlet of DRB, aiming to (i) measure low flow rates during the beginning and ending of storm events and (ii) intercept some fraction of the incoming sediments (Claro Barreto et al., 2015). In order to achieve the second purpose, two trapping systems, a hydrocyclone (HTS) and a lamella settler, were tested numerically and the HTS was chosen thanks to its higher trapping performances (Zhu et al., 2016). The HTS is composed of a hydrocyclone part, a trapping box and pipes, as shown in Figure 1.6c. The hydrocyclone part, which contains an inlet nozzle, a vortex finder, a cylinder and a cone section, is designed to separate solid particles from liquid media by means of a centrifugal force generated in the system. The cylinder and cone section are the main centrifugal separation parts. The vortex finder helps to drive a “clean” flow to the upward direction and prevent the sediments’ escape. The solid particles settle to the bottom of the cone section, and then slide to the trapping box through the pipes. The system was designed according to the different in-situ limits (e.g. maximum site dimensions and maximum weight of the HTS) and the design principles of literature (e.g. Silva et al., 2014). Generally, the design of hydrocyclone is based on the optimized ratios between the different dimensions and the cylinder diameter (Silva et al., 2014, Kim et al., 2015). Finally, HTS with optimized dimensions (shown in Table 1.3) were installed at the downstream of LWS. A combination of LWS and HTS was then used as a new sampling device to collect sediments from the inlet of DRB (illustrated in Figure 1.6b). Continuous measurements of velocity and water level are realized at the entrance of LWS. An electromagnetic flowmeter is also installed between LWS and HTS (Walcker et al., 2018).
Cette thèse est accessible à l'adresse : http://theses.insa-lyon.fr/publication/2019LYSEI035/these.pdf © [X. Zhu], [2019], INSA Lyon, tous droits réservés
46
Figure 1.6. (a) Aerial view of basin (DRB), (b) Leaping-Weir and Hydrocyclone Trapping System (location shown in (a)), (c) Compositions of hydrocyclone.
Table 1.3. Dimensions of hydrocyclone
Parameter Dc (mm) Di (mm) Do (mm) l (mm) Lv (mm) Lc (mm) Le (mm) Du (mm) A (°) Value 200 50 80 200 300 320 635 100 9
Note: The symbols correspond to the symbols in Figure 1.6c. 1.3.3. CFD modelling of LW-HTS
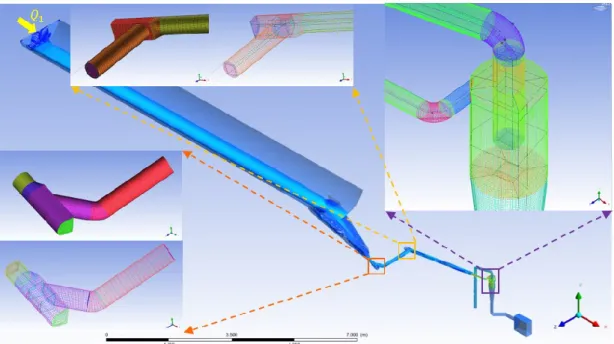
Multiphase flows in the combination of LWS and HTS have been simulated using computational fluid dynamic approach (CFD) to understand its hydrodynamic behaviour and evaluate its trapping efficiency. A mesh with 3.25 million hexahedral cells is established for the whole LW-HTS. Figure 1.7 shows the geometry of LW-HTS and some mesh details of HTS and the connection between LWS and HTS. Multiple O-Grid blockings are applied in the cases of cylinder geometry. The detailed mesh information of LWS can be found in Claro Barreto (2014). The flow was simulated in steady state condition and the turbulence was simulated with the Re-Normalization Group (RNG) k-epsilon model (Orszag, 1993). The volume of fluid (VOF) method (firstly proposed by Hirt and Nichols, 1981) was used for free surface modelling.
47
Figure 1.7. Geometry of LW-HTS and some mesh details 1.3.4. Hydrodynamic behaviour
Simulations with several inflow rates (𝑄1 = 3, 6.5, 13, 13.65, 30, 60, 100, 250, 350 l/s) were
performed for LW-HTS and the streamline is illustrated in Figure 1.8. The simulated hydrodynamic characteristics are presented in Figure 1.8. The averaged inlet velocity (𝑣̅̅̅̅̅) and 1𝑀 water height (ℎ1) are calculated at the cross section (indicated in yellow in Figure 1.8) 1 m upstream to the bottom opening of LWS. The flow rate between LWS and HTS 𝑄2 is also computed to be compared to measured data (marked in green in Figure 1.8).
Figure 1.8. Streamline of LW-HTS colored by velocity magnitude
𝑄1 𝑄2 Outlet-HTS-top Outlet-LWS T-connector Trapping box 𝑄1, 𝑣1, ℎ1
Cette thèse est accessible à l'adresse : http://theses.insa-lyon.fr/publication/2019LYSEI035/these.pdf © [X. Zhu], [2019], INSA Lyon, tous droits réservés