HAL Id: hal-01007241
https://hal.archives-ouvertes.fr/hal-01007241
Submitted on 17 Jun 2014HAL is a multi-disciplinary open access archive for the deposit and dissemination of sci-entific research documents, whether they are pub-lished or not. The documents may come from teaching and research institutions in France or abroad, or from public or private research centers.
L’archive ouverte pluridisciplinaire HAL, est destinée au dépôt et à la diffusion de documents scientifiques de niveau recherche, publiés ou non, émanant des établissements d’enseignement et de recherche français ou étrangers, des laboratoires publics ou privés.
A Surface Enhanced Raman Spectroscopy study of
aminothiophenol and aminothiophenol-C60
self-assembled monolayers: evolution of Raman modes
with experimental parameters
Gregory Delafosse, Alexandre Merlen, Sylvain Clair, Lionel Patrone
To cite this version:
Gregory Delafosse, Alexandre Merlen, Sylvain Clair, Lionel Patrone. A Surface Enhanced Raman Spectroscopy study of aminothiophenol and aminothiophenol-C60 self-assembled monolayers: evolu-tion of Raman modes with experimental parameters. Journal of Chemical Physics, American Institute of Physics, 2012, 136, pp.194704. �10.1063/1.4717720�. �hal-01007241�
1
J. Chem. Phys. 136, 194704 (2012); doi: 10.1063/1.4717720
A Surface Enhanced Raman Spectroscopy study of aminothiophenol and
aminothiophenol-C
60self-assembled monolayers: evolution of Raman modes with
experimental parameters
G. Delafosse
a,c,d, A. Merlen
a,b*, S. Clair
a,c, L. Patrone
a,c,da
CNRS, IM2NP (UMR 7334)
b
Université du Sud Toulon-Var, IM2NP, Bâtiment R, BP 132, F-83957 La Garde Cedex, France
c
Aix-Marseille Université, IM2NP
, Campus de Saint-Jérôme – Case 142, F-13397 Marseille Cedex
20, France
d
Institut Supérieur de l’Electronique et du Numérique, IM2NP, Maison des Technologies, Place
Georges Pompidou, F-83000 Toulon, France
ABSTRACT: P-aminothiophenol (PATP) is a well known molecule for the preparation of self-assembled monolayers on gold via its thiol functional group. After adsorption, it has been demonstrated that this molecule is anchored to gold through its thiol group, and standing nearly upright at the surface with the amino functional group on top. This molecule has been extensively studied by Surface Enhanced Raman Spectroscopy but its exact SERS spectrum remains unclear. Here we demonstrate that it can be strongly affected by at least two experimental parameters: laser power and layer density. Those features are discussed in terms of a dimerization of the PATP molecules. The free amino group affords the adsorption of other molecules, like C60. In this case, a complex multilayer system is formed and the question of its precise
characterisation remains a key point. In this article, we demonstrate that surface enhanced Raman spectroscopy combined with X-Ray photoelectron spectroscopy can bring very important information about the organisation of such a self-assembled multilayer on gold. In our study, the strong evolution of Raman modes after C60 adsorption suggests a change in the organisation of aminothiophenol molecules during C60
adsorption. These changes, also observed when the aminothiophenol layer is annealed in toluene, do not prevent the adsorption of C60 molecules.
Keywords: Self-assembled monolayers, surface enhanced Raman spectroscopy, aminothiophenol, fullerene C60.
3
INTRODUCTION
The huge development of nanoelectronics leads to the elaboration of more and more complex architectures and to the subsequent difficult question of their physical and chemical characterisations. Among those architectures, self-assembled monolayers (SAM) on metallic nanostructures is an extremely promising approach, with potential applications in photovoltaics1, molecular electronics2, optics, and so on. Thiol functionalized molecules are known to form well-ordered, densely packed self-assembled monolayers on metals like gold or silver. The P-AminoThioPhenol (PATP) molecule appears as extremely promising due to its combination of electron-donating and electron-accepting groups, which is commonly designed as a “push-pull” molecule. In addition it is possible to elaborate “sandwich” PATP SAMs between gold substrate and another molecule using its respective two functional groups, i.e., thiol and amino groups. For instance, as for silver3 or gold4 colloids, fullerene molecules5 can be in principle grafted on top of the terminal amine moieties of PATP self-assembled on gold as a stacked SAM. Indeed, fullerene C60 anchoring on amine
groups has been observed and shown in a previous work6. This is particularly challenging for molecular electronics since electronic properties of such π-conjugated molecules enable their application in various molecular devices7. Among potential applications, such a bottom-up approach with a two step grafting is very attractive to build C60-based capacitive memory cells with improved control of the density of active
storage sites compared to the more developed top-down approach8. However,the experimental study of such complex nanostructures is extremely difficult. Indeed, during the formation of PATP SAMs some molecules may be linked to gold via amine groups although less favourable than linking via the thiol function9, and further grafting process of fullerenes may modify the organization of the pre-formed PATP SAM. Among all characterisation tools, Surface Enhanced Raman Spectroscopy (SERS) is extremely interesting as it can bring different information: metal-molecules interaction, charge transfer mechanism, electronic properties, molecule orientation, and so forth. This spectroscopy is based on the giant electromagnetism enhancement observed in the near field of metallic nanoparticle such as gold or silver10 through a plasmonic mechanism. It is generally admitted that an additional feature, usually called the chemical enhancement, also contributes to the overall SERS signal. This last contribution is subject of many debates in the SERS community and its exact role remains unclear. In the case of P-aminothiophenol (PATP) SAM on gold or silver nanostructures, SERS has been extensively used11-14. Due to the strong affinity of the thiol group of this molecule for metals, SERS measurements can be extremely easily performed. All previous studies have shown that a charge transfer (CT) between this molecule and the metal occurs: in the SERS spectrum this CT gives rise to strong evolution in the Raman modes, but the exact origin of this mechanism remains unclear15. It must also be said that this molecule has been studied in complex metal-PATP-metal sandwich nanostructures12 using SERS too. In the case of C60 molecules, SERS studies are much less numerous
16
: this molecule has no functional group with a strong affinity for metals and it is thus almost impossible to prepare a clean bundle-free thin film of C60 like a SAM directly on the metal. A possible technique is to use an intermediate molecule to
connect C60 to the metal 17
have been performed using 1064 nm excitation, which is quite far from the plasmon absorption of gold or silver nanostructures. This might explain why the connecting molecule is usually not clearly observed in such analyses. Thus, both PATP and C60 molecules have already been studied by SERS. Nevertheless, to our
knowledge, few SERS studies have been performed using more complex SAM of stacked molecules. In this study we focused on the SERS characterisation of PATP and stacked PATP-C60 SAM prepared on gold. We
clearly observed that the SERS spectrum of PATP strongly depends on two experimental parameters: the density of the layer and laser power. We observed a progressive but irreversible evolution of the modes under high power laser illumination. A possible chemical change of the PATP molecule is discussed. For PATP-C60 SAM the SERS signal of both PATP and C60 was measured. A clear evolution of the SERS
spectrum of PATP is observed, suggesting a change in the organisation of the PATP layer during C60
grafting. The evolution of the Raman modes is compared with X-ray photoelectron spectroscopy (XPS) of the carbon and nitrogen core levels.
I.
EXPERIMENTAL SECTION
Gold wire (99,99%) was obtained from Neyco. P-aminothiophenol (PATP, 97%), and fullerene C60
(sublimated, 99.9%) were purchased from Sigma-Aldrich. Anhydrous toluene (synthesis grade) and absolute ethanol (99.99%) were obtained from Fisher Chemicals. Both molecules and solvents were used without further purification.
The nanostructured surfaces are prepared by thermally evaporating 15 nm of gold onto typical glass microscope slides in a vacuum chamber. Deposition is made at a rate of ~1 Å.s-1 under a vacuum pressure less than 5.10-6 mbar. Those nanostructured susbtrates are made of gold island films18 and have a low electrical conductivity. As a consequence for XPS measurements we used different gold substrates prepared with ~200 nm of gold Joule evaporated (~1 Å.s-1) on a thin chromium layer deposited on a silicon substrate. Gold substrates are then soaked for 12 hours in 1mM alcoholic solution of PATP. Substrates are then rinsed with pure ethanol to remove physisorbed molecules. C60 are grafted on the top of PATP monolayer under
reflux conditions in toluene, at a temperature of 110°C and under nitrogen flow. Afterward, PATP+C60 SAM
are sonicated in pure toluene to remove physisorbed molecules. PATP molecules should have an almost standing up9 orientation with the thiol functional group linked to the gold surface, and C60 are adsorbed via
the amino group, forming a two layer self-assembled structure. Few SERS studies have been performed on such nanostructures. It must be noticed that for a part of our samples we have observed locally an aggregation of C60 molecules (confirmed by Raman measurements) whose origin remains unclear. As a
consequence we performed measurements out of those aggregation areas.
The XPS spectra were recorded in normal emission geometry with a 125 mm radius hemispherical analyzer (with a pass energy of 20 eV) and a Al Kα X-ray source (hν=1486.6eV) in ultrahigh vacuum (UHV). The
5
XPS spectra are referenced to the spectroscopic Fermi level, and no corrections have been made for any surface charging. The area intensities were obtained following the spectral fitting and integration with Voigt-like functions.
SERS measurements were performed using an Horiba Jobin Yvon HR800 spectrometer using 632.8 nm excitation. The laser was focused on the sample via a 50 × objective. Typical laser power on the sample was 1.5 mW (D1 filter) or 150 µW (D2 filter). Those powers insure a rather high signal to noise ratio with a reasonable acquisition time.
II.
RESULTS AND DISCUSSION
The SERS signal of PATP deposited on metallic nanostructures has already been extensively studied. It has now been clearly established that this spectrum is different from the bulk one, in opposition with what is commonly observed for dye molecules (methylene blue, rhodamine etc..). This feature has been interpreted as a sign of a charge transfer mechanism via an Herzberg Teller vibronic coupling13,19,20. However the full interpretation of the observed modes has led to many discussions in the literature and the exact origin of the enhancement is still under debate. In table one is reported the vibrational assignment of the observed Raman of PATP according to different studies. It can be clearly seen that this attribution remains unclear. In
addition, a recent theoretical study has concluded that the abnormal
Table 1: list of most intense SERS and Raman modes of PATP SAM. a is Ref [13], b Ref [19] and c Ref [20].
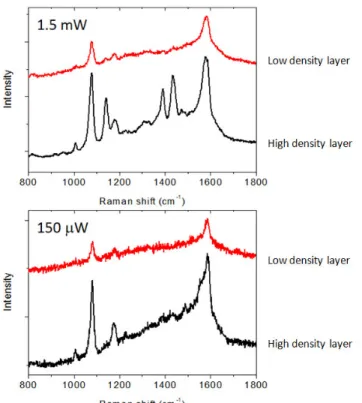
enhanced peaks observed in SERS did not originate from PATP molecule itself15. As a consequence the complete SERS analysis of PATP SAMs is still necessary. In figure 1 are shown SERS spectra for two different densities of PATP molecules deposited on nanostructured gold. The high density layer is obtained after 12h dipping in a 1mM PATP solution whereas the low density layer is obtained after a one minute dipping in a 10-5 mol/L solution. For both layers, two spectra were measured: the first one with a 1.5 mW excitation, the second one with a 150 µW. According to classical Raman theory, the spectrum should not depend on the density of the PATP layer, except for its global intensity. Surprisingly it is not what is observed in figure 1. Some Raman modes (1140, 1185, 1390 and 1435 cm-1, mainly b2 modes according to
table 1) are clearly not observed or have a much lower intensity when the layer density is low. In addition, the intensity of some modes also depends on laser power, in particular for the high density layer.
It can immediately be remarked that Raman modes with pure b2 symmetry are most affected by the density
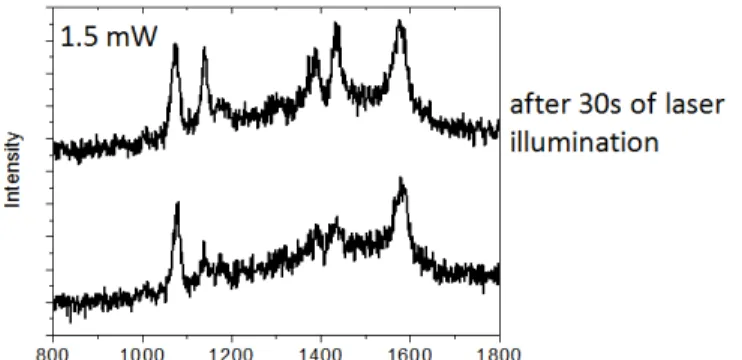
of the layer. According to spectra shown in figure 1 these modes are also most affected by laser power. As a first conclusion it appears clearly that the observed modes and their relative intensity in the SERS spectrum of PATP strongly depend on the experimental conditions. According to our measurements at least two factors can modify this spectrum: laser power and layer density. To gain better understanding on the influence of laser power we acquired short time spectra (1s) of the high density layer under a 1.5 mW laser illumination. Two spectra are shown in figure 2: one immediately after turning on the laser, and the other
Figure 1: SERS spectra of low density layer (red) and high density layer (black) of PATP for two laser excitations: top 1.5 mW, bottom 150 µW. Wavelength: 632.8 nm
7
after 30s of illumination. It appears clearly that an evolution of the SERS spectrum occurs during laser illumination. At the beginning the spectrum is similar to what is observed with low density layer or low power illumination. But after 30s the spectrum is different, and the intensity of b2 modes (1140, 1185, 1390
and 1435 cm-1) has considerably increased, giving rise to a spectrum similar to that in figure 1. As a consequence, it seems that SERS spectrum of PATP strongly depends on experimental conditions. It appears clearly that with low power laser illumination, b2 modes are not enhanced, in accordance with recently
published theoretical predictions15. The question is why the PATP SERS spectrum is progressively modified when laser power is increased. This evolution of PATP modes with laser illumination has already been reported by Kim et al.14 and interpreted as a consequence of threshold energy in the charge transfer enhancement. This feature should occur whatever the density of the PATP layer: as can be seen in figure 1, the low density layer has low b2 modes even if laser power is high. As this threshold energy should
reasonably not depend on the layer density this hypothesis cannot be considered for the observed evolution of Raman modes. Another possible explanation is a progressive degradation or modification of the PATP molecule induced by laser heating. Degradation is usually observed in Raman measurements when laser power density is too high. In this case, new Raman modes are present and the characteristic modes of the molecules disappear. As can be seen in figure 2 this is not what we observed: after a few seconds of laser illumination, the original modes of PATP are still present and their intensity has not decreased. This suggests that PATP is not totally damaged but it does not exclude a partial modification of the molecule as we clearly observed an evolution of the relative intensity between the different Raman modes of PATP. In previous studies the evolution of the b2 modes was interpreted as a sign of the charge transfer, once again this
mechanism should reasonably not depend on laser power and layer density. We can also assume that a change of the molecule orientation is induced by laser heating. This orientation change should modify the selection rules, lying to the observation of new modes. SERS has already been used to determine the orientation of C2ν molecules adsorbed on metals: phthalazine
21
, benzoic acid22, thiophenol23….In the case of PATP, it has been demonstrated that this molecule is oriented with the C2 axis almost normal to the surface.
With this standing up orientation, electromagnetic enhancement theory cannot explain all the observed modes in the SERS spectrum of this molecule and chemical enhancement is introduced19. To explain the observed evolution of SERS modes of PATP we should suppose that under strong laser illumination this orientation changes, giving rise to new modes with different selection rules. This hypothesis appears as highly improbable. As a first conclusion, the most reasonable hypothesis for the evolution of the PATP modes with laser power and layer density is a chemical modification of the PATP molecules, excluding a total degradation of the molecule, as only modes reported in table 1 are observed. The dimerization of PATP molecules has already been reported on gold electrodes via an electrochemical mechanism24. In addition, some recent studies25 have suggested the production of dimercaptoazobenzene (DMAB) from PATP by catalytic coupling reaction on silver nanoparticles. This hypothesis has been advanced by Huang et al. to explain the evolution of PATP SERS modes26, the supposed b2 modes being in fact modes of DMAB. As can
evolution of SERS modes during high power laser illumination is induced by the transformation of PATP into a different molecule, certainly DMAB. This dimerization is not observed with low density layers as this reaction cannot occur if PATP molecules are too far one from the others.
As explained in the introduction, PATP SAM can be interestingly used to graft fullerene molecules and obtain stacked SAM. The latter should then allow to obtain no more than one monolayer of C60, with a
surface density that could be varied depending on the targeted applications (e.g. isolated C60 bundles for
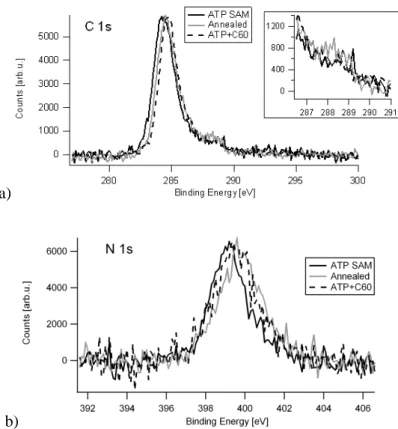
memory cells). In figure 3 are shown the C1s and N1s core level XPS spectra for a PATP layer before and after C60 grafting. The effective grafting of the PATP layer on the gold surface is demonstrated by the
well-resolved N1s peak corresponding to the amino group (binding energy of 399.2 eV, full width at half-maximum (FWHM) of 2.1eV). Remarkably, no binding energy peak usually attributed to N atoms involved in hydrogen bonds27,28 is observed, thus suggesting a low order in the organic layer or a good cleanliness of the film. The C1s spectrum is mainly composed of an intense peak at 284.3eV binding energy corresponding to C-C bonds and a minor peak around 286.3eV corresponding to carbon bonded to sulphur or nitrogen atoms.
Figure 2: SERS spectra of a high density layer of PATP under a 1.5 mW laser illumination. The bottom spectrum is obtained immediately after the laser is turned on, the above spectrum is obtained 30s later. Wavelength: 632.8 nm Acquisition time: 1s
a)
b)
After C60 deposition XPS spectra are slightly modified. While the C1s spectrum remains nearly identical to
that of PATP SAM, the nitrogen N1s peak is now centred at 399.5eV and slightly broader (FWHM Such feature can be induced by the reaction of
the organisation of the PATP layer. No peak related to the formation of N bonded to C above 400 eV27) is observed, indicating a
quantitative analysis of the N/Au ratios indicates that the num
typical SERS spectrum after C60 adsorption is shown in figure 4 (black spectrum). Those spectra were
obtained using 1.5 mW excitation (for lower laser power, the intensity is too low for a quantitative analysis). Comparing to spectra shown in figure 1, a global decrease of signal intensity is observed
of PATP does not change after C60
molecules. We cannot exclude that a pa
the electromagnetic enhancement and the SERS signal. In final only 3 Raman modes of observed: 1075, 1435 (weak intensity) and 1575 cm
cm-1 is superposed to those Raman modes, probably associated to impurities. Moreover a new Raman mode, with a rather weak intensity, is observed at 1460 cm
Figure 3: XPS spectra of the (a) C 1s and (b) N 1s core levels for different sample preparations (see text for details).
9
spectra are slightly modified. While the C1s spectrum remains nearly identical to SAM, the nitrogen N1s peak is now centred at 399.5eV and slightly broader (FWHM
reaction of C60 molecules with the amino functional group or a change in
layer. No peak related to the formation of N bonded to C
) is observed, indicating a relatively low efficiency of the C60 grafting. In addition the
quantitative analysis of the N/Au ratios indicates that the number of PATP molecules remained constant. A adsorption is shown in figure 4 (black spectrum). Those spectra were obtained using 1.5 mW excitation (for lower laser power, the intensity is too low for a quantitative analysis). Comparing to spectra shown in figure 1, a global decrease of signal intensity is observed
adsorption, this decrease cannot be induced by a lower amount of molecules. We cannot exclude that a part of gold nanoparticles are desorbed during C
the electromagnetic enhancement and the SERS signal. In final only 3 Raman modes of observed: 1075, 1435 (weak intensity) and 1575 cm-1. In addition a very broad band bet
is superposed to those Raman modes, probably associated to impurities. Moreover a new Raman mode, with a rather weak intensity, is observed at 1460 cm-1. This mode is characteristic of C
: XPS spectra of the (a) C 1s and (b) N 1s core levels for different sample preparations
spectra are slightly modified. While the C1s spectrum remains nearly identical to SAM, the nitrogen N1s peak is now centred at 399.5eV and slightly broader (FWHM 2.5eV). molecules with the amino functional group or a change in layer. No peak related to the formation of N bonded to C60 (binding energy
grafting. In addition the molecules remained constant. A adsorption is shown in figure 4 (black spectrum). Those spectra were obtained using 1.5 mW excitation (for lower laser power, the intensity is too low for a quantitative analysis). Comparing to spectra shown in figure 1, a global decrease of signal intensity is observed29. Since the amount adsorption, this decrease cannot be induced by a lower amount of PATP rt of gold nanoparticles are desorbed during C60 grafting decreasing
the electromagnetic enhancement and the SERS signal. In final only 3 Raman modes of PATP are clearly . In addition a very broad band between 1400 and 1600 is superposed to those Raman modes, probably associated to impurities. Moreover a new Raman mode, . This mode is characteristic of C60 (as can be seen in : XPS spectra of the (a) C 1s and (b) N 1s core levels for different sample preparations
the green spectrum of figure 4) and clearly confirms that C60 molecules have been adsorbed on PATP
molecules. The weak intensity of this mode is rather surprising since in previous studies from the literature the intensity of C60 modes excited at 1064 nm was extremely intense. But it must be noticed that this IR
excitation is quite far from plasmonic absorption of gold or silver nanostructures. Further confirmation of the presence of C60 molecules was also brought by UV-Visible optical absorption (1-Transmission) measurements30.
The question is why the PATP SERS spectrum is modified after C60 adsorption. Two hypotheses can be put
forward: those modifications are induced by C60 adsorption itself or by the heating process operated to
promote the adsorption. This high temperature treatment in toluene can induce a desorption and a reorganisation of the PATP layer due to the labile nature of the thiol to gold bonding. However, XPS measurements suggest that no PATP molecule desorbed during C60 adsorption. To elucidate the effect of C60
grafting, we put an Au-PATP sample in a toluene solution heated at the temperature used in the grafting process of C60 (~110°C) but without dissolved C60 molecules. The XPS spectra of this sample can be seen in
figure 3. The spectra of the nitrogen and carbon core levels are almost identical to the case of the C60 grafted
sample. This important result suggests that the broadening of the nitrogen peak previously mentioned is certainly induced by a change in the organisation of the PATP layer due to the annealing process31. Concerning the C1s peak, one can note a small high binding energy shoulder at around 288 eV that is slightly decreased after C60 deposition. This peak may be induced by the C=O bond of an amide formed by
reaction between amine and carbon dioxide32 and whose presence was detected in infrared spectra. The decrease of this signal after C60 deposition is consistent with the grafting of C60 that prevents from the
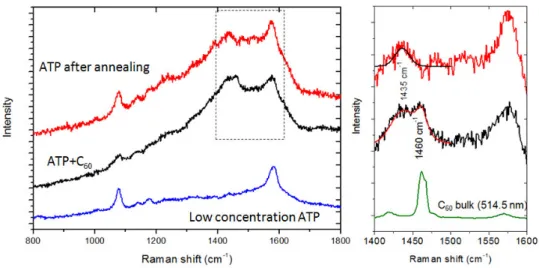
Figure 4: Left: SERS signal of PATP+C60 SAM (black), PATP after annealing in toluene (red) and low
concentration PATP SAM (10-5 mol/L, 1 minute dipping in blue). Right: an enlargement of black and red spectra. The characteristic peak of C60 at 1460 cm
-1
can be clearly observed. The bulk spectrum of C60 obtained with 514.5 nm excitation is shown in green. For all other spectra, the
11
formation of amide groups. The area of the carbon peak for the C60 grafted sample has increased by a factor
of 1.7 as compared to the peak for the PATP SAM. This clearly indicates that C60 molecules have actually
been fixed on the PATP SAM. More surprisingly the intensity of this same carbon peak is also higher for the sample after heating in toluene (by a factor of 1.2 as compared to the peak for the PATP SAM). Certainly carbon impurities are deposited on the surface during heating in toluene. Comparing the intensity of the carbon peak between the C60 grafted sample and the PATP sample heated in toluene, we can estimate the
amount of C60 molecules grafted if we consider that the same amount of impurities was deposited. The
effective increase of the C/N ratio of 1.7-1.2=0.5 C/N corresponds to about 3 additional carbons for each PATP molecule, or one C60 molecule deposited every 20 PATP molecules on the surface. This corresponds
roughly to about half of the maximal C60 density achievable on a (√3x√3)R30° PATP SAM, even if this
organisation has not been clearly confirmed for PATP molecules on gold33. As a consequence the density of C60 molecule is rather low, explaining why the C60 Raman peak has a rather weak intensity. This result also
explains why the peak corresponding to nitrogen bonded to C60 was not observed in the XPS spectrum of
figure 3: its absolute intensity is very low and the signal is furthermore screened by the presence of fullerene molecules. The SERS spectrum of a PATP SAM after heating in toluene is shown in figure 4 (red spectrum). Except for the C60 peak at 1460 cm-1, this spectrum is very similar to what we observed after C60 adsorption.
This indicates that the evolution of Raman modes of PATP is induced by the high temperature treatment in toluene. We also performed a similar high temperature treatment without any solvent in an incubator and the spectrum was almost identical to the standard SERS spectrum of PATP, despite a slight decrease of intensity34. This indicates that it is not only temperature that plays a role in the evolution of PATP Raman modes, but also the presence of solvent. It must be noticed that both SERS spectra of C60 grafted sample and
of PATP SAM annealed in toluene are very similar to the SERS spectrum of the low density PATP SAM in figure 1. The only difference is the 1435 cm-1 mode, whose intensity is very weak for the low density PATP SAM. XPS measurements indicates that carbon impurities are adsorbed during the heating in toluene (intensity increase of the carbon mode), which is confirmed by the presence of a broad band between 1400 and 1600 cm-1 in the SERS spectrum35.
Different hypotheses may explain the evolution of PATP modes in SERS spectra. The first one is a possible rearrangement of gold nanoparticles induced by high temperature treatment. It is well known that annealing of metallic nanoparticles can bring modifications in their organisation (size, distribution, etc.) and can have very important consequences for SERS measurements36. With thiol molecules it is possible to create gold nanoparticle superlattices37. In the special case of PATP, this molecule can induce the formation of “sandwich” structures, that is to say interlinked nanoparticles via a PATP molecule. This has been reported in several studies12 and can have dramatic effects in the SERS spectrum of this molecule. Nevertheless, the formation of sandwich structures should prevent the adsorption of C60 in so far as both functional groups of
PATP molecules should be already linked to gold. And as explicitly mentioned above, XPS and SERS measurements confirm the presence of C60 molecules. As a first conclusion we cannot totally exclude the
the presence of C60 molecules rather suggests that most of PATP and C60 molecules are bound otherwise C60
should have been washed off the surface during the rinsing step. To explain the observed modifications of SERS spectra of PATP after C60 adsorption or high temperature treatment, another hypothesis can be
proposed: a strong reorganisation of the PATP SAM. It is known that the stability under high temperature treatment of thiol SAM on gold (nanostructured or not) is limited38. Disorder, reconstruction and desorption can occur even at relatively moderate temperatures, typically around 100°C. In addition, this stability strongly depends on the chemical structure of the adsorbed molecules 39. The careful analysis of SERS spectra can bring information about the evolution of those SAM. Spectra reported in figure 4 are intermediate between the bulk and the SERS spectrum of PATP. They clearly show strong similarity with the low density modes, or the modes obtained with a low laser density. Once again only modes attributed to b2
symmetry are affected. In previous SERS studies, the enhancement of those modes was attributed to a charge transfer mechanism based on a Herzberg-Teller contribution19,40, that is to say a chemical enhancement. More recently, Uetsuki et al.41 have intercalated a thin spacer layer between the metal and the PATP molecules and have observed a strong decrease of the b2 modes intensity at 1141, 1390 and 1437 cm-1. With
such sample, any possibility of chemical bonding between Au atoms and PATP molecules is completely eliminated and chemical enhancement is not expected, explaining the intensity decrease of those modes. In our experiments, we observed total disappearance of 1140 and 1390 cm-1 modes and a clear decrease of the 1437 cm-1 mode, whose intensity is now clearly lower than the 1575 cm-1 mode. This is very similar to what is reported by Uetsuki et al. This could suggest that chemical enhancement of PATP is also affected by the annealing in toluene and C60 adsorption. But as previously explained it is necessary to be very cautious with
the chemical enhancement hypothesis due to the strong evolution of PATP modes with experimental parameters and the suggested dimerization of PATP molecules. In any case the strong similarity between the SERS spectrum of PATP annealed in toluene and the low density PATP layer suggests that this dimerisation do not occurs for those samples. In addition, the broadening and the shift of the N1s peak observed in XPS indicate that the layer is probably less organised. As a consequence we propose the following mechanism during C60 deposition: the annealing in toluene induces a desorption of PATP molecules, decreasing the layer
density, and an introduction of carbon impurities. The layer organisation is also strongly decreased during this step. However no dimerization occurs and C60 molecules can be grafted on top of PATP molecules. It
appears that this grafting is not very efficient as typically one C60 is grafted every 20 PATP molecules. This
proposed mechanism is in accordance with all the reported experimental features: the evolution of the SERS modes (decrease of b2 modes attributed to DMAB, appearance of broad modes between 1400 cm
-1
and 1600 cm-1) and XPS spectra (broadening and shift of the peaks).
CONCLUSIONS
We studied the SERS signal from PATP and PATP-C60 SAMs. We observed an evolution of the Raman
signal of PATP depending on two parameters: the layer density and the laser power. It appears clearly that b2
13
predictions. In opposition, if these parameters are both high, the intensity of b2 modes is enhanced. The
evolution of these modes is associated to a dimerisation of PATP molecules into DMAB. For PATP-C60
SAM we also observed strong evolution of the SERS spectra: b2 modes have their intensity considerably
decreased after C60 adsorption. Comparing SERS and XPS, we proposed a grafting reaction mechanism
during C60 deposition in toluene. Impurities and disorganisation of the PATP layer are introduced, however
those features do not prevent the adsorption of C60 molecules in a relatively low density, an issue that could
be beneficial to build isolated discrete molecular storage sites for molecular memory cells. Our work demonstrates the capability of SERS for studying complex self-assembled layers on metallic nanostructures. Consequently, SERS could be envisaged as a challenging and powerful technique that could help better understanding electronic properties and processes involved within molecular devices.
Acknowledgments
This work was partly supported by the Conseil Général du Var and the Région Provence–
Alpes–Côte d’Azur. Funding from the Objectif 2 EEC programme involving the FEDER, the
“Conseil Général du Var” Council, the PACA Regional Council, Toulon Provence Méditerranée,
and ISEN-Toulon is acknowledged. The authors would like to thank Professor Valmalette for
fruitful discussion and D. Goguenheim for his support. This work was also partly funded by the
Agence Nationale de la Recherche (ANR, CARIOCA project number 2010-JCJC-918-01).
References
1
T. Hasobe, H. Imahori, P. V. Kamat et al., Journal of the American Chemical Society 127 (4), 1216 (2005).
2
B. de Boer, M. M. Frank, Y. J. Chabal et al., Langmuir 20 (5), 1539 (2004).
3
A. R. Morrill, D. T. Duong, S. J. Lee et al., Chemical Physics Letters 473 (1-3), 116 (2009).
4
C. D. Keating, M. D. Musick, M. H. Keefe et al., Journal of Chemical Education 76 (7), 949 (1999).
5
G. P. Miller, Comptes Rendus Chimie 9 (7-8), 952 (2006); K. M. Chen, W. B. Caldwell, and C. A. Mirkin, Journal of the American Chemical Society 115 (3), 1193 (1993).
6
G. Delafosse, L. Patrone, and D. Goguenheim, J. Nanosci. Nanotechnol. 11 (doi:10.1166/jnn.2011.4289) (2011).
7
D. Guerin, S. Lenfant, S. Godey et al., Journal of Materials Chemistry 20 (13), 2680 (2010).
8
A. Kanwal and M. Chhowalla, Applied Physics Letters 89 (20) (2006); H. S. Majumdar, J. K. Baral, R. Osterbacka et al., Organic Electronics 6 (4), 188 (2005).
9
A. Ulman, An introduction to ultrathin organic films: from Langmuir-Blodgett to self-assembly. (Academic Press, Boston, 1991).
10
P. G. Etchegoin and E. C. Le Ru, Principles of surface-enhanced Raman spectroscopy and related plasmonic effects. (Elsevier, 2009).
11
J. W. Zheng, Y. G. Zhou, X. W. Li et al., Langmuir 19 (3), 632 (2003); K. Kim and H. S. Lee, Journal of Physical Chemistry B 109 (40), 18929 (2005); D. F. Zhang, L. Y. Niu, L. Jiang et al., Journal of Physical Chemistry C 112 (41), 16011 (2008); K. Kim, J. K. Yoon, H. B. Lee et al., Langmuir 27 (8), 4526 (2011); K. Kim, J. Y. Choi, H. B. Lee et al., Journal of Chemical Physics 135 (12), 9 (2011).
12
K. Kim and J. K. Yoon, Journal of Physical Chemistry B 109 (44), 20731 (2005); Y. L. Wang, H. J. Chen, S. J. Dong et al., Journal of Chemical Physics 124 (7) (2006).
13
M. Baia, F. Toderas, L. Baia et al., Chemical Physics Letters 422 (1-3), 127 (2006).
14
K. Kim, D. Shin, H. B. Lee et al., Chemical Communications 47 (7), 2020 (2011).
15
L. B. Zhao, R. Huang, Y. F. Huang et al., Journal of Chemical Physics 135 (13), 11 (2011).
16
P. Verma, K. Yamada, H. Watanabe et al., Physical Review B 73 (4), 045416 (2006).
17
Z. Q. Niu and Y. Fang, Vibrational Spectroscopy 43 (2), 415 (2007); Y. Fang, Q. J. Huang, P. J. Wang et al., Chemical Physics Letters 381 (3-4), 255 (2003).
18
See Supplementary Material Document No.
19
M. Osawa, N. Matsuda, K. Yoshii et al., Journal of Physical Chemistry 98 (48), 12702 (1994).
20
D. Maniu, V. Chis, M. Baia et al., Journal of Optoelectronics and Advanced Materials 9 (3), 733 (2007).
21
M. Moskovits and J. S. Suh, Journal of Physical Chemistry 88 (23), 5526 (1984).
22
M. Pagannone, B. Fornari, and G. Mattei, Spectrochimica Acta Part a-Molecular and Biomolecular Spectroscopy 43 (5), 621 (1987).
23
K. T. Carron and L. G. Hurley, Journal of Physical Chemistry 95 (24), 9979 (1991); T. H. Joo, M. S. Kim, and K. Kim, Journal of Raman Spectroscopy 18 (1), 57 (1987).
24
J. Lukkari, K. Kleemola, M. Meretoja et al., Langmuir 14 (7), 1705 (1998).
25
Y. R. Fang, Y. Z. Li, H. X. Xu et al., Langmuir 26 (11), 7737 (2010); D. Y. Wu, X. M. Liu, Y. F. Huang et al., Journal of Physical Chemistry C 113 (42), 18212 (2009).
26
Y. F. Huang, H. P. Zhu, G. K. Liu et al., Journal of the American Chemical Society 132 (27), 9244 (2010).
27
R. R. Sahoo and A. Patnaik, Journal of Colloid and Interface Science 268 (1), 43 (2003); R. R. Sahoo and A. Patnaik, Applied Surface Science 245 (1-4), 26 (2005).
28
J. E. Baio, T. Weidner, J. Brison et al., Journal of Electron Spectroscopy and Related Phenomena
172 (1-3), 2 (2009).
29
See Supplementary Material Document No.
30
See Supplementary Material Document No.
31
“ The broadening toward higher binding energies may be due to NH3+ and/or hydrogen bonding between NH2 terminal groups. In the latter case, the disorder may weaken p-p interactions betwen
15
phenyl rings that can be more tilted thus promoting the formation of hydrogen bonding between terminal amines.”
32
N. Graf, E. Yegen, T. Gross et al., Surface Science 603 (18), 2849 (2009).
33
V. Batz, M. A. Schneeweiss, D. Kramer et al., Journal of Electroanalytical Chemistry 491 (1-2), 55 (2000).
34
See Supplementary Material Document No.
35
A. Kudelski and B. Pettinger, Chemical Physics Letters 321 (5-6), 356 (2000).
36
M. Suzuki, Y. Niidome, and S. Yamada, Colloids and Surfaces a-Physicochemical and Engineering Aspects 284, 388 (2006).
37
J. E. Martin, J. P. Wilcoxon, J. Odinek et al., Journal of Physical Chemistry B 104 (40), 9475 (2000).
38
A. Chandekar, S. K. Sengupta, and J. E. Whitten, Applied Surface Science 256 (9), 2742 (2010); X. D. Xiao, B. Wang, C. Zhang et al., Surface Science 472 (1-2), 41 (2001); E. Delamarche, B. Michel, H. Kang et al., Langmuir 10 (11), 4103 (1994).
39
T. Ishida, H. Fukushima, W. Mizutani et al., Langmuir 18 (1), 83 (2002).
40
J. R. Lombardi, R. L. Birke, T. H. Lu et al., Journal of Chemical Physics 84 (8), 4174 (1986).
41