HAL Id: hal-01096818
https://hal-univ-tln.archives-ouvertes.fr/hal-01096818
Submitted on 5 Jan 2015HAL is a multi-disciplinary open access archive for the deposit and dissemination of sci-entific research documents, whether they are pub-lished or not. The documents may come from teaching and research institutions in France or abroad, or from public or private research centers.
L’archive ouverte pluridisciplinaire HAL, est destinée au dépôt et à la diffusion de documents scientifiques de niveau recherche, publiés ou non, émanant des établissements d’enseignement et de recherche français ou étrangers, des laboratoires publics ou privés.
Voltammetric procedure for trace metal analysis in
polluted natural waters using homemade bare gold-disk
microelectrodes
Cédric Garnier, Lesven Ludovic, Billon Gabriel, Magnier Aurélie, Mikkelsen
Øyvind, Pižeta Ivanka
To cite this version:
Cédric Garnier, Lesven Ludovic, Billon Gabriel, Magnier Aurélie, Mikkelsen Øyvind, et al.. Voltam-metric procedure for trace metal analysis in polluted natural waters using homemade bare gold-disk microelectrodes. Analytical and Bioanalytical Chemistry, Springer Verlag, 2006, 386 (2), pp.313-323. �10.1007/s00216-006-0625-9�. �hal-01096818�
Anal Bioanal Chem
DOI 10.1007/s00216-006-0625-9
O R I G I N A L PA P E R
C. Garnier . L. Lesven . G. Billon . A. Magnier . Ø. Mikkelsen . I. Pižeta
Voltammetric procedure for trace metal analysis in polluted
natural waters using homemade bare gold-disk microelectrodes
Received: 20 January 2006 / Revised: 23 May 2006 / Accepted: 16 June 2006
# Springer-Verlag 2006
Abstract Voltammetric procedures for trace metals anal-ysis in polluted natural waters using homemade bare gold-disk microelectrodes of 25- and 125-μm diameters have been determined. In filtered seawater samples, square wave anodic stripping voltammetry (SWASV) with a frequency of 25 Hz is applied for analysis, whereas in unfiltered contaminated river samples, differential pulse anodic stripping voltammetry (DPASV) gave more reliable results. The peak potentials of the determined trace metals are shifted to more positive values compared to mercury drop or mercury-coated electrodes, with Zn always displaying 2 peaks, and Pb and Cd inversing their positions. For a deposition step of 120 s at −1.1 V, without stirring, the 25-μm gold-disk microelectrode has a linear response for Cd, Cu, Mn, Pb and Zn from 0.2μg L−1(1μg L−1for Mn) to 20μg L−1(30μg L−1for Zn, Pb and 80μg L−1for Mn). Under the same analytical conditions, the 125-μm gold-disk microelectrode shows linear behaviour for Cd, Cu, Pb and Zn from 1 μg L−1 (5μg L−1 for Cd) to 100 μg L−1 (200μg L−1for Pb). The sensitivity of the 25-μm electrode varied for different analytes from 0.23 (±0.5%, Mn) to 4.83 (±0.9%, Pb) nA Lμmol−1, and sensitivity of the 125-μm electrode varied from 1.48 (±0.7%, Zn) to 58.53 (±1.1%,
Pb nA Lμmol−1. These microelectrodes have been vali-dated for natural sample analysis by use in an on-site system to monitor Cu, Pb and Zn labile concentrations in the Deûle River (France), polluted by industrial activities. First results obtained on sediment core issued from the same location have shown the ability of this type of microelectrode for in situ measurements of Pb and Mn concentrations in anoxic sediments.
Keywords Voltammetry . Bare gold microelectrode . Environmental monitoring . Trace metals
Introduction
One of the new interests in environmental analytical chemistry is the development of in situ or at least in-field measurement and monitoring in the aquatic systems, including sediments, where the sampling and the porewater extraction is quite a difficult task because of the partial or total anoxia of the medium and the difficulty in preserving it in the sample until measurement. Up to now, only electroanalytical methods offer the ability to achieve this challenge for trace metals measurements. Research in this area has progressed quickly thanks to the parallel work of several groups. Wang and co-workers [1–4] investigated the behaviour of microelectrodes (carbon fiber and gold), bare or covered with mercury, for application in remote monitoring of trace lead, copper, mercury or selenium with potentiometric stripping voltammetry as the method of choice. Luther and co-workers demonstrated that the use of mercury-plated gold microelectrodes allows the in situ determination of, among others, Mn(II), Fe(II) and S(-II) in sediment porewaters [5–10]. In the same period, Buffle and co-workers focussed their micro-captors on Ir microelec-trodes also plated with mercury for Zn, Pb, Cd and Cu analysis [11–15]. In this case, a monitoring system is introduced in the water column, though the voltammetric
C. Garnier . L. Lesven . G. Billon . A. Magnier Equipe de Chimie Analytique et Marine UMR8013, Université des Sciences et Technologies de Lille, Cité Scientifique,
59655 Villeneuve d’Ascq, France C. Garnier (*)
Laboratoire LPTC UMR5472, Université Bordeaux I, 33405 Talence, France
e-mail: [email protected] Ø. Mikkelsen
Department of Chemistry,
Faculty of Natural Sciences and Technology, 7491 Trondheim, Norway
I. Pižeta
Center for Marine and Environmental Research, Ruđer Bošković Institute,
measurements are not really performed in situ because of the necessity for removing oxygen from the sample before analysis. Another attempt with Ir microelectrodes with only traces of mercury was successful for Pb and Cd determi-nation and measurements in box-core sediments [16]. Preparation for in-field measurements has been carried out on gold electrodes in acidic solutions [17,18], solid dental amalgam electrodes [19, 20] and alloys [21]. Kirowa-Eisner’s team [22–27] researched solid bare silver and gold electrodes of macro scale, contributing to a better under-standing and application of underpotential deposition (UPD) effects in stripping voltammetry [28].
In this paper, a voltammetric study on 25-μm and 125-μm diameter gold-disk microelectrodes is presented for Cd, Cu, Hg, Mn, Pb and Zn determination with detection limits in the nmol L−1 range. A detailed calibration and stability study on these electrodes in seawater and polluted freshwater sampled in the River Deûle (northern France) has been performed, and an application to in-field analyses is presented and compared with inductively coupled plasma–mass spectrometry (ICP-MS) measurements. The same electrodes have been used in situ to analyse sediment concentrations of Mn and Pb.
Experimental
Equipment
In the laboratory, voltammetric measurements were carried out with a voltammetric analyser comprising aμAutolabII coupled to a VA663 stand (EcoChemie, Metrohm) con-trolled by the GPES 4.9 software. An Ag/AgCl/3 mol L−1 KCl electrode and a carbon rod were used as the reference and the auxiliary electrode, respectively. All potential values in this paper are given versus this Ag/AgCl reference electrode. A Teflon PFA cell (Metrohm) was used to minimize sample contaminations.
In the field, a pump (CO/TECH) is used, as well as two homemade Teflon cells, a homemade reference electrode (Ag/AgCl/3 mol L−1 KCl in agarose matrix) and a magnetic stirrer, Radiometer). A combined microelectrode (Radiometer) linked to a pH meter (Meterlab PHM210, Radiometer) is used to measure the sample pH. An ICP-MS (X Series, Thermo Elemental) was used in a clean room to measure the total dissolved metal concentrations.
Reagents
Standard solutions (100μg L−1, 1, 10 and 100 mg L−1of Cd, Cu, Hg, Mn, Pb and Zn) were prepared by dilution of 1,000 mg L−1metal solutions (CertiPur, Merck: nitrate salts in HNO3) in Milli-Q water (Milli-Q Plus apparatus,
Millipore, resistivity 18.2 MΩ cm). All other reagents (HNO3, KOH, C2H5OH) are of analytical grade. Gold
wires used to design the microelectrodes (diameter 25- and 125-μm, purity 99.99 %) were obtained from Goodfellow Company (UK).
Voltammetric measurements were performed in marine and river water samples. Unpolluted seawater was sampled in the Authie Bay (northern France), filtered at 0.45-μm and stored in dark at 4 °C so as to minimize the development of organisms. On the other hand, river water was sampled in the River Deûle (North of France), just upstream from the former highly polluting metal industry factories. As the final goal of this study is to use the microelectrodes in situ at the water–sediment interface in aquatic river systems, this second sample was stored without any treatment in the dark at natural pH (i.e. 8.1) and at ambient temperature.
Dissolved trace metal concentrations in both natural samples were measured by ICP-MS after filtration and HNO3acidification.
Gold-disk microelectrode preparation
The protocol used for microelectrode preparation was based on that developed by Nyholm and Wikmark [29] and more recently by Billon and van den Berg [30].
Briefly, one extremity of a 4- to 5-cm gold wire (25- or 125-μm diameter) is attached to a shielded electrical copper wire using silver epoxy. The second extremity is heat-sealed in a polyethylene pipette tip (200μL) by using a homemade tubular oven (diameter ca. 1 cm) at 500 °C. A second tip enclosing the electrical wire is stuck to the first one with a non-conductive epoxy glue, leaving out the copper wire contact.
An electroactive gold-disk surface is obtained by polishing the heat-sealed extremity with different sand papers and subsequently with diamond paste (diameter 1 μm) to a mirror finish. The surface of the gold microelectrode is checked after every polishing step with an optical microscope (Reichert, Austria) at magnification from 110× to 320×.
In order to clean the gold surface, the microelectrode was rinsed under ultrasound for 60 s, first in ultra-pure ethanol, then in a 10% ultrapur HNO3solution and finally in Milli-Q
water. To validate all the preparation steps, the microelec-trode response is checked by using cyclic voltammetry: 10 cycles from 0.65 V to−1.1 V (i.e. the working potential window for electrochemical measurements on our gold micro-surfaces) were performed in seawater at a rate of 0.1 V s−1. The electrode response indicating a good manufacture is generally characterised by voltammograms displaying no hysteresis between the cycles and two oxygen reduction waves which must disappear after N2
purging.
Voltammetric parameters
Trace metals analysis was carried out using either square wave or differential pulse anodic stripping voltammetry (SWASVor DPASV), depending on the signal stability (see “Results and discussion”). Samples were purged with N2
before each measurement due to the high sensitivity of a gold electroactive surface towards oxygen.
The voltammetric parameters were first optimised to improve the sensitivity and the reproducibility of the measurements. These parameters are summarized in Table 1. Overall, a 120-s deposition time was chosen to obtain a good compromise between the detection limit and the duration of the experiment. In addition, before the accumulation step, a 30-s conditioning step at 0.65 V is used to clean the surface of the electrode, i.e. to keep it electroactive. The microelectrode was kept on a potential of 0.65 V between each measurement.
Results and discussion
Applications of in situ measurements and determinations of electroactive species of trace metals are envisaged either in seawater or in river water matrices and their corresponding sediments. As in situ determinations exclude standard addition methods, but rather rely on calibration lines, experiments for the characterisation and calibration of the homemade microelectrodes were classified by the matrix of the investigated solution in order to minimize the quantification errors.
Filtered seawater sample
Unlike spectroscopic techniques (e.g. ICP-MS, AAS and GFAAS) electrochemical analyses are not really affected by the complex seawater matrix, which even could simplify the metal speciation by formation of chloride–metal compounds. In addition, the high ionic strength (I≈0.5) coupled to the buffer capacity that is linked to the presence of hydrogeno-carbonates ensures stable conditions during measurements [31]. Unlike the spectroscopic techniques which directly measure total metal concentrations,
electro-chemical techniques can distinguish the labile metal fraction, sum of free and inorganically bound metal, which is more available for the biota than the metal fraction complexed by organic compounds. Moreover, as our aim is to use microelectrodes in natural systems, it appears more realistic to perform experiments in marine samples than in obviously simpler artificial ones. For all these reasons, the microelectrode suitability for trace elements analysis has been tested in filtered seawater sample.
The first step was to determine which elements could be detected by the prepared electrodes and to locate their corresponding peak potentials.
25-μm gold-disk microelectrode
Calibration Mn, Zn, Pb, Cd, Cu and Hg peaks obtained by SWASV with the 25-μm gold-disk microelectrode are shown in Fig. 1 for successive additions of standard solutions in filtered seawater at natural pH. These 6 trace metals could thus be analysed in natural waters with different sensitivities. In spite of very low current scale (peaks height lower than 0.01 nA for the first additions), for a 120-s deposition time without stirring the signal to noise ratio allows analysis of metal concentrations below 1μg L−1.
Compared to classical measurements carried out on mercury or liquid amalgam surfaces, all the peak potentials observed for the different metals deposited on the gold microelectrode are shifted to more positive values. In fact, the linear dependence of current on concentration of monolayer forming, with the effect of UPD, is used ([28] and references cited therein). This shift allows easier analysis of Mn and Zn at natural pH. Moreover, the order of Pb and Cd oxidation peaks is swapped compared to mercury electrodes (which matches with the results of Bonfil et al. [27]), which may be due to different gold– metal affinities. These two peaks are quite close, and in the case of high concentrations of both metals, it could complicate their analysis. Zn is characterised by two successive peaks. The presence of two peaks for zinc can be explained by either a difference between the stability of the Au–Zn monolayer and the other subsequent Zn–Zn deposits, or from stepwise oxidation, or from quasi-reversible electrode reaction with two waves as is possible for certain values ofα (electron transfer coefficient) [32], which could be a subject of another investigation.
To calibrate the microelectrode over a wide concentra-tion range, addiconcentra-tions of the 6 metals were carried out from 0.2 to 50μg L−1(to 100μg L−1for Mn) in a decade mode [33]. For each addition, the SWASV measurements were repeated twice. As the baseline did not significantly change with time during the experiments, mathematical treatment consisted in subtracting the blank curve (which here represents the average of 3 successive voltammo-grams obtained in seawater before any metal addition) from the obtained voltammograms. Subsequently, the peak height and/or area are determined using a linear baseline. Concerning Zn, the area of the sum of the two peaks and
Table 1 Optimised voltammetric parameters for Zn, Cd, Pb, Cu, Mn and Hg analysis in seawater sample by SWASV and DPASV techniques SWASV DPASV Purge 30 s 30 s Accumulation step Conditioning potential 0.65 V 0.65 V Conditioning time 30 s 30 s Deposition potential −1.1 V −1.1 V Deposition time 120 s 120 s Equilibration time 5 s 5 s Measuring step Potential window −1.1 to 0.65 V −1.1 to 0.65 V Frequency 25 Hz / Step potential 5 mV 10 mV Amplitude 20 mV 75 mV Modulation time – 0.05 s Interval time – 0.60 s
the height of the more positive one were determined. At low concentrations, due to Mn and Cu peaks shape, i.e. position in the steep baseline, it was not possible to correctly integrate and determine the area of these peaks, only their height. The obtained results, i.e. the slopes of the calibration lines representing the sensitivity of the measuring systems, are summarized in Table 2 (data for peak areas are not shown), and the calibration of Pb is shown as an example in Fig. 2. For each metal, the linearity range is determined by the detection limit (i.e. the lowest concentration leading to a measurable and repetitive peak) and the upper concentration limit, above which the microelectrode response is no longer linear, caused by the saturation of the electrode surface. The response of the 25-μm microelectrode for Hg (peak potential 0.42 V), although linear (R2 0.995) from 0.5 to 20μgHgL−1is not shown in this paper due to its difficult
reproducibility. This phenomenon is certainly due to the formation of a strong Au amalgam [34], leading to a Hg coating of the gold surface that changes its reactivity, making it inappropriate for DPASV and SWASV tech-niques, in contrast to stripping chronopotentiometry [18]. The results indicate that the sensitivity when considering peak height (expressed in A L mol−1), decreases in the following order: Cu, Pb, Zn, Cd and Mn. Yet, except for Mn, all these trace metals are detectable at concentrations as low as 0.2μg L−1(1–3 nmol L−1) and up to 20–30 μg L−1
(150–460 nmol L−1) with linearity coefficient ranging between 0.996 and 0.999. Similar experiments were carried out in UV-digested seawater samples, but have not shown any relevant differences in voltammogram shape and peak evolutions (data not shown). This is probably due to the low concentrations of natural organic matter found in marine waters, and the quite high metal concentrations added, when compared to the concentration present at first, resulting in a low metal fraction in the form of inert organic compounds (i.e. a low metal complexing capacity).
Compared to previous results obtained with the mercu-ry-plated gold wire and the disk electrodes (both of 25-μm diameter) [30], the 25-μm gold-disk microelectrode presented here showed a poorer detection limit for Pb than the gold/mercury-wire (0.07 nmol L−1) but a much better detection limit than the gold/mercury-disk (10 nmol L−1), in spite of a lower deposition time (120 s compared to 300 s). So, a bare gold surface seems to be more sensitive to trace metals than a similar one plated with mercury, while during the accumulation step there is no formation of amalgam and diffusion into the body of the electrode, which in turn might not be depleted in the stripping step. The comparison of Pb sensitivities normal-ized to the exposed electroactive surface area (gold disk 9.8 A L mol−1 mm−2, gold/mercury-wire and disk 6 A L mol−1 mm−2 [30]) confirmed this assumption. On
Pb 0.2 0.3 0.4 0.5 -0.3 -0.2 -0.1 Cu 0.2 0.3 0.4 0.5 0.6 0.2 0.3 Zn 0.05 0.15 0.25 -0.8 -0.6 -0.4 -0.2 Cd 0.2 0.3 0.4 -0.2 -0.1 0.0 Hg 0.05 0.15 0.25 0.4 0.5 Mn 0.05 0.15 0.25 -1.1 -0.9 E (V) I (n A )
Fig. 1 Evolution of Mn2+, Zn2+, Pb2+, Cd2+, Cu2+and Hg2+peaks measured with the 25-μm gold-disk microelectrode using SWASV without stirring for different additions of standard solutions in
filtered and deaerated seawater sample (Mn: 1, 2, 5, 7.5, 10, 15 and 20μg L−1; Zn, Pb, Cd, Cu, Hg: 1, 2, 3, 4, 5, 7.5 and 10μg L−1)
Table 2 Results of the 25-μm gold-disk microelectrode calibrations for Mn2+
, Zn2+, Pb2+, Cd2+and Cu2+in seawater sample applying SWASV (all the potential values are given versus the Ag/AgCl, [KCl]=3 mol L−1reference electrode)
Mn Zn Pb Cd Cu
Linearity (μg L−1) 1–80 0.2–30 0.2–30 0.2–20 0.2–20
Peak potential (V) −0.93 −0.57 and −0.34 −0.15 −0.02 0.25
Sensitivity (A Lμg−1×10¹²) 4.2 7.0 23.3 8.8 27.9
Sensitivity (A M−1mm−2) 0.05 0.9 9.8 2.0 3.6
Sensitivity standard deviation (%) 0.5 1.2 0.9 0.6 0.5
the other hand, the saturation during the accumulation step occurred at a lower concentration with the gold-disk microelectrode. This is due to the difference in the electroactive geometry, which is a volume in the mercury plated microelectrode and only a monolayer surface in the bare gold one. However, detection limits obtained with the bare gold microelectrodes are low enough to determine trace metal concentrations in heavily polluted aquatic systems like waters or interstitial waters from several rivers in northern France.
Calibration of the microelectrode was also carried out by DPASV. DPASV measurement peaks, although less noisy than SWASV ones, are less sensitive and so lead to a more difficult determination of trace metal concentrations below 1 μg L−1. Coupled with the higher duration of DPASV measurements, SWASV was chosen as the most convenient technique for trace metals analysis in marine waters using this type of microelectrode.
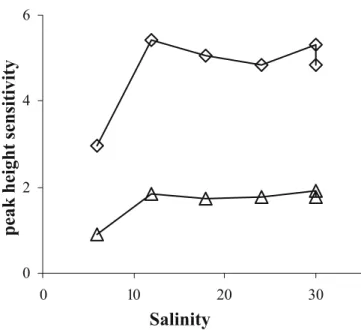
Effect of salinity Variations of Cu and Pb sensitivities were studied as a function of salinity by dilution of the seawater sample with milli-Q water. Results obtained are depicted in Fig.3. The observed variations seemed independent of the analysed metal. For a salinity range from 30 to 12, the microelectrode sensitivity is quite constant (variation below 6%). At the salinity value of 6, the sensitivity diminished by a factor close to 2. Moreover, the baseline, the peak shapes and the peak positions are really modified (data not shown) but always remain repeatable. As an addition of NaCl or NaNO3to the solution did not bring
the signals to the initial shape and sensitivity, this
phenomenon should not only be attributed to a drop of the ionic strength but also to metal speciation modifica-tions, mainly controlled by inorganic anions and leading to variations of their electrochemical labilities and so to variations of their behaviour at the gold surface. Therefore, trace metal analysis in river water should need some
y = 0.0233x R2 = 0.998 0.0 0.2 0.4 0.6 0.8 1.0 0 20 Pb (µg L-1) 40 60 Pea k h eig h t (nA ) 0.00 0.02 0.04 0.06 0.08 0.10 0 2 4 6
Fig. 2 Calibration of the 25-μm gold-disk microelectrode for Pb up to 60μg L−1 0 2 4 6 0 10 20 30
Salinity
peak height sensitivity
Fig. 3 Sensitivities variations of Cu (triangles) and Pb (diamonds) (expressed in A L mol−1×10³) versus salinity. Experimental setup as in Fig.1
modifications of the voltammetric parameters from those optimised for marine waters.
Electrode stability in time As the aim of this work is to prove the suitability of the gold microelectrodes for the monitoring of trace metals concentrations in natural systems, their stabilities were studied over a long period. The seawater sample with 5μg L−1of Pb was analysed for 16.5 h. Evolutions of Pb peak heights are depicted in Fig.4. Compared to the average values (dotted line), measure-ments did not show any important variations (standard deviation inferior to 5%) and so confirmed the ability of this type of microelectrode for extended in situ analysis.
125-μm gold-disk microelectrode
Calibration of the 125-μm microelectrode for Zn, Pb, Cd and Cu was carried out by applying SWASV in seawater samples using a similar procedure as for the 25-μm electrode. As predicted by the theory and the preliminary results, which showed that concentration limits of saturation were higher for the 125-μm microelectrode than for the 25-μm one (surface ratio of the two electrodes is 25), the analysed range of metal additions was extended to 200μg L−1. The obtained results are summarized in Table3.
Peak positions of the 4 studied metals are not modified by the use of this larger gold-disk surface. Compared to the results obtained with the 25-μm gold-disk, for all the studied metals, the linearity range is shifted to higher concentrations by one order of magnitude (i.e. from 0.2 to 30 μgPb L−1 for the 25-μm electrode, and from 1 to
200 μgPb L−1 for the 125-μm electrode). The analysed
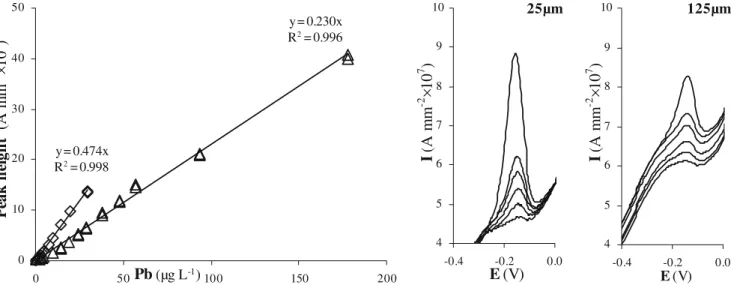
peaks are higher, and so easily measurable by voltammetric equipment, leading to higher sensitivity values. It has to be pointed out that this increase of sensitivity depends on the metal, ranging from a factor of 2 (Pb) to 7.5 (Zn) for the peak height (see Tables2 and3). Calibration lines of the 25-μm and 125-μm microelectrodes for Pb are compared in Fig. 5. In this figure, the peak heights have been normalised to surface area of the electrodes and so expressed in A mm−2. These results showed that for the 25-μm gold-disk the definition of the Pb peak is easier.
Moreover, as expected, for the smaller electroactive area the sensitivity normalized to the electrode surface is higher (for Pb, 9.8 A L mol−1mm−2versus 4.8 A L mol−1mm−2, for the 25-μm and the 125-μm electrode, respectively) [35].
So, the 125-μm microelectrode could be used to study more polluted samples, as for example sediments, necessitating more robust equipment for analysis.
Unfiltered river samples
The River Deûle is well known for its high degree of metal pollution in water column as well as in sediments, as a result of the intensive industrial activities [36]. Total dissolved metal concentrations in the water sampled on 16 June 2005 were measured by ICP-MS after sample filtration and acidification. Results obtained are 0.30±0.02 μgCd L−1, 1.60±0.08 μgCu L−1, 4.0±
0.2 μgMn L−1, 4.8±0.3 μgPb L−1 and 30±2 μgZn L−1.
Considering these values, analysis carried out in the River Deûle samples has focussed on the measurements of Cu, Pb and Zn.
As observed before, in samples with low salinity such as river water, voltammograms are quite different from the marine ones. Moreover, an adsorption of organic com-pounds occurred, as indicated by a peak in the first cathodic scan of the cyclic voltammetry procedure. With time, this adsorption greatly modifies the sensitivity of the gold electroactive surface, leading to incorrect measurements. From the cyclic voltammogram in seawater sample (data not shown), it is possible to define the sign of the surface charge as negative below 0.1 V and positive above. As the standby potential defined in our experiments to clean the surface is 0.65 V (see Table2), the electroactive surface is kept positive, which facilitates the adsorption of organic matter that is globally negative at natural pH, since it is mostly deprotonated [31]. The solution adopted to minimize the interaction of organic matter on measurement consists in keeping the electrochemical cell off between two measurements, allowing the electrode to position to the potential of the solution (open circuit potential) and by just maintaining a conditioning step of 30 s at +0.65 V. This led
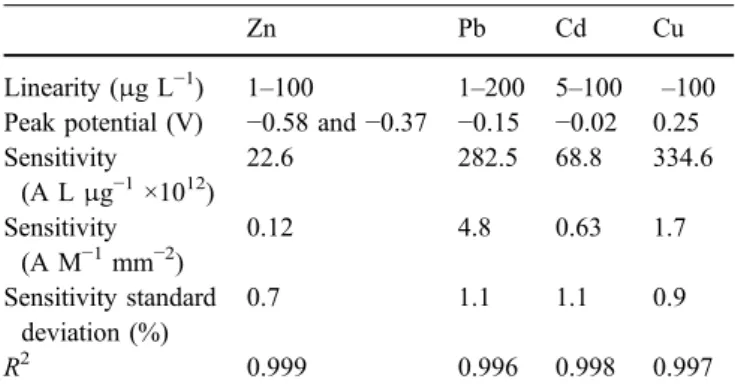
Table 3 Results of the 125-μm gold-disk microelectrode calibra-tions for Zn2+, Pb2+, Cd2+ and Cu2+ in seawater sample by applying SWASV (all the potential values are given versus the Ag/ AgCl, [KCl]=3 mol L−1reference electrode)
Zn Pb Cd Cu
Linearity (μg L−1) 1–100 1–200 5–100 –100 Peak potential (V) −0.58 and −0.37 −0.15 −0.02 0.25 Sensitivity (A Lμg−1×10¹²) 22.6 282.5 68.8 334.6 Sensitivity (A M−1mm−2) 0.12 4.8 0.63 1.7 Sensitivity standard deviation (%) 0.7 1.1 1.1 0.9 R2 0.999 0.996 0.998 0.997 0.00 0.02 0.04 0.06 0.08 0 200 400 600 800 1000 time (min) height (nA)
Fig. 4 Time variations of Pb peak height measured by SWASV (diamonds peak height, dotted line peak height average value) in seawater sample with 5 μg L−1 of Pb. Experimental setup as in Fig.1
to a clear attenuation of this undesirable adsorption, giving correct voltammetric analysis of unfiltered river sample within the time of measurement.
Calibration
The 25-μm gold-disk microelectrode was calibrated in the unfiltered river sample, applying SWASV and DPASV techniques for Cu, Pb and Zn, by standard additions from 1 to 20 μg L−1 (to 50 μg L−1 for Zn) in a decade mode. Owing to the baseline stability, the mathematical treatment of the obtained voltammograms was similar to that used for the seawater sample. The results obtained for DPASV are summarized in Table4. Zn, Pb and Cu peaks are depicted in Fig.6for successive additions of standard solutions in unfiltered sample at natural pH.
The signal stability proved the ability to use the 25-μm gold-disk microelectrode for analysis of these 3 trace metals in a complex medium such as this unfiltered polluted river water. Regarding the shape of the voltam-mograms obtained in the pure sample, prior to standard additions (see Fig.6, lowest scans), peaks corresponding to
the 3 metals are clearly detectable and could be analysed after calibration of the microelectrode. Their peak potentials were shifted to more negative values by 110– 280 mV, when compared to seawater matrix. This indicates the existence of more inert complexes.
Considering the complexity of the analysed solution and particularly the existence of binding organic compounds and adsorptive particles, some chemical forms of these 3 metals—named inert ones—might not be analysable by voltammetry. Indeed, the fraction of metal measurable by a voltammetric technique, referred to as labile, usually corresponds to the sum of free metal, labile inorganic complexes and some organic ones. In this sense, during additions of standard metal solutions, a concave curvature in the microelectrode response (i.e. area or peak height versus added metal concentration) means that the added
y = 0.474x R2 = 0.998 y = 0.230x R2 = 0.996 0 10 20 30 40 50 0 50Pb (µg L-1)100 150 200 P ea k he ig ht (A m m -2 10 7 ) 125µm 4 5 6 7 8 9 10 -0.4 -0.2 0.0 E (V) I (A m m -2 10 7 ) 25µm 4 5 6 7 8 9 10 -0.4 -0.2 0.0 E (V) I (A m m -2 10 7 )
Fig. 5 Comparison of a the 25-μm (diamonds) and 125-μm (triangles) gold-disk microelectrode calibration lines (additions in decade mode from 0 to 200μg L−1of Pb) and b peaks shapes (additions 1, 2, 3, 4, 5 and 10μgPbL−1) measured in seawater sample with SWASV
Table 4 Results of the 25-μm gold-disk microelectrode calibrations for Zn2+, Pb2+and Cu2+in an unfiltered river sample by applying DPASV (all the potential values are given versus the Ag/AgCl, [KCl]=3 mol L−1reference electrode)
Zn Pb Cu
Linearity (μg L−1) 0–25 10–20 0–20
Peak potential (V) −0.87 and −0.60 −0.30 0.03 Sensitivity (A Lμg−1×10¹²) 2.0 23.7 8.9 Sensitivity (A M−1mm−2) 0.2 10.0 1.1 Sensitivity standard deviation (%) 6.5 1.9 0.6 R2 0.984 1.000 0.999 0.05 0.10 0.15 0.20 0.25 -1.0 -0.8 -0.6 -0.4 -0.2 0.0 0.2 E (V) I (nA ) Zn Cu Pb
Fig. 6 Evolution of Zn2+, Pb2+ and Cu2+ peaks measured by DPASV without stirring for different additions of standard solutions in unfiltered and deaerated river sample (Zn 0, 2.5, 5, 7.5, 10, 12.5 and 25μg L−1; Pb, Cu 0, 1, 2, 3, 4, 5 and 10 μg L−1). Working electrode 25-μm gold-disk microelectrode
metal is inertly complexed. At the end of the curve, a linear section allows determination of the microelectrode sensi-tivity [33]. In contrast, if the microelectrode response is linear over the whole concentration range scanned, the analysed metal should only be in the labile forms. For Cu, the microelectrode response is linear up to saturation (20μg L−1of added metal). This metal seems to be only bound by inorganic and organic labile ligands, at least in the sensitivity range of the electrode. It is probable that the strongly complexed Cu is one or two orders of magnitude lower than the first standard addition (1 μg L−1) and thus covered by noise. So, Cu concentrations measured by the microelectrode should be quite close to the total ones measured by ICP-MS. In contrast, although the response of Pb seems linear below 5μg L−1of added Pb (see Fig.6), a curvature appears at higher concentrations, which indicates that Pb is not fully labile but partially complexed by inert organic ligands or adsorbed on particles. Above 10μg L−1, the microelectrode response remains linear, allowing the determination of its sensitivity. In the case of Zn, the microelectrode response is quite similar to that obtained with Pb, although the identification of the curvature is more complicated. So, for Pb and Zn, the concentrations determined by voltammetry should be lower than the total ones, corresponding to labile and a priori more bioavailable fractions.
Zn and Cu sensitivities obtained in this sample (see Table 4) are lower by a factor close to 2 compared to the sensitivities obtained using DPASV (data not shown) in the seawater sample. Sensitivities for Pb is increased by a factor close to 2. These differences were not further investigated but confirm the necessity to calibrate the microelectrode for each type of water analysed.
Comparison of the results obtained by SWASV and DPASV showed that DPASV leads to more repeatable and less noisy signals, albeit less sensitive. This may be due to the presence of natural organic compounds and particles which interact with trace metals, a phenomenon which could disturb a rapid reoxidation step as in SW mode. DPASV was therefore chosen for the monitoring measure-ments carried out on river samples.
Initial concentrations of Cu, Pb and Zn were determined from the voltammograms obtained from the sample prior to standard addition of metal ions. Results obtained are 1.70± 0.01μgCuL−1, 0.70±0.01μgPbL−1and 20.4±1.3μgZnL−1.
As expected, Cu concentration measured by voltammetry is close to the total one measured by ICP-MS, whereas fractions analysed for Pb and Zn are respectively 80% and 30% lower than total concentrations in the sample.
Dissolved trace metals in the River Deûle
Some modifications of the electrochemical equipment were carried out for the monitoring experiments. Due to the high microelectrode sensitivity toward oxygen, samples have to be deaerated before their voltammetric analysis. So, measurements have not been carried out directly in the river, but by means of a homemade transportable
measurement system placed in the boot of a car, parked near the River Deûle. A pump (CO/TECH) immerged in the river feeds two on-line homemade Teflon cells (average internal volume 65 mL). The first cell is used to perform pH measurements. The second cell is used to perform voltammetric measurements with the 25-μm gold-disk microelectrode. Homemade reference electrode (Ag/ AgCl/3M KCl in agarose matrix) and auxiliary electrode (Pt wire) are devised to minimize their sizes compared to the commercial ones, and to be usable for analysis in sediments. These 3 electrodes are connected to the μAutolabII electrochemical instrument, controlled by the GPES 4.9 software installed on a laptop. Both cells are slowly but continuously stirred (magnetic stirrer, Radiom-eter) to prevent the sedimentation of particles. Continuous stirring of the on-line cells has not led to either significant increase of the noise of the signal, nor noticeable increase of the DPASV peaks, and so is not to be compared with classical stirring in the voltammetric cell used in the laboratory which affects the rate of reduction at the electrode. A measurement sequence, carried out on a (new) river sample, consists in: (i) rinsing the cells for 5 min with the solution from the immerged pump, (ii) stopping the pump-flow and purging the solution in both cells for 10 min, (iii) stopping the purge and performing 2 cyclic voltammetry sequences to clean the gold-disk surface and checking the absence of oxygen, (iv) performing a DPASV analysis with the 30-s purge before each measurement (deposition time 120 s).
This system was used to monitor Cu, Pb and Zn concentrations in the River Deûle (just upstream of the metal industry factories), for 6.5 h on 21 July 2005. During that period, 15 samples were taken and studied. For each sample, 20 mL was filtered and acidified for ICP-MS measurements. The measured pH values ranged between 7.7 and 8.0, and were not modified by purging.
The DPASV measurements for each sample were repeated twice. The voltammograms were more noisy than those obtained in the laboratory, an expected phenomenon considering the conditions of on-site mea-surements, and so have necessitated the use of a Savitzky– Golay smoothing function (GPES 4.9 software, EcoChemie) before the determination of Cu, Pb and Zn peaks. Considering the baseline shape and the peaks positions, very close to those obtained during the calibration step, the sensitivities summarized in Table 4 have been used to calculate Cu, Pb and Zn concentrations. These values are displayed in Fig.7and compared to the ICP-MS results.
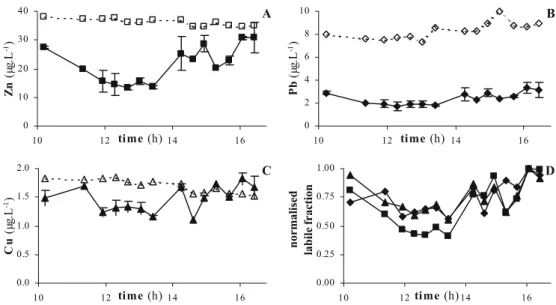
Total metal concentrations measured by ICP-MS were higher than those measured on 16 June 2005. This could be explained by the strong wind observed on that day, blowing in the opposite direction to the flow, which could more polluted waters coming from metal industry factories site move upstream. Over the 6.5 h, total Zn (Fig.7a) and Cu (Fig. 7c) concentrations decreased (respectively from 38 to 35μgZnL−1and from 1.9 to 1.5μgCuL−1), while total
Pb (Fig. 7b) concentrations increased (from 7.5 to 9.1μgPbL−1).
As expected for Cu, the labile concentrations measured by the microelectrode are closer to the total ones than in the case of Zn and Pb. Indeed, the average labile fractions (i.e. FM =Mlabile/Mtotal×100) of Zn, Pb and Cu are 60%,
29% and 87%, respectively. These labile fractions appear to fluctuate (see in Fig. 7a,b and c the labile metal concentrations variations versus the total ones) and to be independent of the total metal concentrations. When these fractions are normalized to their maximal values (i.e. F′M=FM/FMmax), as depicted in Fig. 7d, they show a
similar tendency, even for Cu. These could indicate that the reactivity of the system (i.e. interactions of organic compounds and particles with the analysed trace metals): (i) is different in the absolute between the 3 metals, as the amplitude of the labile fraction ranges from 20% to 100% depending on the metal, (ii) varies independently of the total metals concentrations, and (iii) its time variation is
quite similar for the 3 metals. On this subject, it has to be pointed out that the period in which the metal fraction as inert forms is maximum (Fig. 7d), corresponds to the classical time of high biologic activity. But, to confirm or reject this relationship, additional experiments should be carried out.
This experiment has shown the ability of the gold-disk microelectrodes for the monitoring of dissolved trace metals in a polluted aquatic environment, without filtration of the samples. The metal concentrations measured by this technique are not the total dissolved ones, like those determined by ICP-MS, but labile ones corresponding to the fraction of metal not bound by inert organic compounds or particles, a fraction which is a priori more bioavailable for the biota.
Finally, in order to prove that in situ analysis is really possible in complex and abrasive media with such a gold
A 0 10 20 30 40 10 12 time (h)14 16 Zn (µ g. L -1) B 0 2 4 6 8 10 10 12 time (h) 14 16 Pb (µ g. L -1) C 0.0 0.5 1.0 1.5 2.0 10 12 time (h)14 16 Cu (µ g. L -1) D 0.00 0.25 0.50 0.75 1.00 10 12 time (h)14 16 normalised labile fraction
Fig. 7 Variations in time of a Zn, b Pb and c Cu concentra-tions measured by DPASV in the River Deûle on 21 July 2005. d Variations in time of the normalized Zn, Pb and Cu labile fractions (see explanation in the text). (solid line DPASV average values and standard deviation, dotted line ICP-MS values, squares Zn, diamonds Pb, triangles Cu) 0.0 0.2 0.4 0.6 0.8 -1.2 -0.8
E (V)
-0.4 0 0.4I (n
A
)
R2 = 0.997 R2 = 0.997 0 0.1 0.2 0td (s)
120 240P
ea
k
he
ig
ht
(nA
)
Mn
Pb
Fig. 8 Voltammogram obtainedat 0.5-cm depth in a sediment sampled just upstream from the former Metaleurop smelter plant (DPASV, deposition time 240 s). Inset: variation of Pb2+ (dia-monds) and Mn2+(×) peak heights, measured by DPASV, as a function of the deposition time (60, 120 and 240 s)
microelectrode, a preliminary study was carried out in a sediment. For that purpose a sediment core was sampled in the Deûle Canal, just upstream from the former Metaleurop smelter plant. About 3 cm of the overlaying water was also kept to avoid any disturbance at the interface. Reference electrode and counter electrode were introduced directly into the water and the 25-μm gold-disk microelectrode was carefully introduced into the sediment using a microma-nipulator. Since oxygen is consumed in the first 2 mm under the sediment–water interface (personal data, not shown here, obtained with an O2 microsensor, Unisense)
due to bacterial activities, deployment of the gold microelectrode does not suffer from broad oxygen reduc-tion waves at deeper depths. Figure 8 displays a typical voltammogram in the sediment for a deposition time of 240 s. The presence of Mn2+, probably associated with inorganic ligand [30], is bound to the reduction of manganese hydroxides(III/IV) by the bacterial activity, which consumes these species as electron acceptors for the degradation of organic matter. The presence of lead at high concentration level (10μg L−1) was also detected using this microelectrode. Metaleurop, a former Zn and Pb smelting plant, had indeed dramatically polluted this zone: lead is present up to 1% in the sediment, just in front of the discharge banks [37].
Concentrations of manganese (175±10μg L−1) and lead (18±2μg L−1) were estimated by using ex situ calibration curves carried out in the river water medium. However, under these conditions, the calculation of the true concen-tration, assuming first of all that the oxidation peak is bound to the studied metal, remains a complex problem. To partly solve such difficulties, several voltammograms have been recorded in the sediment by varying the deposition time (Fig.8, inset). This experiment at least allows one to check if the peaks height is a linear function of the deposition time. Sediment is a non-well-defined system made of particles and water, in which adsorption of organic compounds, minerals colloids and clusters (as for instance FeS) at the surface of the electrode may lead to a non-defined current or, even worse, a blocking of the electrode might occur. This experiment has pointed out that the redissolution peaks at−0.9 Vand −0.17 V can be attributed to manganese and lead species, respectively. But it also appears that the peak detected at−0.55 V is not a sure proof of the presence of labile zinc in the porewater.
Conclusion
Homemade bare gold-disk microelectrodes of 25-μm and 125-μm diameter have successfully replaced mercury and mercury-coated electrodes in adapted voltammetric proce-dures for trace metals analysis in polluted natural waters. Calibration curves were performed in seawater and in river water samples, the SWASV method being more appro-priate for seawater matrix and DPASV for river water. Compared with a mercury electrode, the oxidation peak potentials of Mn, Zn, Pb, Cd, Cu and Hg are shifted to more positive values, having analytical linearity range from
0.2μg L−1to 20μg L−1and from 1μg L−1to 200μg L−1 for the 25-μm and 125-μm electrode, respectively, depending on the analysed metal. The electrode sensitivity varied from 0.23 to 4.75 nA L μmol−1, and from 1.48 to 58.53 nA Lμmol−1for the 25-μm and 125-μm electrode, respectively, depending on the analysed metal and should be determined in any significantly different sample matrix. When compared with the same electrode coated with mercury, this bare gold-disk surface appears to be more sensitive.
The electrodes were successfully applied in an on-site monitoring system to determine and follow the labile concentrations of Cu, Pb and Zn in polluted river water. Due to the drawback of its high sensibility to oxygen, this electrode should be appropriate for in situ measurements in anoxic conditions like those found in sediments, as proved by the preliminary study undertaken in the sediments of the Deûle River (France).
The sensitivity improvement implies that such electrodes could be applied for detection of natural concentrations of trace elements; the unexpected findings like Zn double peak and more negative peak positions in river water than in seawater, are the subject of future investigations of such bare metal electrodes. Repeated field measurements and larger result databases should give the expected evidence of the biological activity in the measured natural and polluted waters and porewaters.
Acknowledgements This work was supported by the Region Nord Pas-de-Calais [Stardust (INTERREG III)], the national PNETOX program and the European Community (FEDER) as well as by COGITO, Program of Integrated actions by ÉGIDE. We are very grateful to Jean-François Barthe for his technical support during the sampling and the monitoring, as well as for the ICP-MS measure-ments. We thank anonymous referees for their valuable suggestions.
References
1. Wang J, Zadeii JM (1988) J Electroanal Chem 246:297 2. Wang J, Larson D, Foster N, Armalis S, Lu J, Rongrong X,
Olsen K, Zirino A (1995) Anal Chem 67:1481 3. Wang J, Tian B (1993) Electroanal 5:809
4. Wang J, Foster N, Armalis S, Larson D, Zirino A, Olsen K (1995) Anal Chim Acta 310:223
5. Brendel PJ, Luther GW III (1995) Environ Sci Technol 29:751 6. Cai WJ, Zhao P, Theberge SM, Witter A, Wang Y, Luther GW III (2002) In: Rozan MTTF (ed) Environmental electrochem-istry: analyses of trace element biogeochemistry. ACS Sympo-sium Series 811, American Chemical Society
7. Glazer BT, Cary SC, Hauhmann L, Luther GW III (2002) In: Rozan MTTF (ed) Environmental electrochemistry: analyses of trace element biogeochemistry. ACS Symposium Series 811, American Chemical Society
8. Luther GW III, Brendel JP, Lewis BL, Sunby B, Lefrançois L, Silverberg N, Nuzzio DB (1998) Limnol Ocean 43:325 9. Luther GW III, Reimers CE, Nuzzio DB, Lovalvo D (1999)
Environ Sci Technol 33:4352
10. Pižeta I, Billon G, Fischer J-C, Wartel M (2003) Electroanal 15:1389
11. Belmont-Hébert C, Tercier ML, Buffle J, Fiaccabrino GC, de-Rooij NF, Koudelka-Hep M (1998) Anal Chem 70:2949 12. J Buffle J, Tercier-Waeber ML (2005) Trends Anal Chem
13. Tercier ML, Parthasarathy N, Buffle J (1995) Electroanal 7:55 14. Tercier-Waeber ML, Buffle J, Confalonieri J, Riccardi G, Sina A, Graziottin F, Fiaccabrino GC, Koudelka-Hep M (1999) Meas Sci Technol 10:1202
15. Tercier-Waeber ML, Buffle J, Koudelka-Hep M, Graziottin F (2002) In: Rozan MTTF (ed) Environmental electrochemistry: analyses of trace element biogeochemistry. ACS Symposium Series 811, American Chemical Society
16. Pižeta I, Billon G, Omanović D, Cuculić V, Garnier C, Fischer J-C (2005) Anal Chim Acta 551:65
17. Huiliang H, Jagner D, Renman L (1987) Anal Chim Acta 202:117
18. Riso RD, Waeles M, Monbet P, Chaumery CJ (2000) Anal Chim Acta 410:97
19. Mikkelsen Ø, Schroder KN (2003) Electroanal 15:679 20. Mikkelsen Ø, Skogvold SM, Schrøder KH, Gjerde MI,
Aarhaug TA (2003) Anal Bioanal Chem 377:322
21. Skogvold SM, Mikkelsen Ø, Schrøder KH (2005) Electroanal 17:1938
22. Brand M, Eshkenazi I, Kirowa-Eisner E (1997) Anal Chem 69:4660
23. Bonfil Y, Brand M, Kirowa-Eisner E (1999) Anal Chim Acta 387:85
24. Kirowa-Eisner E, Brand M, Tzur D (1999) Anal Chim Acta 385:325
25. Bonfil Y, Brand M, Kirowa-Eisner E (2000) Anal Chim Acta 424:65
26. Bonfil Y, Kirowa-Eisner E (2002) Anal Chim Acta 457:285 27. Bonfil Y, Brand M, Kirowa-Eisner E (2002) Anal Chim Acta
464:99
28. Herzog G, Arrigan DWM (2005) Trends Anal Chem 24:208 29. Nyholm L, Wikmark G (1992) Anal Chim Acta 257:7 30. Billon G, van den Berg CMG (2004) Electroanal 16:1583 31. Buffle J (1988) Analytical chemistry. Ellis Horwood 32. Ružić I (1977) J Electroanal Chem 75:25
33. Garnier C, Pižeta I, Mounier S, Benaïm JY, Branica M (2004) Anal Chim Acta 505:263
34. Lovrić M, Scholz F (1997) Electroanalysis 9:1189
35. Bard AJ, Faulkner LR (2001) Electrochemical methods, fundamentals and applications, Wiley-VCH
36. Vdović N, Billon G, Gabelle C, Potdevin J-L (2005) Environ Pol 141:359
37. Ouddane B, Abbasse G, Halwani J, Fischer JC (2004) J Environ Monitor 6:1–12
![Table 2 Results of the 25-μm gold-disk microelectrode calibrations for Mn 2+ , Zn 2+ , Pb 2+ , Cd 2+ and Cu 2+ in seawater sample applying SWASV (all the potential values are given versus the Ag/AgCl, [KCl]=3 mol L −1 reference electrode)](https://thumb-eu.123doks.com/thumbv2/123doknet/14618426.733407/5.892.72.818.938.1079/results-microelectrode-calibrations-seawater-applying-potential-reference-electrode.webp)