HAL Id: hal-01637126
https://hal.archives-ouvertes.fr/hal-01637126
Submitted on 17 Nov 2017HAL is a multi-disciplinary open access archive for the deposit and dissemination of sci-entific research documents, whether they are pub-lished or not. The documents may come from teaching and research institutions in France or abroad, or from public or private research centers.
L’archive ouverte pluridisciplinaire HAL, est destinée au dépôt et à la diffusion de documents scientifiques de niveau recherche, publiés ou non, émanant des établissements d’enseignement et de recherche français ou étrangers, des laboratoires publics ou privés.
Dynamical microstructure formation in 3D directional
solidification of transparent model alloys: in situ
characterization in DECLIC Directional Solidification
Insert under diffusion transport in microgravity
N. Bergeon, Fatima L. Mota, L Chen, D. Tourret, J M Debierre, R. Guerin,
A. Karma, B. Billia, R Trivedi
To cite this version:
N. Bergeon, Fatima L. Mota, L Chen, D. Tourret, J M Debierre, et al.. Dynamical microstructure formation in 3D directional solidification of transparent model alloys: in situ characterization in DECLIC Directional Solidification Insert under diffusion transport in microgravity. IOP Conference Series: Materials Science and Engineering, IOP Publishing, 2015, 84, pp.012077. �10.1088/1757-899X/84/1/012077�. �hal-01637126�
This content has been downloaded from IOPscience. Please scroll down to see the full text.
Download details:
IP Address: 147.94.134.1
This content was downloaded on 17/06/2015 at 06:56
Please note that terms and conditions apply.
microgravity
View the table of contents for this issue, or go to the journal homepage for more 2015 IOP Conf. Ser.: Mater. Sci. Eng. 84 012077
Dynamical microstructure formation in 3D directional
solidification
of
transparent
model
alloys:
in
situ
characterization in DECLIC Directional Solidification Insert
under diffusion transport in microgravity
N Bergeon1, F L Mota1, L Chen1, D Tourret2, J M Debierre1, R Guérin1, A Karma2, B
Billia1, and R Trivedi3.
1IM2NP, Aix-Marseille Université, CNRS UMR 7334, Marseille, France 2Physics Department, Northeastern University, Boston, USA,
3Department of Materials Science & Engineering, Iowa State University, USA Email : [email protected]
Abstract : To clarify and characterize the fundamental physical mechanisms active in the
dynamical formation of three-dimensional (3D) arrays of cells and dendrites under diffusive growth conditions, in situ monitoring of series of experiments on transparent model alloy succinonitrile – 0.24 wt% camphor was carried out under low gravity in the DECLIC Directional Solidification Insert on-board the International Space Station. These experiments offered the very unique opportunity to in situ observe and characterize the whole development of the microstructure in extended 3D patterns. The experimental methods will be first briefly described, including in particular the observation modes and the image analysis procedures developed to quantitatively characterize the patterns. Microgravity environment provided the conditions to get quantitative benchmark data: homogeneous patterns corresponding to homogeneous values of control parameters along the whole interface were obtained. The sequence of microstructure formation will be presented as well as the evolution of the primary spacing which is one of the most important pattern characteristic. Time evolution of this primary spacing during the microstructure development will be analysed to identify the mechanisms of spacing selection and adjustment; the importance of the macroscopic interfacial curvature will be pointed out.
1. Introduction
The study of solidification microstructure formation and selection is very important in the engineering and processing of advanced new materials [1]. The interface patterns formed by solidification largely govern mechanical and physical properties of materials. The two most typical microstructures are cells and dendrites, and their characteristics profoundly influence the properties of a wide range of commercial metallic alloys. The correlation between microstructure and processing conditions can be best examined by directional solidification experiments in which all parameters can be accurately and independently controlled.
The evolution of the spatial pattern of cells or dendrites occurs under dynamic conditions of growth in which the forming pattern reorganizes into a rather periodic array so that in situ and real time observation of the solid-liquid interface is a precious tool to get a detailed knowledge of the entire time-evolution of
MCWASP IOP Publishing
IOP Conf. Series: Materials Science and Engineering 84 (2015) 012077 doi:10.1088/1757-899X/84/1/012077
Content from this work may be used under the terms of theCreative Commons Attribution 3.0 licence. Any further distribution of this work must maintain attribution to the author(s) and the title of the work, journal citation and DOI.
the interface pattern. This explains the extensive use of transparent organic analogs that behave like metallic alloys regarding solidification but are transparent to visible light so that classical optical techniques are sufficient for their observation [2].
A major impediment in the study of three-dimensional pattern evolution in ground-based experiments is the strong influence of convection on cellular and dendritic patterns. Extensive ground-based studies carried out in metallic and organic bulk samples have clearly established that fluid flow modifies the structure of the solute boundary layer that influences the pattern development [3,4]. Directional solidification experiments under low gravity conditions provide a unique setting to investigate microstructure development in spatially extended sample geometries with negligible convection and under well-controlled conditions of growth rate, temperature gradient and alloy composition. Consequently, those experiments provide unique benchmark data to validate the predictions of theoretical and computational models in a purely diffusive growth regime. The study presented here was thus conducted using the Directional Solidification Insert (DSI) dedicated to in situ and real time characterization of the dynamical selection of the solid-liquid interface morphology in bulk samples of transparent materials, which was developed by the French Space Agency (CNES) in the frame of the DECLIC project (Dispositif pour l'Etude de la Croissance et des LIquides Critiques). The DECLIC facility of CNES was launched with 17-A shuttle flight (August 2009) as part of a joint NASA/CNES research program and is installed on the International Space Station in microgravity environment. The main instrument monitoring is performed from the CADMOS center, the French User Support and Operation Centre (USOC) in Toulouse. Taking advantage of provided tele-science capabilities, scientists have the possibility to follow in near real-time conditions and to remotely control experiments. The commissioning of the DSI was realized in December 2009 and six runs of two to three weeks each were performed from April 2010 to April 2011. The DSI was then brought back on ground and two runs of two weeks have been performed at the CNES center with similar control parameters than experiments in µg so that convection influence could be addressed.
After a brief description of the experimental procedure and methods of analysis of images, results will be described and discussed in terms of pattern formation and evolution.
2. Experimental procedure
The DECLIC-DSI insert mainly contains 2 elements: the Bridgman furnace and the experimental cartridge. Complete descriptions of DECLIC and its inserts can be found in [5-6].
The experimental cartridge includes the quartz crucible and a system of volume compensation made of stainless steel that is useful to accommodate the specimen volume variations associated to phase changes. The cylindrical crucible has an inner diameter of ten millimeters and a length that enables about ten centimeters solidification, thus allowing the study of the whole development of extended 3D patterns from the initial stage to the steady state. The crucible is equipped with a flat glass window at the bottom and a lens immersed in the melt at the top. The main observation mode (Axial observation) takes advantage of the complete axial transparency of the cartridge provided by these last two elements: the light coming from LEDs passes through the cartridge from the bottom to the top, therefore crossing the interface. The optical imaging system formed by the immersed lens and a following relay lens forms the image of the interface on a CCD camera. On the same cartridge axis, an interferometer is also set but it will not be detailed here (more information on its use can be found in [7]). The interface can also be observed from the side (Transverse observation).
In this study, we used a Succinonitrile (SCN) – 0.24 wt% Camphor alloy. In order to fill the crucible, SCN purified by NASA by both distillation and zone melting was used. The alloy was then prepared by adding the solute. All procedures for sample preparation were carefully realized under vacuum to avoid humidity contamination. Once sealed, the cartridge was inserted inside the Bridgman furnace.
A thermal gradient ranging from 10 to 30 K.cm−1 is imposed by regulated hot and cold zones,
respectively, located above and below the adiabatic area where the interface is positioned. Upward solidification is achieved by pulling the crucible down into the cold zone of the furnace at a rate ranging from 0.1 to 30 µm/s. For a defined alloy concentration, varying the thermal gradient or more conveniently, the pulling rate, leads to the development of various interface morphologies, ranging from planar front (high gradient – low pulling rate) to cellular and finally dendritic pattern (low gradient – high pulling rate). In the experiments detailed here, the thermal gradient is set to 19 K/cm and pulling velocities range from 0.5 to 12 µm/s.
3.Analysis methods
In situ and continuous observation leads to a huge amount of images so that adequate and as systematic as possible procedures had to be developed and validated to extract relevant quantitative data. Quantitative characterization of the patterns consists in measuring the evolution, as a function of time and growth parameters, of the parameters that describe the interface morphology, such as the primary spacing, order/disorder level of pattern, 3D-shape and the tip radius. Concerning shape of structures and tip radius, measurements are based on interferometric analysis that is not described here. For more information on shape reconstruction by interferometric analysis in DECLIC-DSI, one may refer to Bergeon et al. [7].
Image treatment and analysis procedures have been developed on Visilog® Image Analysis Software (Noesis, France) to facilitate exploitation of results. The first step is to obtain a binary image that is then used as an input for specific procedures dedicated to the determination of the primary spacing distribution and the characterization of the pattern order/disorder and type (Minimal Spanning Tree analysis [8,9] and number of first neighbors [9]). A more detailed description of these procedures is given in [9]. In this article, analyses are limited to characterization of primary spacing evolution. Primary spacing can be considered as the centre to centre distance between two neighboring cells. Its determination requires beforehand cell detection and identification. Each cell center is then determined together with the identification of the first neighbors so that center to center distances can be calculated. The spacing histogram is then drawn to determine the average spacing and the standard deviation, the minimal and maximal limits.
4. Results
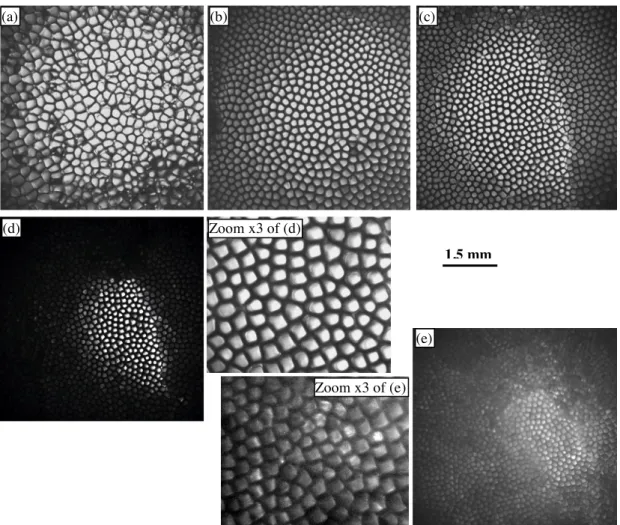
Figure 1 illustrates the microstructures obtained for pulling rates ranging from 0.5 µm/s to 12 µm/s. In all cases, the pictures correspond to the interface microstructure after about 40 mm of growth. The microstructure is cellular with large spacing at low pulling rate, for example at 0.5 µm/s (figure 1(a)) or 2 µm/s (figure1(b)) and the deep cells observed at 4 µm/s (figure 1(c)) become dendritic (sharpening of the tips, anisotropy of the tip shape) at 8 µm/s as observed on the zooms of figure 1(d) and 1(e). The spacing decreases when the pulling rate increases and this decrease is faster at low pulling rates.
The initial stages of microstructure formation are similar regardless the pulling rate. They are here described on the basis of the experiment at VP = 4 µm/s. The starting interface corresponds to VP = 0
(figure 2(a)). After triggering of the pulling, morphological instability initiates by forming linear ridges along sub-boundaries that finally underline a rather complex array (figure2(b)). Between these defects, in interface areas that are still smooth, some poxes may be present: they can be described as circular undulations of the interface. Ridges underlining sub-grain boundaries progressively emit new ridges in their transverse direction and simultaneously, a uniform corrugation that corresponds to the initial visible wavelength of morphological instability invades the interface (figure 2(c)). The amplitude of all these interface modulations starts to increase, channels are forming but it is still difficult to identify cells (figure 2(d)). At this stage, the interface dynamics is extremely fast and pattern disorder high. There is then a
MCWASP IOP Publishing
IOP Conf. Series: Materials Science and Engineering 84 (2015) 012077 doi:10.1088/1757-899X/84/1/012077
progressive decrease of disorder and a clear pattern of cells eventually emerges (fig. 2(e)). The dynamics then slows down and is limited to progressive size adjustment and array ordering (figure 2(f)).
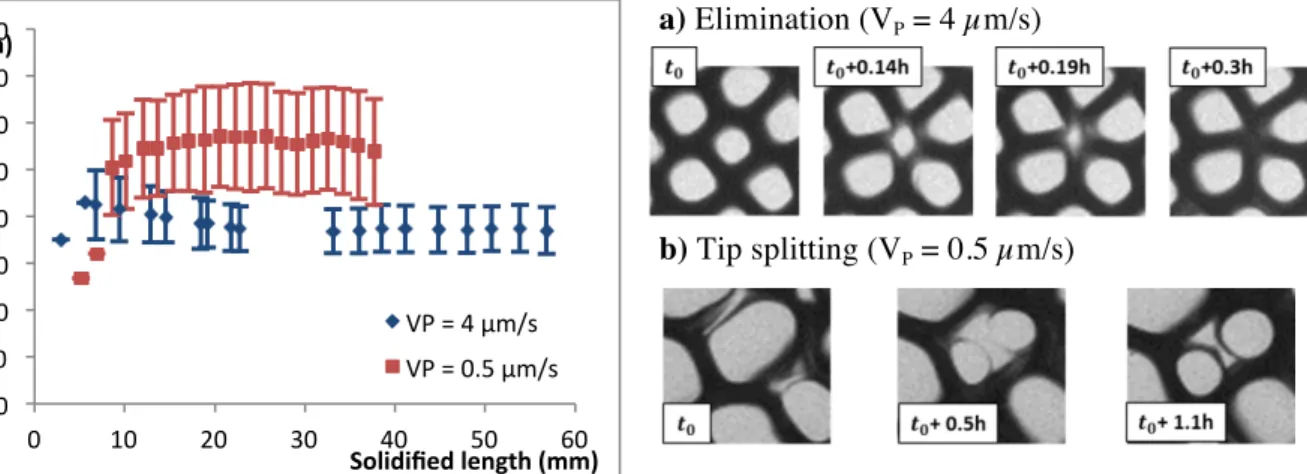
The evolution of spacing was measured as a function of time for each pulling rate. Two examples of such data are given in figure 3 with the spacing variation as a function of solidified length (namely the “pulling length” = VPxt), for VP = 0.5 µm/s and VP = 4 µm/s. At the very beginning of microstructure
formation, it is not possible to determine the spacing with center-to-center methods as microstructure does not form distinct cells (images 2(c) and 2(d) for example). Therefore the three first measurements are performed using a FFT (Fast Fourier Transform) based method. At low pulling velocity (for example 0.5 µm/s), the spacing progressively increases to reach its steady-state value. At higher velocity (for example 4 µm/s), the spacing displays an overgrowth of cells at the beginning of solidification before a slow decrease to reach a steady-state value; this dynamics is consistent with previous observations on thin samples of succinonitrile-based alloys, for example by Seetharaman et al. [10].
Fig. 1: Examples of interface microstructure after ~ 40 mm of growth for different pulling rates
(a) VP = 0.5 µm/s (b) VP = 2 µm/s (c) VP = 4 µm/s (d) VP = 8 µm/s (e) VP = 12 µm/s (SCN – 0.24 wt% camphor ; G = 19 K/cm) (a) (e) (d) (c) (b) Zoom x3 of (d) Zoom x3 of (e) 1.5 mm 4
Fig. 2: Microstructure formation and evolution for VP = 4 µm/s (SCN - 0.24 wt% Camphor, G = 19 K/cm)
Classically, two mechanisms are considered that adjust the spacing. To increase the spacing, smallest cells slightly slow down and are finally eliminated by overgrowth by their neighbours so that the number of cells decreases: “elimination” in fig. 4a. To decrease the spacing, the largest cells split into two daughter cells so that the number of cells increases: “tip-splitting” in fig. 4b. Even if these two mechanisms have been observed in our experiments, detailed analyses revealed that their occurrence is not spatially homogeneous and additional phenomena have to be taken into account. Let us focus for example on the pulling velocities 0.5 and 4 µm/s.
a) Elimination (VP = 4 µm/s)
b) Tip splitting (VP = 0.5 µm/s)
Fig. 3: Primary spacing evolution as a function of the
solidified length for VP = 4 µm/s and VP = 0.5 µm/s
(SCN - 0.24 wt% Camphor, G = 19 K/cm)
Fig. 4: Mechanisms of spacing adjustment
(SCN - 0.24 wt% Camphor, G = 19 K/cm) 0 50 100 150 200 250 300 350 400 0 10 20 30 40 50 60 ! (µm) Solidified length (mm) VP = 4 µm/s VP = 0.5 µm/s a) VP = 0, t=0 b) VP = 4 µm/s
t=7.5 min Enlarged area of b) x4.5 Poxes c) VP = 4 µm/s t=8.7 min Zoom x 4.5 d) VP = 4 µm/s t=11.5 min e) VP = 4 µm/s t=23.6 min f) VP = 4 µm/s t=100.0 min 2 mm
MCWASP IOP Publishing
IOP Conf. Series: Materials Science and Engineering 84 (2015) 012077 doi:10.1088/1757-899X/84/1/012077
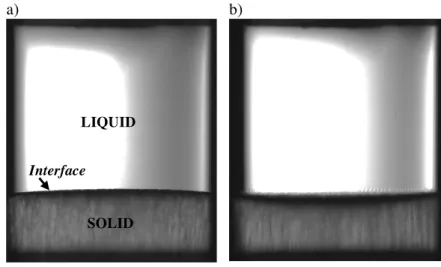
For VP = 0.5 µm/s, the interface is macroscopically convex (fig. 5a). This curvature induces a glide of
cells along the interface slope from the center towards the border, as for example observed in thin samples by Bottin-Rousseau et al. [11] for experiments with curvature purposely induced. During this gliding, cell size increases so that cells eventually split and the number of cells increases; inversely, the gliding drives the cells towards the border where they disappear and the number of cells decreases. The average steady-state spacing results from the permanent balance between these two phenomena. Homogeneous elimination is not the process for spacing adjustment whereas the spacing increases to reach its steady-state value.
For VP =4 µm/s, the interface is macroscopically concave (fig. 5b). This curvature induces a glide of
cells along the interface slope from the border towards the centre. As it was previously described by Weiss et al. [12] for ground experiments in the same cylindrical geometry, cells are then generated at the border (“source”). During their gliding, their size tends to decrease so that elimination process occurs. In our case, it appeared that even if the gliding is mainly radial, elimination mainly occurs along sub-boundaries that are present in this experiment. The average steady-state spacing results from the permanent balance between the source of cells at the border and the sink along the sub-boundaries. Homogeneous tip-splitting is not the process for spacing adjustment whereas the spacing decreases to reach its steady-state value.
Fig. 5: Side view of the stationary
interface for a) VP = 0.5 µm/s and
b) VP = 4 µm/s
(SCN - 0.24 wt% Camphor, G = 19 K/cm)
a) b)
5. Conclusion
In this article, we presented some results obtained in microgravity using the Directional Solidification Insert of the DECLIC facility on board ISS. The quality of the experimental system that provides very clear images of the interfacial microstructure during its whole evolution has been demonstrated. Microgravity environment provided the conditions to get quantitative benchmark data: homogeneous patterns corresponding to homogeneous values of control parameters along the whole interface were obtained. Long solidifications have been performed to get the whole dynamics and mechanisms of microstructure formation or change, spacing adjustment, pattern ordering. The analyses of mechanisms of spacing adjustment reveal a critical influence of the macroscopic interfacial curvature that induces pattern gliding. The dynamical coupling between the evolution of the macroscopic curvature of the front and the spacing adjustment has been shown theoretically to have an important effect on the stability limit of both cellular [13] and eutectic [14] patterns formed during directional solidification. However, how this coupling affects spacing selection in a situation where the front curvature is maintained by a radial component of the temperature gradient remains poorly understood theoretically. Phase-field simulations of the present experiments that address this question are currently underway.
LIQUID
SOLID
Interface
Acknowledgments
The authors express their gratitude to CNES (Centre National d’Etudes Spatiales) and NASA (National Aeronautics and Space Administration) for the support received in the scientific projects MISOL3D (Microstructures de SOLidification 3D) and DSIP (Dynamical Selection of Interface Patterns). A.K. and D.T. were supported by NASA awards NNX07AK69G and NNX11AC09G.
References
[1] Billia B and Fecht HJ 2001 A World without Gravity – Research in Space for Health and Industrial Processes Ed. Fitton B, Battrick B (ESA SP 1251, European Space Agency, Noordwijk)
[2] Billia B and Trivedi R (1993) Handbook of crystal growth vol 1B Ed Hurle DTJ (North-Holland) [3] Jamgotchian H, Bergeon N, Benielli D, Voge P, Billia B and Guérin R 2001 Phys. Rev. Lett. 87
166105
[4] Schenk T, Nguyen Thi H, Gastaldi J, Reinhart G, Cristiglio V, Mangelinck-Noël N, Klein H, Härtwig J, Grushko B, Billia B and Baruchel J 2005 J. Crystal Growth 275 201
[5] Marcout R, Raymond G, Martin B, Cambon G, Zappoli B, Duclos F, Barde S, Beysens D, Garrabos Y, Lecoutre C, Billia B, Bergeon N and Mangelinck N "DECLIC: a facility to investigate fluids and transparent materials in microgravity conditions in ISS" Proc. of the 57th International Astronautical Congress (2–6 Oct, 2006 ,Valencia, Spain).
[6] Pont G, Barde S, Zappoli B, Duclos F, Garrabos Y, Lecoutre C, Beysens D, Billia B, Bergeon N, Mangelinck-Noël N, Marcout R and Blonde D "DECLIC: a facility to study crystallization and critical fluids" Proc. Of the 60th International Astronautical Congress (12–16 Oct, 2009 , Daejeon, Republic of Korea).
[7] Bergeon N, Weiss C, Mangelinck-Noël N and Billia B 2009 Trans. Indian Inst. of Met. 62 455 [8] Dussert C, Rasigni G, Rasigni M, Palmari J, Llebaria A. 1986 Phys. Rev. B 34 3528
[9] Bergeon N, Ramirez A, Chen L, Billia B, Gu J and Trivedi R 2011 J. Mater. Sci. 46 6191 [10] Seetharaman V, Eshelman MA and Trivedi R 1988 Acta Metall. 36 1175
[11] Bottin-Rousseau S and Pocheau A 2001 Phys. Rev. Lett. 87 076101
[12] Weiss C, Bergeon N, Mangelinck-Noël N and Billia B 2009 Phys. Rev. E 79 011605 [13] Karma A and Pelce P 1990, Phys. Rev. A 41 6741
[14] Akamatsu S, Plapp M, Faivre G and Karma A, Phys. Rev. E 66 030501
MCWASP IOP Publishing
IOP Conf. Series: Materials Science and Engineering 84 (2015) 012077 doi:10.1088/1757-899X/84/1/012077