UNIVERSITÉ DU QUÉBEC
MÉMOIRE PRÉSENTÉ À
L'UNIVERSITÉ DU QUÉBEC À TROIS-RIVIÈRES
COMME EXIGENCE PARTIELLE
DE LA MAITRISE EN SCIENCES DE L'ÉNERGIE ET DES MATÉRIAUX
PAR
ARULSAMY MERL y XAVIER
FLUIDIZED BED REACTOR FOR THE PRODUCTION OF HYDROGEN FROM BIOMASS BY AQUEOUS ALKALINE REFORMING
Université du Québec à Trois-Rivières
Service de la bibliothèque
Avertissement
L’auteur de ce mémoire ou de cette thèse a autorisé l’Université du Québec
à Trois-Rivières à diffuser, à des fins non lucratives, une copie de son
mémoire ou de sa thèse.
Cette diffusion n’entraîne pas une renonciation de la part de l’auteur à ses
droits de propriété intellectuelle, incluant le droit d’auteur, sur ce mémoire
ou cette thèse. Notamment, la reproduction ou la publication de la totalité
ou d’une partie importante de ce mémoire ou de cette thèse requiert son
autorisation.
Résumé
Le refonnage alcalin et aqueux (AAR-aqueous alkaline reforming) est une technologie prometteuse pour la production d'hydrogène pur à partir de biomasse et sans émission de gaz carboniques. L'avantage principal de ce procédé est que, théoriquement, tout le carbone compris dans la biomasse est converti en carbonate de sodium (Na2C03) qui a une certaine valeur commerciale. Le principe du procédé est essentiellement de recombiner la teneur en carbone de la biomasse via une réaction chimique pour fonner des carbonates et donc de libérer l'hydrogène dans a fonne pure. L'hydrogène produit est pur à 95+ % et peut être utilisé directement dans certaines applications. La teneur en humidité de la biomasse ne modifie pas le procédé puisque de l'eau est nécessaire pendant le processus de conversion, évitant ainsi le besoin de sécher la biomasse. La réaction chimique décrivant ce procédé est:
(Ni)
(C6HIOOS) n + 12n NaOH + n H20 --> 6n Na2C03 + 12n H20. Cette réaction est optimum à des températures entre 300 et 350 oC.
Ce mémoire porte sur la conception d'un réacteur à lit fluidisé (FBR-fluidized bed reactor) et d'un banc d'essai pour produire de l'hydrogène de manière continue via le procédé d'AAR. Le banc d'essai comprend entre autres le FBR, un condenseur, un séparateur cyclonique, une pompe à recirculation et un contrôleur de débit. L'objectif du projet est d'accroitre la production d'hydrogène en expérimentant le FBR en mode de recirculation des gaz. La production d'hydrogène via l'AAR a déjà été étudiée dans un réacteur en mode continu. Contrairement au mode continu, la production d'hydrogène dans un FBR en recirculation ne subira pas d'augmentation drastique de pression. Les problèmes encourus du procédé AAR en mode continu ont été identifiés et discutés. Le catalyseur utilisé pour l'AAR
a été produit expérimentalement en utilisant un procédé d'imprégnation de nitrate de nickel sur des billes d'alumine.
Le Chapitre 1 met en perspective le potentiel de la biomasse pour remplacer les carburants fossiles et contribuer de façon significative à l'atténuation de la pollution atmosphérique. Les éléments du banc d'essai pour le procédé d'AAR en mode continu sont introduits, soit:
~ Le réacteur à lit fluidisé (FBR) : Endroit où la cellulose subit le procédé d'AAR. ~ Condenseur: Échangeur de chaleur pour condenser la vapeur qui s'échappe du FBR. ~ Séparateur cyclonique : Retient les particules solides dans le flux du gaz en
circulation.
~ Contrôleur de débit massique Sert à monitorer et contrôler le débit du gaz en circulation.
~ Pompe: Compatible avec l'hydrogène et recircule le gaz dans le banc d'essai.
La conception et les caractéristiques du FBR et du séparateur cyclonique ainsi que les paramètres importants pour obtenir la fluidisation sont discutés aux Chapitres 2 et 3. Le Chapitre 4 décrit le montage expérimental (banc d'essai), le Chapitre 5 les résultats expérimentaux et la discussion, et le Chapitre 6 est la conclusion et des suggestions sur les travaux futurs.
Plusieurs problèmes ont été identifiés et des pistes de solutions ont été explorées. Nous n'avons pas réussi à obtenir une fluidisation efficace dans le FBR. Nous sommes arrivés à la conclusion que la recirculation du gaz dans le FBR n'est pas adéquate pour le procédé d'AAR.
Abstract
Aqueous alkaline reforming (AAR) is a promising technology for the production of pure
hydrogen from biomass with zero emissions of carbon gases. The principal advantage of this
process is that theoretically, all the carbon in the biomass is converted into sodium carbonate
(Na2C03), a product of commercial value. A fluidized bed reactor (FBR) was designed and
fabricated for this system. The whole system comprising of the FBR, condenser, cyclone
separator, mass flow controller was designed and the system was assembled. The objective is
to increase the production of hydrogen by conducting the experiment in a circulating
fluidized bed. The experiment was previously demonstrated in batch scale. ln order to
increase the production of hydrogen, the experiment will be continued in a fluidized bed
reactor. Unlike batch scale; there will be no pressure buildup in the system. The issues
related to aqueous alkaline refonning in continuous phase is identified and discussed. The
catalyst used for the reforming technology was produced experimentally in the lab by
incorporating the process of impregnation of nickel nitrate on alumina balls.
Ackn
owledgement
l would like to thank the almighty for guiding me each and every day in my journey to complete my masters. l would like to express my deep appreciation and gratitude to the following people for their help and support. 1 have been indebted in the preparation of this thesis to my supervisor, Dr. Jean Hamelin who gave me the opportunity to be part of this fascinating project and whose encouragement and guidance enabled me to become a better engineer. Furthermore, his ongoing care during my time of need will forever be appreciated. 1 would express my sincere gratitude to Sadesh Kumar Natarajan who provided the initial guidance for my research career. 1 would Iike to thank Robert Drolet and Daniel Cossement for their contribution in building the system. My sincere gratitude goes to Renju Zacharia for his technical guidance and knowledgeable suggestions during critical times. 1 express my sincere thanks to my colleague Can Tao for her wonderful co-operation and suggestions during the course of the project. 1 ex tend my thanks to my colleague Siyad Ubaid, Francis Lafontaine and Marie-Ève for their constant encouragement and support. 1 would also like to thank the members of the hydrogen research institute for their invaluable help and guidance. 1 would be etemally thankful to my family for their everlasting care, support and encouragement. The financial assistance from BioFuelNet Canada to Prof. Jean Hamelin was gratefullyacknowledged.
Contents
Résulné ... iii Abstract ... v Acknowledgement ... vi List of Figures ... ix List of tables ... x Chapter 1: Introduction ... 1Chapter 2: Literature Review ... 5
2.1 Biomass ... 5
2.2 Aqueous alkaline reforming-Cellulose degradation ... 6
2.3 Hydrogen production by aqueous alkaline refonning ... 8
2.4 Fluidization ... 9
2.5 Factors affecting fluidisation ... 10
2.5.1 Minimum fluidization velocity ... 10
2.5.2 Pressure drop ... 10
2.5.3 Bed expansion ratio (R) ... 10
2.5.4 Bed fluctuation ratio (r) ... Il 2.5.5 Fluidization quality (FQ) ... Il 2.6 Fluidized bed reactor.. ... Il 2.6.1 Applications ... 13
2.6.2 Advantages ... 13
2.7 Fluidization vessel ... 14
2.8 Descriptive behavior of a fluidized bed: The model of Kunii and Levenspiel ... 14
2.8.1 Distributors ... 15
2.8.2 Freeboard ... 16
2.9 Cyclone separator ... 16
2.9.1 Benefits of cyclone separators ... 16
2.9.2 Working ... 17
2.9.3 Control of Size distribution ... 17
Chapter 3: Design of fluidized bed reactor system ... 18
3.1 Fluidized bed reactor ... 18
3.2 Distribution plate ... 19
3.2.1 Design highlights ... 20
3.3 Cyclone separator (Physical model) ... 23
3.4 Condenser ... 26 3.5. Catalysts ... 26 Chapter 4: Experiment ... 28 4.1 Experimental Set-up ... 29 4.2 Instrumental Set-up ... 30 4.3 Experiment ... 31
Chapter 5: Result and Discussion ... 34
Chapter 6: Conclusion and future work ... 41
6.1 Conclusion ... 41
6.2 Future work ... 42
References ... 43
List of Figures
Figure 1.1: Production of cellulosic biofuel vs other biofuel ... 2
Figure 2.1: Cellulose degradation ... 8
Figure 2.2: Various kinds of contacting of a batch of solids by fluid ... 13
Figure 2.3: Fluidization vessel ... 16
Figure 3.1: Fluidized bed reactor ... 19
Figure 3.2: Sieve used as distribution plate ... 21
Figure 3.3: Typical curve for Reynolds number vs discharge coefficient ... 24
Figure 3.4: Schematics of the cyclone ... 25
Figure 3.5: Cyclone separator ... 26
Figure 3.6: Alumina balls before impregnation ... 28
Figure 3.7: Nickel supported alumina balls ... 28
Figure 4.1: Schematic view of experimental setup ... 30
Figure 4.2: Block diagram ... .31
Figure 4.3: Front panel ... 32
Figure 4.4: Experiment setup ... .33
Figure 5.1: Gas chromatograph ... 37
Figure 5.2: Gas chromatography analysis data ... 37
Figure 5.3: Change in temperature with time ... 38 Figure 5.4: Change in pressure with time ... 38
List of tables
Table 2.1: Typical composition of biomass ... 7
Table 2.2: Desirable properties of particJes and gas for fluidized bed-design of fluidized bed reactor ... 14
Table 3.1: Geometrical dimensions for the cyclone ... 26
Table 4.1 : Materials required ... 29
Chapter 1: Introduction
Biomass is a versatile energy source that can be used for production of heat, power, transport fuels and biomaterials, apart from making a significant contribution to cJimate change mitigation. The terms biomass energy, bioenergy and biofuels coyer any energy products derived from plant or animal or organic materia!. The increasing interest in biomass energy and biofuels has been the result of the following associated benefits:
• Potential to reduce GHG emissions. • Energy security benefits.
• Substitution for diminishing global oil supplies. • Potential impacts on waste management strategy.
• Capacity to convert a wide variety of wastes into cJean energy.
• Technological advancement in thermal and biochemical processes for waste-to energy transformation [1].
The contribution offorest biomass to Canada's energy supply has increased from 3 to 4% in the 1970s to 5-6% today. Changes in pulp and paper technology have resulted in most of this increase [2]. Canada's forests therefore represent a tremendously abundant source of biomass. This is a significant advantage because biomass is a resource of rapidly growing importance in what many analysts refer to as the burgeoning global "bio economy". Biomass is the basis for making renewable bioenergy, biofuels and other bio products that are increasingly replacing fossil-fuel based products [3]. By 2100, the average V.S. tempe rature is projected to increase by about 4 op to ]] op, depending on emissions scenario and mode!. An increase in average temperatures worldwide implies more frequent and intense extreme heat events, or heat waves. The number of days with high temperatures above 90 op is
expected to increase throughout the United States, especially in areas that already experience
heat waves. Global sea levels have risen by 8 inches in the last 130 years. Sea level measurements help tell us about our changing climate because they are the sum of heat the ocean absorbed and water added from melting glaciers and ice sheets. About 90 percent of the heat trapped in the earth's atmosphere is eventually absorbed by the ocean. Heat causes water to expand, which increases sea level [5]. Continued emissions of greenhouse gases will
lead to further climate changes. Future changes are expected to include a warmer atmosphere, a warmer and more acidic ocean, higher sea levels, and larger changes in precipitation patterns. The extent of future climate change depends on what we do now to reduce greenhouse gas ernissions [6].
160 Vi 140 Qi .~ ... 120 0 "0 100 .... ro ~ 80 • Cellulosic biofuel c: 60
0 • Ali types of biofuel
"B
:J 40 "0 0 è: 20 0 2012 2014 2016 2018 2020 2022 YearFigure 1.1: Production of cellulosic biofuel vs other biofueJ [4].
Biological hydrogen production processes are found to be more environments friendly and less energy intensive as compared to thermochemical and electrochemical processes [7]. Bio
energy demands. It seems particularly suitable for relatively small-scale, decentralized systems, integrated with agricultural and industrial activities or waste processing facilities. Bio hydrogen is considered as an important key to a sustainable world power supply and is currently being seen as the versatile fuel of the future, with the potential to replace fossil fuels. Unlike fossil fuels, biomass is dispersed and lacks the infrastructure to ensure sustained supply of low co st quality controlled gasification feedstock [8]. The demand for hydrogen over the coming decade is expected to grow for both traditional uses (ammonia, methanol, and refinery) and running fuel cells. At least in the near future, this thirst for hydrogen will be quenched primarily through the reforming of fossil fuels. However, reforming fossil fuels emits huge amounts of carbon dioxide. One approach to reduce carbon dioxide emissions is to apply reforming methods to alternative renewable materials. Su ch materials might be derived from plant crops, agricultural residues, woody biomass, etc. Biomass is a proven source of renewable energy that is already used for generating heat, electricity, and liquid transportation fuels. Biomass and biomass-derived precursors such as ethanol and su gars are appropriate precursors for producing hydrogen through different conversion strategies [9]. Hydrogen can be produced via various process technologies, including thermal (natural gas reforming, renewable liquid and bio-oil processing, and biomass and coal gasification, electrolytic (water splitting using a variety of energy resources), and photolytic (splitting water using sunlight via biological and electrochemical materials) [10].
Hydrogen can be produced from cellulose biomass without any C02 emission by an aqueous alkaline reforming (AAR) technology. This process was previously demonstrated in batch scale. To produce hydrogen continuously and to increase the efficiency of hydrogen
production, a continuous system is required. The objective of this project is to design and fabricate a setup to pro duce hydrogen in continuous mode without C02 formation from cellulose biomass by aqueous alkaline reforming process in the presence of a solid catalyst that favours hydrogen production. This report describes the reaction between cellulose, alkali hydroxide and water in the presence of a catalyst and the complete fluidized bed set up. The set up comprises mainly of
~ Fluidized bed reactor: The aqueous alkaline reforming of cellulose takes place in it. ~ Condenser: condenses the steam from the reactor by using cold water.
~ Cyclone separator: Helps to remove the dust particles in the gas stream. ~ Mass flow controller: To monitor the flow rate of the gas to maintain flow rate. ~ Pump: Agas pump is used for recirculating the gas in the system.
The design of the fluidised bed reactor and cyclone separator is discussed. The characteristics of fluidised bed, cyclone separator and the important parameters to be considered in fluidization are discussed. The parameters which affect the performance of the reaction is identified and discussed. The experiment is carried out with Iignocellulose, alkali hydroxide, water and supported alumina nickel catalyst in the fabricated fluidized bed. The unreacted cellulose obtained from experiment pointed out the importance of water for the aqueous al kali ne reforming reaction. The experiment is then carried out in the fluidised bed reactor without the distribution plate and allowing the cellulose to be in direct contact with water. The latter reaction was successful with 75% production of hydrogen. The reason for unreacted cellulose in the fluidised bed and hydrogen production when the cellulose is mixed with the reactants is discussed in detail.
Chapter 2: Literature Review
2.1 Biomass
Biomass, a unique carbon containing renewable source, has properties similar to fossi! fuels,
in regards to hydrogen production. Therefore, hydrogen production technologies from the
fossil fuels may also be employed using biomass as the feedstock. But, unlike fossil fuels, the process produces no emission of carbon dioxide. The biomass used for the production of
hydrogen is de-lignified cellulose as lignin comprises most of the carbonaceous content,
hydrophobic in nature and it is the most slowly decomposing component making the process
energy-expensive. The cost of lignin extraction can be compensated by its market value and
hence the process does not affect the hydrogen production cost.
Table 2.1: Typical composition ofbiomass [11].
Cellulose Wood Grass Municipal Animal Sewage refuse Manure sludge Carbon 44.4 51.8 45.8 41.2 35.1 43.8 Hydrogen 6.20 6.30 5.90 5.50 5.30 6.20 Nitrogen + Sulphur
-
0.10 5.20 0.70 2.90 4.10 Oxygen 49.3 41.3 29.6 38.7 33.2 19.4 Ash-
0.50 13.5 13.9 23.5 26.5 100 100 100 100 100 100 Moisture-
5-50 10-70 18.4 20-70 90-97 Volatile matterb-
80 70 67 63 57 Calorific valuec (MJlkg) 17.5 15.4 11.2 10.4 7.40 1.302.2 Aqueous alkaline reforming-Cellulose degradation
During alkaline degradation of cellulose, the end groups are reduced leading to so- called peeling or endwise depolymerisation reaction. If the erosion of cellulose molecules from their reducing ends (peeling) were to continue unchecked, the whole of the cellulosic material would eventually dissolve. Stabilisation of the cellulose is achieved by a competing reaction (a 'stopping' reaction). Glucose first reacts at C-C bonds cJeavage on the metal side of the catalyst [10]. During each cJeavage of C-C bonds, one molecule of carbon monoxide
and one molecule of hydrogen are formed. The carbon monoxide performs as an intermediate
product, which is followed by water gas shift and produces one molecule of hydrogen and
one molecule of carbon dioxide. The key to avoid undesirable hydrogen consuming reactions
feedstock for AAR process has many advantages over the other hydrogen producing methods [14].
Figure 2.1: Cellulose degradation [12].
The biomass hydrolysate do es not have to remove the water from the water-soluble feedstock as in thermochemical methods. Whereas, aqueous phase reforming is conducted under mild conditions (usually at low temperatures) that minimizes the undesirable decomposition of biomass feedstocks. At elevated temperatures, the polysaccharides are attacked by strong alkali solutions, with a large number of reactions taking place. The most important ones are:
• Dissolution ofun-degraded polysaccharides
• Peeling of end-groups with formation of alkali stable end-groups
• Alkaline hydrolysis of glycosidic bonds and acetyl groups
• Degradation and decomposition of dissolved polysaccharides, hydrolyzed fragments, and peeled monosaccharides.
The beta elimination or peeling-off reaction is the dominating chemical reaction occurring during alkaline steeping. This reaction is associated with yield loss initiated by end wise degradation of sugar units of reducing end group [15]. As the main degradation products of the eliminated anhydroglucose units, isosacharrinic acids are forrned via benzilic acid rearrangement. The peeling reaction proceeds until it is stopped chemically by different rearrangement reaction or physically by reaching the crystalline regions of the fibre [16]. The stopping reaction leads to the formation of alkali stable metasaccharic acid at the reducing end of the molecule by which successive molecular degradation is prevented. The temperature dependent ratio of both reaction rates is crucial for the scale of undesired cellulosic yield loss [17].
2.3 Hydrogen production by aqueous alkaline reforming
Cellulose reacts with sodium hydroxide (NaOH) and water to produce hydrogen, Na2C03, and a small amount of methane as the by-product. The total yield of hydrogen obtained through the reaction at a temperature range 473-773 K is estimated to be 62%. The formation of hydrogen is specifically enhanced by the addition of Ni, Co, Rh, or Ru catalyst supported on Ah03 to the mixture of cellulose and NaOH, and the total yields of hydrogen can be dramatically improved to almost 100%. Sodium hydroxide locks C02 in the forrn ofvaluable solid chemical compound, Na2C03. The use of sodium hydroxide for the production of hydrogen results in high hydrogen generation rates, lower operation temperatures, and overall reduction in carbon emission [18]. Nickel base catalysts are particularly promising due to their relatively high activities and low costs. The experiment is carried out in a batch
process and results show that hydrogen with a purity of 95% is produced with no traces of either CO or C02 at temperatures as low as 573- 623 K [19].
One mole of cellulose (162 g) reacts with 12 moles of NaOH (12x40 g) and 1 mole of H20 (18 g) in the presence of Ni catalyst to produce 6 moles ofNa2C03 (6xl06 g) and 12 moles of H2 (12x2.016 g). The mole ratio of carbon in biomass to alkali metal hydroxide is 1 :2. Hence based on the carbon content in the cellulose, the amount of alkali metal hydroxides to be added is determined. The ratio of biomass weight to catalyst weight is 2.5: 1.
2.4 Fluidization
Fluidization is commonly defined as "the operation by which the fine solids are transformed into a fluid-like state through contact with a gas or liquid H. The gas flow in fluidization exerts upward force on the bed. At a very low velocity, this force is too weak to move the particles. As the velocity is increased, a point is reached at which the upward force is just greater than the downward force of gravity acting on the bed. This is the onset offluidization. A fluidized bed is a packed bed through which fluid flows at such a high velocity that the bed is loosened and the partic1e-fluid mixture behaves as though it is a fluid. Thus, when a bed of partic1es is fluidized, the entire bed can be transported like a fluid, if desired. Both gas and liquid flows can be used to fluidize a bed of partic1es. The most common reason for fluidizing a bed is to obtain vigorous agitation of the solids in contact with the fluid, leading to excellent contact of the solid and the fluid and the solid and the wall. The partic1es begin to separate from one another and to vibrate. If the gas velocity continues to increase, the particles will spread farther apart and move more vigorously. Very high velocities will send
the parti cl es swirIing wildly about the container. Thus, fluidization can be fine-tuned to
provide a range of bed conditions from smooth to turbulent. A gas-fluidized bed actually
behaves like a liquid.
2.5 Factors affecting fluidisation 2.5.1 Minimum fluidization velocity
When a fluid passes upwards through the interstices of a bed of solids without the slightest
disturbance of the solids, the bed is called a fixed bed. With further increase in the velocity of
fluid, the entire bed of solids is suspended and behaves as if its weight is counterbalanced by the force of buoyancy. At this point, ail the particles are fully suspended in the fluid. This is
called the onset of fluidization and the velocity of fluid at which it happens is called minimum fluidization velocity, which is one of the most important parameter for the design
offluidizers.
2.5.2 Pressure drop
At low flow rates in the packed bed, the pressure drop is approximately proportional to gas
velocity up to the minimum fluidization condition. With a further increase in gas velocity, the
packed bed suddenly unlocks (at the onset of minimum fluidization condition), resulting in a
decrease in pressure drop.
2.5.3 Bed expansion ratio (R)
This term is used to describe the characteristics of bed height during fluidization. This is
quantitatively defined as the ratio of average height of a fluidized bed to the initial static bed
velocity. Average bed height is the arithmetic mean of highest and lowest level occupied by
top of the fluidized bed. It is denoted by "R".
2.5.4 Bed fluctuation ratio (r)
The term fluctuation ratio used to describe the characteristics of the bed height during
fluidization. This is quantitatively defined as the ratio of the highest and lowest levels which
the top of the bed occupies for any particular gas flow rate. It is denoted by "r".
2.5.5 Fluidization quality (FQ)
Fluidization quality is defined as the dimensionless pressure drop through the bed. A FQ
equal to unity characterizes a homogeneous fluidisation of either individual particles or
ephemeral agglomerates. In contrast, channeling and slugging phenomena lead to poorer
fluidisation qualities.
2.6 Fluidized bed reactor
The solid substrate (the catalytic material upon which chemical species react) material in the
fluidized bed reactor is typically supported by a porous plate, known as a distributor. The
fluid is then forced through the distributor up through the solid material. At lower fluid
velocities, the solids remain in place as the fluid passes through the voids in the material.
This is known as a packed reactor. As the fluid velocity is increased, the reactor will reach a
stage where the force of the fluid on the solids is enough to balance the weight of the solid
material. This stage is known as incipient fluidization and occurs at minimum fluidization
velocity. Once this minimum velocity is surpassed, the contents of the reactor bed begin to
expand and swirl around much like an agitated tank or boiling pot of water. The reactor is
now a fluidized bed. Stationary or bubbling fluidized bed is formed when bed of solid
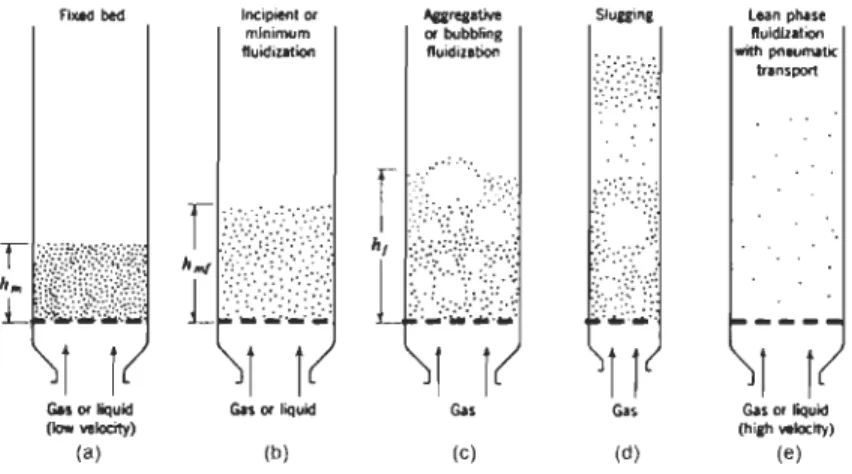
particJes levitate due to an introduction of fluid that flows through the bed at low fluid velocity. In this state, the solid mass behaves and exhibits many of the characteristics of a fluid. This phenomenon is known as fluidization and results in a fluidized bed. Fluidized beds have been significantly utilized in chemical processes, in which parameters su ch as diffusion or heat transfer are the major design parameters. Compared to packed bed, a fluidized bed has notable advantages such as better control of temperature, no hot spot in the bed, uniform catalyst distribution and longer life of the catalyst.
Flxod bed Inciptent or
minimum fluidi~tton
...
-01' bubIl~nB ftuidizltionr
{?\
:
:.;;':"?\
r
:
'
:.:
..
'
:
"~:
;
::
"
_
_
'.'~
'
::.
'
:':
;"
:
';
"
!.
.
'
•.. '::.:.": "i·.;.·.::'.:.:.: ...·~
·
.
·
•. , ..•. i.t
J~~JJj
1
m
ZÎÎg .
.
1
r
1 1 1
!
Gos Of liquld Gas 01' liquid Go,
(Iow .... Iocity) ~) ~) ~) Sluui",
1
1
Gos (d) Lean phlSt nuidization wiIh pneumatic trlnsport1 1
Gos 01' liQuld (hilh_it;) (e)Figure 2.2: Various kinds of contacting of a batch of solids by fluid.
The desirability of using fluidized beds is dependent on achieving good mixing between the solids and the suspending fluid. Nearly ail the significant commercial applications of fluidized bed technology concem gas-solid systems. Figure 2.2 shows schematics of various kinds of contacting of a batch of solids by fluid. Applications of fluidized bed reactors incJude but are not limited to Fisher-Tropsch synthesis, catalytic cracking of hydrocarbons and related high molecular weight petroleum fractions. Gasification in a fluidized bed can be utilized to convert coal, biomass and other waste materials into synthesis gas. Table 2.2 lists
desirable properties of parti cl es and gas for fluidized bed-Design of Fluidised Bed Reactor [21].
Table 2.2: Desirable properties of partic1es and gas for fluidized bed-Design of Fluidised Bed Reactor [21].
Property Desirable Range
Mean diameter 50 !lm to 1.6 mm
Size distribution Neither too narrow or too broad, e.g. 90th to 10th decile ratio 5 to 25
Wide range of values possible, but uniform from
Density partic1e to partic1e
Shape Rounded and with length to thickness ration no
larger th an ~ 3
Surface roughness Smooth
Surface stickiness A void sticky surfaces
Attrition resistance Usually strong as possible
Hardness Avoid resilience, but also excessive hardness
Viscosity No restriction
Density No restriction, but higher value improves properties
2.6.1 Applications
• Industrially produced polymers • Fertilizers from coal
• Oil decontamination of sand
• Industrial and municipal waste treatment • Radioactive waste solidification
2.6.2 Advantages
• Uniform partic1e mixing • Uniform temperature gradients
• Ability to operate reactor in continuous state • High catalytic surface area
2.7 Fluidization vessel
Most of the vessels have the common shape of a vertical cylinder. There will be adequate space in the vesse! for solids to expand in the vertical direction and entrained solids.
Freeboard is the height above the bed and the volwne is known as disengaging. The cross sectional area of the vessel depends on the volumetric flow rate and the allowable fluidizing velocity of the gas.
2.8 Descriptive behavior of a fluidized bed: The model of Kunii and Levenspiel
At gas flow rates above the point of minimum fluidization, a fluidized bed appears much
like a vigorously boiling liquid; bubbles of gas rise rapidly and burst on the surface, and the
emulsion phase is thoroughly agitated. The bubbles form very near the bottom of the bed,
very close to the distributor plate, and as a result the design of the distributor plate has a
significant effect on fluidized-bed characteristics. Fluidized bed is to be treated as a
two-phase system: an emulsion phase and a bubble phase (often called the dense and lean phases).
The bubbles contain very small amounts of solids. They are not spherical; rather, they have
an approximate!y hemispherical top and a pushed-in bottom. Each bubble of gas has a wake
which contains a significant amount of solids. These characteristics are illustrated in Figure
2.3, which were obtained from x-rays of the wake and emulsion, the darkened portion being
••
.
.
.
.
.
.
.
.
.
,.
. .
..
:
:
..
:, .. _~.:...
.
.
...
..:...
-.'
-: '.-,.·t
OISENGAGING SECTION --i-~--FLUIDIZEO ZONE}
Figure 2.3: Fluidization vessel [22]. 2.8.1 Distributors
Good distributors such as porous sintered metal or ceramic plates are commonly used with bench-scale equipment, but they are not used in larger units because of their high cost and poor resistance to the high mechanical and thermal stress. There are two types of grid plates,
one is used when the inlet gas contains solids and the other one is used wh en the gas is clean.
It is designed to stop solids from flowing back during normal operation and shut down.
During normal and abnormal flow, the distributors must bear with the differential pressure across the restriction in a bed with internaIs to limit bubble size; any conventional type of distributor should operate satisfactorily. In a freely bubbling bed, a distributor with relatively small opening should be used. The main requirements for a distributor plate are to:
• Promote uniform and stable fluidization;
• Minimize the attrition ofbed particles;
• Minimize erosion damage;
• Prevent the flow-back of bed material during normal operation and on interruption of
fluidization when the bed is shut down;
• Minimum deviations in fluidizing velocity.
2.8.2 Freeboard
The freeboard is the height between the top surface of the bed and the nozzle where gas is
exiting in the bubbling-bed unit. The reaction between solids and gases take place in the
freeboard region.
2.9 Cyclone separator
Cyclones are mostly used for removing industrial dust from air or process gases. They are the
most frequently encountered type of gas-solid separator in industry. The primary advantages
of cyclones are economy, simplicity in construction and ability to operate at high
temperatures and pressures. The principle of cyclone separation is simple; the gas-solid
mixture enters on the top section. Then, the cylindrical body induces a spinning, vertical flow
pattern to the gas-dust mixture. Centrifugai force separates the dust from gas stream; the dust
travels to the walls of the cylinder and down the conical section to the dust outlet and the gas
exits through the vortex finder.
2.9.1 Benefits of cyclone separa tors
• Reducing the amount of testing required, thus saving time and money
• Predicting separation efficiencies and pressure drops at off design conditions
2.9.2 Working
Dust-Iaden air is blown into or drawn through the cyclone and forced to move in a circular motion. The airstream spirals downward to the base of the unit as centrifugai forces move the heavier dust particles to the side walls. The motion continues spiraling downward to the base of the unit. The dust then falls out and the air reverses up through the inner tube and out the top. Cyclonic separation efficiency is determined by the cyclone geometrical parameters, the density of the solids, and the rotational velocity of the air stream. It is essential that the geometry of each internai component be designed to promote a smooth transition in maintaining laminar flow characteristics [23].
2.9.3 Control of Size distribution
The proper addition of coarse or fine solids and the adjustment of the cyclone efficiency are used to control the size distribution in the bed and to keep the bed lubricated with sufficient fine solids for good fluidization.
Chapter 3: Design of fluidized bed reactor system
3.1 Fluidized bed reactorThe bed height depends on gas contact time, length to diameter (LlD) ratio needed to provide
staging, space needed for internai heat exchangers and solids retenti on time. Most bed heights are between 0.3 m to 15 m. The reactor is normally a vertical cylinder but there is no limitation on shape [24]. The geometry of a fluidized bed (its diameter and bed height) plays
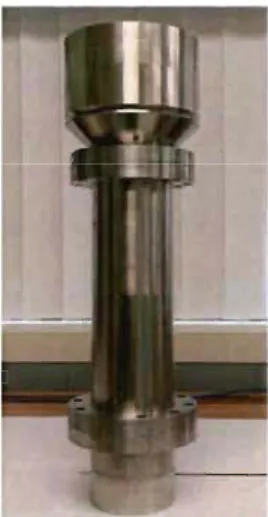
a crucial role. A fluidized bed reactor was fabricated with an LlD (length to diameter) ratio of about 5.75 and is shown in Figure 3.1.
Figure 3.1: Fluidized bed reactor
The reactor is roughly 21 inch long with a 2 inch ID. The minimum fluidisation velocity was calculated using Ergun equation and the velocity of the fluid to bring about fluidization was found to be 80 l/min. The dimension of the catalyst to be used is 1 mm diameter. The reactor
was built using InconeJ alloy 600, because of its resistance to stress at high temperature and
pressure [25]. lnconel Alloy 600 is the best material for reactor construction due to its
beneficial effects in handling with high concentration caustic and hydrogen embrittlement [26].
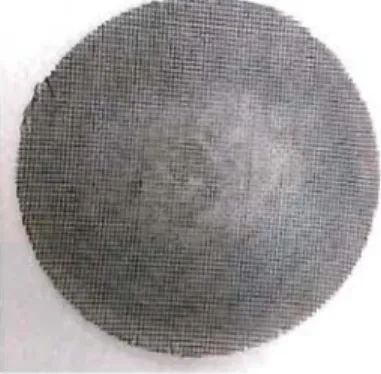
3.2 Distribution plate
The ultimate function of the distributor plate is to distribute the fluidizing gas uniformly over
the cross-section of the bed and also to support the weight of the fluidized bed. The
distributor plate has a strong influence on the size and frequency of the bubbles in a fluidized bed. The size of the bubbles in the bed is the major cause of particle circulation. We have designed the distribution plate to be used in the fluidised bed reactor. lnconel alloy is
considered as the material of construction. Minimum fluidization velocity values increased
with an increase in the number of holes in the distributor plate. However, for the test run, the
sieves used in cooking is cut into 2 inches diameter and used as distribution plate. The sieve
is held in place by flanges in the fluidised bed reactor. The porous sintered plates are often
used as distributor plates. These types of distributors can operate satisfactorily over a wide
range of operating conditions (gas velocities) than can other types of gas distributors.
Figure 3.2: Sieve used as distribution plate.
The leakage around the distributor plate causes non-unifonn fluidization. This is severe if the
distributor plate is subjected to heating during start-up and cooling during shut-down.
Considerable thennal stress deveJops on the distributor plate. The result is warping which
destroys even the best seal. For laboratory scale fluidized beds, the leakage is easily
controlled by the use of a gasket and unifonn tightening of the bolts on the flanges.
3.2.1 Design highlights
• Gas distributor plates are special perforated plates for distribution of process gas in a
fluid bed.
• The fluidizing velocity, and hereby the pressure drop over the plate, depends on the dimensions of the perforation and the perforation density (number of perforation
/area). It is possible to control the flow direction by altering the number of
perforation.
• The plate design is selected according to the product application, to obtain optimum
fluidization and catalyst movement during operation and to prevent catalyst
Particle and gas properties play a key role in successful design together with the critical
pressure drop ratio, and hole size, geometry and spacing; these strongly influence jet penetration, dead zones, particle sifting, attrition and mixing. The design procedure for
sintered distribution plate is as follows [27].
The pressure drop across the fluidized bed is calculated for minimum allowable pressure drop
using the following expressions:
ll.P B
(
::2
)
=
Cp - p) X (1 - €) X 9 X Hmf PB=
(lOOO-1.7)x(1-OAl )x9.81 xO.2921N
ll.PB
=
1687.7 7 -=
172.10 mm H20m2
Since the expansion loss for a conical inlet is very small, assume that the rearrangement resistance is negligible.
Thus the limiting condition is
~Pd= 0.1(172.10) = 17.21 mm H20
Bed diameter =0.05 m
Flow at 4 x Umf = 4 X 1333.34 = 5333.36 cm3/sec
6PD
=
172.10x
98.067=
16877.33 dynes/cm2The equation of Darcy expresses the relationship between the variables up to the limit of
proportionality as
QII x llll X tp
6PD
=
--=---'''---4>D X Ap
Where
PD
=
Pressure drop across distributor plate (dynes/cm2)=
16877 .33 dynes/cm20D = Permeability ofplate material (cm2)
fig = Gas viscosity (poise) =0.002 Poise tp = Plate thickness (cm) =.19 cm
Qg = Gas flow Rate (cm3 /sec) = 1333.34 cm3 /sec Ap = plate area( cm2) = 20.25 cm2 Qg x fig X tp
o
-D - I1PD xAp 1333.34 x 0.002 x .19 16877.33 x 20.2 OD = 1.4825 X 10.6 cm2
The relationship between the number and size of orifices is found by equation
Uo = 1[/4 x do? x Uor x Nor
Uo = Superficial velocity of inlet gas C'd =orifice coefficient
gc =gravitational constant
do? = square of the diameter of the orifice Uor = Velocity of the fluid through orifice
0.850
..
1: 0.800 .!I. 0.750 .~ 0.700 la:~
0.650"
0.600e.o
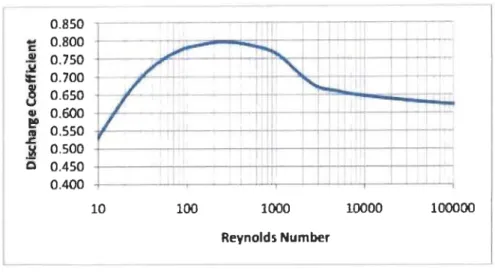
0550 1111 .1:. 0500 .~ 0 0.450 0.400 10 100 1000 10000 100000 Reynolds Number ---~Figure 3.3: Typical curve for Reynolds number vs Discharge coefficient
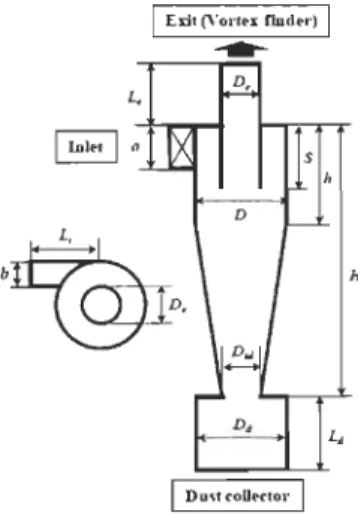
3.3 Cyclone separator (Physical model)
The schematic of the cyclone separator and the generated grid system considered in the present work is shown in Figure 3.4 and the geometrical dimensions are listed in Table 3.1. Ali dimensions are normalized by using the diameter of cyclone body (D = 3.14 inch). According to the cyclone's height, it can be divided into three parts such as vortex finder (annular space), separation space and dust collection part. The inlet pipe is mounted tangentially onto the side of the cyl indri cal part of the cyclone body and the working fluid (gas and particles) is incoming through this section with the uniform velo city. The exit tube,
called the vortex finder, is fixed on the top of the cyclone. The cyclone separator was
designed to remove the dust particles and circulate the gas back to the reactor. The cyclone separator consists of vortex fin der, cone and dust collector. It has a tangential inlet of 1 inch
and uses reverse-flow technology. The cyclone separator has a height of 12.6 inch with a
diameter of 3 .14 inch.
1 Esit (YOI"U findel') 1
L,
b
~
~
'
----
D, 1 Dus' ('oUertor 1 HTable 3.1: Geometrical dimensions for the cyclone [28].
Cyclone parts Dimension (xD) Dimension (m) Cyclone diameter (D) 1 0.079
Gas outlet diameter (De) 0.5 0.0395
Dust collector inlet diameter (Did) 0.375 0.0296
Dust collector diameter (Dd) 1 0.079
Exit length (L) 2.0 0.158
Vortex finder length (S) 0.5 0.0395
Cylinder length (h) 0.85 0.0671 Cyclone length (H) 4 0.316
Dust collector length (Ld) 1.7 0.1343
Inlet width (a) 0.2 0.0158
Inlet height (h) 0.5 0.0395
Inlet length (Li) 1 0.079
Figure 3.5: Cyclone separator.
3.4 Condenser
A condenser is used to cool the hot gas escaping from the reactor. Condensers use a lower
temperature to cause gases to enter liquid phase and collect the liquid. The condenser is
continuously circulated with tap water to cool the gas and the condensed droplets drift back
to the reactor helping in the continuous reaction of the reactants. The condenser is 25 inches
long to provide enough residence time to cool. A smaller diameter pipe inserted inside a
greater diameter pipe is bent to the required form. Water passes through the inner tube & the
refrigerant by the annular space between the two tubes; the flow of refrigerant & water being
arranged in opposite direction to obtain the greatest benefit of heat-transfer. Due to the presence of impurities in water, scale may fonn on the water-side of the tube that can impede
the heat transfer; also muck may settle on the surface. Thus it becomes essential to
periodically clean the water tube. However in the tube-in-tube system, cleaning is not simple,
unless a removable header is provided to attach ail of the tubes. The double pipe heat
exchanger design equations are used to design the condenser. The condenser consists of two
equallength pipes each of 25 inch and connected with each other. The diameter of outer pipe
is 2 inch and the diameter of inner pipe is 0.834 inch. The cold water from the water ho se is
circulated continuously and is used to condense the gas.
3.5. Catalysts
Cellulose, a polymer, decomposes to water-soluble products at first step, and the water-soluble products are gasified by a nickel catalyst. The activity of a catalyst depend not only
on the kind of support materials, but also on the overall catalyst size; indicating the nickel particles presented on the extemal surface could only contribute to the gasification [29].
Figure 3.6: Alumina balls before impregnation.
Figure 3.7: Nickel supported alumina balls.
Alumina balls in the range of 1-2 mm were selected. 2.6 g of nickel nitrate powder is dissolved in 10 ml water to prepare nickel nitrate solution. 3 g of alumina balls were soaked in nickel (II) nitrate solution. Excess liquid is eliminated by evaporation. Deposition of the active element is never quantitative [30]. It is subjected to ovemight drying in an oyen at 413
K. To control the nitrate decomposition, the precursors were maintained at 573 K for 3 hours and then the Nil Ah03 catalyst was calcined at the final temperature of 1123 K for 5 hours.
The catalyst was reduced in a hydrogen atmosphere for 3 hours at 973 K. Calcination and reduction are carried out by using the tube fumace.
Chapter 4: Experiment
Materials
This mixture along with the alumina supported nickel catalyst is mounted on the distribution
sleve.
Table 4.1: Materials required.
Material Quantity
Cellulose 3 g
sodium hydroxide(~98% pellets) 2.97 g
Water 37 ml
4.1 Experimental Set-up
-
-1
-t
1
--
-1~OMATOGRAPHV
1Figure 4.1 : Schematic view of experimental setup.
The experimental setup consists of a fluidised bed, condenser, cyclone separator and gas flow controller (GFC). The process is carried out in the reactor of inside diameter 2 inches. Sieves (metal sifters) were used as distributor. The cellulose, sodium hydroxide and the catalysts are placed on the distributor plate to prevent the back flow of the reactants. This is tightly attached to the colurnn with the help of the gasket; so that there is no leakage. The mass flow controller used is in the range of 0-600 Jlm capacity for measuring the air flow rate circulating back into the reactor. A multi-thermocouple probe was used to monitor the reaction temperature. Thermocouple and pressure transducer were used at various points of the system to monitor the temperature and pressure changes throughout the whole system.
4.2 Instrumental Set-up
-
,.
ID
Figure 4.2: Block diagram obtained from LabVIEW.
National Instrument LabVIEW 9.0 software provides a graphie user interface monitors and records various operating parameters, and allows for control of sorne set points. It is a flexible programming environment that can help you successfully build your unique application. LabVIEW is a graphical programming platform that helps engineers scale from design to test and from small to large systems. Three data acquisition card (NI9256, NI 9207,
and NI 9213) in conjunction with the Lab VIEW program records the experimental data. The data from the thermocouple, pressure transducer, and mass flow controller are recorded and
displayed through the Lab VIEW. The Lab VIEW block diagram and front panel for the fluidised reactor system is shown in Figure 4.3.
..
.
•••..
.
..
.
..
.
..
.
•••..
.
..
.
"
·
1
..
.
..
.
Figure 4.3: Block diagram obtained from LabVIEW.
4.3 Experiment
The system is purged with argon gas to remove other gases and filled with argon gas to create an inert atmosphere. The flow rate of the gas can be monitored by a mass flow controller. Separate heaters are provided for both the main reactor and disengaging zone. The reactor is heated to about 300-350 oC by using mica insulated band heaters. A PID controller along with a solid state relay is used to control the heating rate of heaters. The bottom of the fluidised bed reactor is filled with sufficient water for the aqueous alkaline reforming to take place.
1 Moss fla. controllo,
Figure 4.4: Experiment setup.
The cellulose, sodium hydroxide crystals along with the solid catalysts is kept on the
distribution plate. At 300 oC, the steam reacts with cellulose, sodium hydroxide and nickel
catalyst, to produce hydrogen gas. The reaction products are cooled by a condenser and allowed to go back to the fluidized bed reactor to take part in the reaction. A cyclone separator or filter is provided to capture the fines resulting from particle attrition. A circulating gas pump is used for providing and maintaining the minimum fluidization
velocity. A pressure relief valve is installed in the system for 60 psig since the maximum
operating pressure for the pump is 75 psig. A filter is placed before the mass flow controller
unsaturated substrate and facilitates their union. The MicroGC is calibrated for the detection of gases using a universal gas calibration standard.
Chapter 5
: R
esult a
nd
Discussion
The aqueous alkaline refonning is carried out in Alloy-600 fluidised bed reactor with 3 g of cellulose, 2.97 g of NaOH in presence of supported Ni catalysts. The initial pressure of Ar
was kept at 20 psig. The volume of water used was 37 mL to constitute 2M NaOH
respectively. The caustic concentration was kept low to protect the reactor from caustic embrittlement. The maximum heating temperature was 250
o
c.
The maximum pressure of the system was 25.5 Psig. After three hours, the fluidised bed reactor was opened and examined. The cellulose on the distribution plate was unreacted. It has been wetted by the steam and its edges have been bumed whereas the middle portion of the cellulose was intact as in beginning. The experiment was repeated man y times to come to a concrete conclusion. The water used for the reaction was reduced to half the amount initially used for the experiment. The components of the system were removed to investigate the missing water. The condensed water was obtained from the cyclone separator. Aqueous alkaline reforming requires the breaking down of cellulose by water and alkali hydroxide in the presence of catalyst. In the fluidised bed reactor system, the water heated to 200-350 oC will change water into gaseous state. The ste am is supposed to condense in the condenser and drip backwards into the reactor. The presence of water in the cyclone separator indicated that the circulation of gas is carrying the steam to the cyclone separator without allowing it to cool down and retum to the reactor. The flowrate cannot be reduced as the flowrate is to be maintained to bring about fluidization. This indicates that for an alkaline refonning process to take place, the cellulose should be in a fonn to combine with other reactants. For theresults in unreacted reactants. The experiment was then conducted with 1 g of cellulose, 2.96
g of NaOH, 37 mL of water and 0.4 g of supported nickel catalyst powder. The distribution plate is not used. Instead, the cellulose was dissolved in water and mixed with sodium
hydroxide and catalyst at the bottom of fluidized bed reactor. Alumina supported nickel
catalyst powder was used. The system was pressurised to 20 psig with argon. The pressure
was increased to 25.5 psi during the reaction. The pressure after cooling down was noted as
24.82 psig. The gas was then analysed by using a MicroGC model 3000 from Agilent
Technologies (Gas chromatography). The MicroGC consists of a PLOT U column that detects
carbon dioxide, ethylene, ethane, acetylene and a moiSiev0065 5A column that detects neon,
hydrogen, oxygen, nitrogen, methane and carbon monoxide. The MicroGC is calibrated for
the detection of the above mentioned gases using a universal gas calibration standard (table 5.1). Agilent Cerity software is used to control and analyze the GC runs.
Table 5.1: Universal gas calibration standard.
He 0.1000% Ne 0.0496% H2 0.0988% 02 0.0500% N2 0.1000% CH4 Balance Ethane 0.0497% Ethylene 0.0497% C02 0.0500% CO 0.0995% Acetylene 0.494% Propane 0.0501% Methyl 0.0501% Acetylene n-Butane 0.0501% 35
·", Il >. s .Â.. § ci ~ o. , ,~
,
B • 3~ ... k TC02A >. ~ ~ --D' ,,
"
.
,; i. ,; ~Figure 5.1: Gas chromatogram.
1
I
RetentiOn
Signal lime Type Wi(
~thJ
ArealIIV"sl
1 Area %[min] m n Name
r---1
1
0.438 0.000 0.00000 1 0.00000'-
1
-r
0.4690:000
0.00000 l~o.~oo:-::O~OO::-+--~= 1 1 ~ pp '0.009 38.97000 1 0.0391] [r
1"
r
0.586 0.000 o .OOÔOO 0.00000r
1f
2.671 _e~ 0.069 1476.74145 1.48418 2 1 0.545av
0.û18 f 5521e+004 75.901152
-1
0)~6f -- --0.000 - 0.00000 --o.oOOOQ. -2 0.598 0.000 O.OOOOO ! 0.00000 2 1 0.656 - VP 0.047 7643.97832 r7 .68248 -2r
0
.
682
0.000 0.00000 0.00000 -2- ' 0.747 ' VB 0:149 1.4818e+0041 14.89303 Acetytene H drQgen Neon 2-r
0.801- - - 0])00 - 0.00000- 10.00000 Nitr en 2 f 1.020 0.000 0.00000T
0.00000 Methane 2 1 1i8f 0.000 O~OOOQ..O_ O.ooo~o-,-I_~_c-o-=_~Figure 5.2: Gas chromatography analysis data.
It is found that hydrogen constitutes about 75% of the gas produced in run perforrned with
during the gasification. The change in temperature and pressure against time during the reaction is presented in Figures 5.3 and 5.4.
ïiii fLt':I
til
Q..E
~Change in TE!rnpeldt.ure wiilh
ime
1
Ime, m " ut
5)
Figure 5.3: Change in temperature with time.
Chan
e
F
pr
ss.u
0 ~ 30 '5 20 l 10 ~ 0 û .00 le
m
u
es.
)
Figure 5.4: Change in pressure with time.
37
l 'le)
e
Hydrogen mass calculation
There was a pressure increase at the end of experiment in the presence of catalysts and the Ge analysis showed that H2 constitutes about 75% of gas produced by aqueous alkaline
reforming. The reactor is cooled down to room temperature to eliminate the pressure
contribution from water vapour and argon expansion and the mass of hydrogen formed is
calculated based on the cool down pressures. The mass of hydrogen produced is calculated
using real gas equation, PV
=
ZnRT in which P is the final cool down pressure of the reactor,V is the volume of the reactor, Z is the compressibility factor, n is the number of moles of
gas, R is the universal gas constant (8.314 J mol·1 KI) and T is the final cool down
temperature. The calculation is based on the number of moles of gas present before and after
the gasification run. The number of moles of argon, nI is calculated based on the initial
pressure (20 psig), reactor volume (11861 x 1 0-7 m3) and initial temperature (22.32 oC) using
the real gas equation. The value of the compressibility factor (Z) is obtained from the NIST
table. The total number of moles (nl+m) after cooling is calculated based on the final cool
down pressure (24.82 psig), where m denotes the number ofmoles ofH2. From the final cool
down pressure, reactor volume and cool down temperature, the number of moles ofhydrogen
produced is found to be 0.1492 moles, which constitutes 0.2984 g. The mass of H2 supposed
to be obtained from 1 g of cellulose with 100% conversion is 0.1493 g.
PV 137895.146 X 11861 Xl0 - 7
n1
=
PZRT=
1X8.314X295.47=
0.06658 molesThe mass of H2 supposed to be obtained from 1 g of cellulose with 100% conversion is
Molar mass of Hydrogen =2.0158 g P = 24.82 psig=171127.87 Pa PV 171127.876X 11861 Xl0 - 7 n2
=
PZRT=
lX8.314X29S.47=
0.08262 mole Now, N=n 1 +n2=0.1492molesMass of Hydrogen produced =2 x 0.1492 =0.2984 g
There was a pressure increase at the end of ex periment in the presence of catalysts and the
Ge analysis showed that H2 constitutes about 75% of gas produced by aqueous alkaline
reforming. The reactor is cooled down to room temperature to eliminate the pressure
contribution from water vapour and argon expansion and the mass of hydrogen formed is
caJculated based on the cool down pressures. The mass of hydrogen produced is caJculated using real gas equation, PV= ZnRT in which P is the final cool down pressure of the reactor,
V is the volume of the reactor, Z is the compressibility factor, n is the number of moles of
gas, R is the universal gas constant (8.314 J morl K-I) and T is the final cool down
temperature. The caJculation is based on the number of moles of gas present before and after
the gasification run. The number of moles of argon, nI is caJculated based on the initial
pressure (20 psig), reactor volume (11861 x 10-7 m3) and initial temperature (22.32°C) using
the real gas equation. The value of the compressibility factor (Z) is obtained from the NIST
table. The total number of moles (nI +m) after cooling is caJculated based on the final cool
down pressure (24.82 psig), where n2 denotes the number of moles of H2. From the final cool
down pressure, reactor volume and cool down temperature, the number of moles of hydrogen
produced is found to be 0.1492 moles, which constitutes 0.2984 g. The mass of H2 supposed
to be obtained from 1 g of cellulose with 100% conversion is 0.1493 g.
P = Pressure in Pa
V =Volume of the reactor, m3
Z = Compressibility factor at a given temperature and pressure n
Chapter 6: Conclusion and future
w
ork
6.1 Conclusion
The fluidized bed reactor was designed as three separate parts and was connected with each other by means of flanges tightened by bolts. The system was tested for leaks by pressurising the system with argon gas. Cellulose should be in contact with water and sodium hydroxide to form hydrogen. The reactants remained unreacted as steam passed continuously through the reactants leaving it wet. The passing of steam is not enough to dissolve the cellulose and bring about the reaction. Hence, circulation is not suitable for aqueous alkaline reforming process. Water is found in the cyclone separator indicating that the circulating gas has carried away the steam to the cyclone separator and allowed it to condense in the cyclone separator. The flow rate cannot be reduced since it is mandatory to maintain flow rate for fluidization. So, a pathway has been made from the cyclone separator to the reactor for the condensed water to flow back to the reactor. However, the problem of unreacted cellulose persisted since the steam only passed the reactants whereas in the actual process they are mixed together. A fluidized bed system comprising of fluidized Bed reactor, condenser, cyclone separator and mass flow controller was fabricated successfully for the continuous production of hydrogen from cellulose by aqueous alkaline reforming. However, separating the cellulose, sodium hydroxide and catalyst from water and at the beginning of the reaction did not allow it to react. The steam also does not stay in the reactor because of the continuous circulation and enlarged volume of the entire system since the reaction is in continuous phase. For aqueous reforming process to take place the reactants should be mixed with water and the water when converted to steam should still be in contact with the reactants to aid the
production of hydrogen. This can be achjeved by closing the fluidized bed reactor from rest
of the system with a valve and allowing the gas to pass to the other parts of the system in regular time interval. This way the steam will stay inside the reactor and bring about the reaction.
6.2 Future work
In the near term, experiment will be conducted in fluidized and batch reactor and the results
will be compared. The influence of temperature on the performance of reactor can be studied.
The efficiency of solid catalyst and powder catalyst can be analysed. The experiment can be
conducted with continuous generation of steam from a steam generator rather than using a fixed amount of water. In the long tenn, new catalysts can be developed to compare with the
existing nickel catalyst for aqueous alkaline reforming of cellulose. The fluidized bed reactor
is disconnected from the system and can be treated as a batch reactor and experiments can be
conducted. This will help us to understand how the results vary depending on the volume and geometry of the two reactors. Instead of circulating the gas produced, the gas can be taken as
and when it is produced. The cellulose for the experiment can be obtained from various industries. The recuperation of the alumina balls used should be investigated.
References
[1] S. Zafar, Importance of Biomass Energy, Bioenergy consult webpage, April 2014.
http://www.bioenergyconsult.comla-glance-at-biomass-energy/
[2]Natural Resources Canada; Biomass-bioenergy-bioproducts. http://www.nrcan.gc.ca/forests/industrylbioproductsIl3315/
[3] Natural Resources Canada; forests.
http://www.nrcan.gc.ca/forests/
[4] Marco Aurelio dos santa bemardes, Biofuel Mandate from lignocellulose materials in the United States Renewable Fuels Standard, Biofuels Engineering Process Technology, 2011,
ISBN 978-953-307-480-1.
[5] Timothy Lipman, An overvlew of hydrogen production and storage systems with renewable hydrogen case studies. Clean Energy States Alliance Report, Renewable Energy Fuel Cell Technologies Program, US DOE, May 2011.
[6] NASA; c1imate change and global wanning http://c1imate.nasa.gov/news/2293/
[7] Climate change infonnation from United states Environmental Protection Agency;
http://www.epa.gov/c1imatechange/science/causes.html
[8] Debabrata Das, Hydrogen production by biological processes: a survey of literature. Int. J. Hydrogen Energy; 2001; 26; 13-28.
[9]Hydrogen production from renewable sources: biomass and photocatalytic opportunities R. M. Navarro, M. C. Sanchez-Sanchez, M. C. Alvarez-Galvan, F. deI Valle and J. L. G. Fierro
EnergyEnviron.Sci.,2009,2,35-54.
[10] International Energy Agency; Bioenergy.
http://www.ieabioenergy.com/task/thermal-gasification-of-biomass/
[Il] Kirk-Othmer, 1980; Boyles, 1984
[12] Reginaldo et al., Braz.]; plant physio; 2007. vol.19 no.l.
[13] Davda, R.R. and Dumesic, J.A. Renewable Hydrogen by Aqueous-Phase Reforming of Glucose. Chemical Communication, 2004, Issue 1,36-37.
[14] Tanksale, A., B eltrami ni , J.N. and Lu, G.M; A Review of Catalytic Hydrogen
Production Processes from Bio- mass. Renewable and Sustainable Energy Reviews, 2009,
14,166-182.
[15] Meryemoglu, B., Hesenov, A., Irmak, S., Atanur, O.M. and Erbatur, O.; Aqueous-Phase Refornling of Biomass, 2010.
[16] Uber den alkalischen Abbau von Polysacchariden 1. Mitteil.: Abbau von Baumwoll
hydrocellulose; Richtzenhain, H. and Lindgren, B.O. and Abrahamsson, B. and Holmberg, K.
ln: Svensk Papperstidning. -57(1954)10. - pp. 363-366
[17] The alkaline degradation of polysaccharides. Part II. The alkali-stable residue from the
action of sodium hydroxide on cellulose. Machell and G. N. Richards; 1. Chem. Soc., 1956,
4500-4506.
[18].Kinetic Study on the Alkaline Degradation of Cotton Hydrocellulose; Donald w. Haas, Bjorn f. Hrutfiord, and k. v. Sarkanen; Journal of applied polymer science, 1967, vol. Il, pp.
587-600
[19]Minoru Ishida, Sakae Takenaka, Ichiro Yamanaka, and Kiyoshi Otsuka, Production of COx-Free Hydrogen from Biomass and NaOH Mixture: Effect of Catalysts, Energy & Fuels
![Figure 1.1: Production of cellulosic biofuel vs other biofueJ [4].](https://thumb-eu.123doks.com/thumbv2/123doknet/14617276.733244/13.918.187.727.543.814/figure-production-cellulosic-biofuel-vs-biofuej.webp)
![Table 2.1: Typical composition ofbiomass [11].](https://thumb-eu.123doks.com/thumbv2/123doknet/14617276.733244/17.918.243.689.196.512/table-typical-composition-ofbiomass.webp)
![Figure 2.1: Cellulose degradation [12].](https://thumb-eu.123doks.com/thumbv2/123doknet/14617276.733244/18.918.182.752.270.574/figure-cellulose-degradation.webp)
![Table 2.2: Desirable properties of partic1es and gas for fluidized bed-Design of Fluidised Bed Reactor [21]](https://thumb-eu.123doks.com/thumbv2/123doknet/14617276.733244/24.918.180.772.279.560/table-desirable-properties-partic-fluidized-design-fluidised-reactor.webp)
![Figure 2.3: Fluidization vessel [22].](https://thumb-eu.123doks.com/thumbv2/123doknet/14617276.733244/26.918.389.610.151.429/figure-fluidization-vessel.webp)