HAL Id: tel-01822411
https://tel.archives-ouvertes.fr/tel-01822411
Submitted on 25 Jun 2018HAL is a multi-disciplinary open access archive for the deposit and dissemination of sci-entific research documents, whether they are pub-lished or not. The documents may come from teaching and research institutions in France or abroad, or from public or private research centers.
L’archive ouverte pluridisciplinaire HAL, est destinée au dépôt et à la diffusion de documents scientifiques de niveau recherche, publiés ou non, émanant des établissements d’enseignement et de recherche français ou étrangers, des laboratoires publics ou privés.
Elucidating the genetic basis of variation in populations
by large scale phenomics and genomics
Johan Henning Hallin
To cite this version:
Johan Henning Hallin. Elucidating the genetic basis of variation in populations by large scale phe-nomics and gephe-nomics. Populations and Evolution [q-bio.PE]. Université Côte d’Azur, 2018. English. �NNT : 2018AZUR4010�. �tel-01822411�
Johan HALLIN
CNRS UMR7284 -
Population genomics and complex traits -
Inserm U1081
Elucider les facteurs génétiques à
l'origine de la variabilité des populations
par phénomique et génomique de masse
Présentée en vue de l'obtention du grade de docteur en Sciences d'Université Côte d'Azur
Dirigée par : Gianni Liti Soutenue le : 22 Mars 2018
Devant le jury, composé de :
Etienne Danchin, Directeur de Recherche, Institut National de la Recherche Agronomique, Daniela Delneri, Proffeseur,
The University of Manchester
Bertrand Llorente, Directeur de Recherche, Le Centre de Cancérologie de Marseille
Gianni Liti, Directeur de Recherche,
Elucider les facteurs génétiques à
l'origine de la variabilité des populations
par phénomique et génomique de masse
Jury :
Etienne Danchin, Directeur de Recherche, Institut National de la Recherche Agronomique Président du jury
Daniela Delneri, Proffeseur, The University of Manchester
Bertrand Llorente, Directeur de Recherche, Le Centre de Cancérologie de Marseille Rapporteurs
Etienne Danchin, Directeur de Recherche, Institut National de la Recherche Agronomique Examinateur
Résumé
L
a variabilité phénotypique existante au sein d’une population est d’une im-portance cruciale ; elle permet l’adaptation à de nouvelles conditions par la sélection naturelle de traits bénéfiques. La variabilité phénotypique est le résultat du polymorphisme génétique de chaque individu, couplé à l’influence de divers facteurs environnementaux. Ces travaux ont pour objectif d’élucider quels sont les facteurs génétiques responsables de la variabilité phénotypique de chaque individu afin de comprendre comment celle-ci évolue de génération en génération et peut s’accentuer au-delà des prédispositions parentales. Finalement, les résultats obtenus seront utilisés pour prédire un phénotype à partir d’un génotype inconnu. Nous avons utilisé des techniques de phénomique et de génomique de haut débit pour décomposer avec une précision inédite la variabilité phénotypique d’une large population de souches diploïdes de Saccharomyces cerevisiae. Le génotype exact deplus de 7000 souches uniques a ainsi été obtenu via le croisement et le séquençage de souches haploïdes distinctes. Nous avons mesuré la capacité de croissance de ces souches et identifié les composants génétiques influant sur ce trait. De plus, nous avons identifié des «loci de caractères quantitatifs» additifs et non-additifs, et étudié la fréquence du phénomène d’hétérosis et ses mécanismes. Enfin, en utilisant les données phénotypiques et génotypiques de la même population de levures, nous avons pu prédire les traits de chaque individu avec une presque parfaite exactitude. Ces travaux ont ainsi permis d’identifier avec précision les facteurs génétiques mod-ulant la variation phénotypique d’une population diploïde, et de prédire un trait à partir du génotype et de l’ensemble des données phénotypiques. En plus de ce pro-jet, nous travaillons aussi sur l’identification des bases génétiques à l’origine de la non-viabilité des gamètes, ainsi que sur la compréhension des caractères complexes chez des souches hybrides intra-espèce. De par l’étude de 9000 gamètes séquencés issus de six hybrides di↵érents, nous avons pour objectif de caractériser leur pro-fil de recombinaison et d’observer quelle est l’influence du fond génétique sur ce dernier. De plus, nous avons caractérisé la capacité de croissance de ces gamètes dans neuf conditions environnementales di↵érentes et nous prévoyons de disséquer l’architecture génétique de ces traits dans di↵érents fonds génétiques.
Mots-clés. Caractères quantitatifs, variation génétique, épistasie, hétérosis, prédictions.
Abstract
T
he phenotypic variation between individuals in a population is of crucial im-portance. It allows populations to evolve to novel conditions by the natural selection of beneficial traits. Variation in traits can be caused by genetic or environmental factors. This work endeavors to study the genetic factors that under-lie phenotypic variation in order to understand how variation can be created from one generation to the next; to know what genetic mechanisms are most prominent; to learn how variation can extend beyond the parents; and finally, to use this in order to predict phenotypes of unknown genetic constellations. We used large scale phe-nomics and gephe-nomics to give an unprecedented decomposition of the phenotypic variation in a large population of diploidSaccharomyces cerevisiae strains.Construct-ing phased outbred lines by large scale crosses of sequenced haploid strains allowed us to infer the genetic makeup of more than 7,000 colonies. We measured the growth of these strains and decomposed the phenotypic variation into its genetic compo-nents. In addition, we mapped additive and nonadditive quantitative trait loci, we investigated the occurrence of heterosis and its genetic basis, and using the same populations we used phenotypic and genetic data to predict traits with near per-fect accuracy. By using the phased outbred line approach, we succeeded in giving a conclusive account of what genetic factors define phenotypic variation in a diploid population, and in accurately predicting phenotypes from genetic and phenotypic data. Beyond the phased outbred line project, I am currently investigating the ge-netic basis of gamete inviability and complex traits in intraspecies yeast hybrids. Using 9,000 sequenced gametes from six di↵erent hybrids we aim to characterize their recombination landscape and how the genetic background influences it. Fur-thermore, we have phenotyped these gametes in nine conditions and will dissect the genetic architecture of these traits across multiple genomic backgrounds.
Keywords. Quantitative traits, genetic variation, epistasis, heterosis, predictions
Acknowledgments
I
am of the opinion that we are all sim-ply the result of our genome and its interactions with the environment. I was fortunate enough to be born with a genome and into an environment where I could pursue my academic career all the way to the end of this PhD. The list of con-tributors to both my genetic makeup and environment interactions could be made comically long. However, here I will stick to the most obvious genetic contributors and the more prominent human-human in-teractions.First and foremost, I would like to thank Gianni for taking me in in 2014 for what started as a six month internship and ended four years later in this PhD. Thank you for leading me through my PhD, for trusting me to manage large projects, and finally for your open door and open mind.
Jonas, thank you for introducing me to the world of research, and for introducing me to Gianni. But most of all, thank you for your continued mentoring and guidance. For the work presented in this thesis, I would especially like to thank Leo and Kas-par for the QTLs and predictions, Alex for the variance decomposition and Martin for Scan-o-matic.
Thank you Labex Signalife for the funding (ANR-11-LABX-0028-01).
To all my fantastic team members, I think you know that I would, literally, not have survived here in Nice without you. A spe-cial mention has to go to Agnès, who has helped me so much during my years in Nice that it borders on embarrassing. And thank you Ben for helping me with the French parts of this thesis.
I’d also like to thank my friends: the old who tirelessly saves a place for me in Swe-den, and the new who have created a home for me in France.
María Isabel Acósta Lopez, thank you for your unwavering love and support. And, equally important, thank you for challeng-ing me, complementchalleng-ing me and for some-how being exactly what I need regardless of what it might be and whether I know it or not.
To my family, min familj som jag älskar, min familj som jag litar på, min familj som jag stödjer mig mot, min familj som inspir-erar mig, min familj som jag saknar, min familj som jag har saknat och min familj som jag kommer sakna tills jag får vett nog att komma hem igen.
Contents
Acknowledgments Foreword 1 1 Genotype to phenotype 3 1.1 Heritability . . . 3 1.2 Complex traits . . . 41.3 Quantitative trait loci . . . 5
1.3.1 Recombination. . . 5
1.3.2 Association-based mapping . . . 6
1.3.3 Linkage-based mapping . . . 7
1.3.4 Sample size . . . 9
1.4 Predicting phenotypes from genotypes . . . 10
1.5 Missing heritability . . . 10
2 Hybrids and heterosis 15 2.1 The use of hybrids . . . 15
2.2 Heterosis . . . 16
2.3 Dominance & overdominance . . . 17
3 On the use of yeast 23 3.1 The model . . . 23
3.2 Natural variation . . . 25
3.3 Phenotyping yeast . . . 25
3.4 QTL mapping in yeast . . . 26
3.4.1 Classical QTL mapping. . . 26
3.4.2 Bulk segregant analysis . . . 28
3.4.3 Crossing schemes . . . 29
3.5 Decomposition of genetic components . . . 30
3.6 Predicting traits in yeast . . . 31
3.7 Heterosis in yeast . . . 32
Articles and ongoing project 39
4 Powerful decomposition of complex traits in a diploid model 41 5 Predicting quantitative traits from genome and phenome with near perfect
accuracy 63
6.1 Project summary . . . 82
6.2 Parental strains . . . 82
6.3 Gamete acquisition . . . 83
6.4 Image analysis . . . 84
6.5 Large scale DNA extraction. . . 85
6.6 Growth phenotyping . . . 85
6.7 Genotyping and recombination landscape . . . 86
6.8 Calling aneuploidies . . . 87
6.9 Preliminary results . . . 88
6.9.1 Spore viability and colony size. . . 88
6.9.2 Viability and genetic distance . . . 89
6.9.3 Aneuploidies. . . 90
6.10 Perspectives . . . 90
7 Discussion and perspectives 95 7.1 A QTL mapping population . . . 95
7.2 Contributions to heterosis . . . 96
7.3 Closing remarks . . . 98
Figures
1 Propagation of variation in publications . . . 1
1.1 Charles Robert Darwin . . . 3
1.2 Alfred Russel Wallace . . . 3
1.3 Components of genetic variance . . . 4
1.4 Mendelian and complex traits . . . 5
1.5 QTL mapping in practice . . . 7
1.6 QTL mapping and significance testing . . . 7
2.1 O↵spring phenotype distribution . . . 16
2.2 Dominance and overdominance . . . 17
3.1 The facets of fungi . . . 23
3.2 S. cerevisiae species tree . . . 24
3.3 Sequencing cost . . . 25
3.4 Growth curves . . . 26
4.1 An experimental framework for analysis of diploid traits. . . 43
4.2 Near complete variance decomposition of diploid traits . . . 46
4.3 Cost-efficient QTL mapping in yeast POLs . . . 47
4.4 Explaining heterosis by intralocus interactions . . . 49
5.1 Experiment population . . . 65
5.2 Prediction accuracy . . . 66
5.3 Close relatives improve predictions . . . 68
5.4 Causes of improved prediction performance for close relatives . . . 70
5.5 Prediction performance is similar for a range of model classes . . . 71
6.1 Image analysis pipeline . . . 84
6.2 Germination phenotypes . . . 88
6.3 Divergence and viability . . . 90
6.4 Chromosome size, hybrids and aneuploidies . . . 91
Foreword
I
t is easy to imagine how the great vari-ation on earth has long been appre-ciated by mankind. From the vast amount of species of plants, each with a unique flower, to all animals and insects. From mammal to microbe, there is scarcely an inch on this earth not inhabited, from smoldering volcanoes to the icy plains of Greenland.Variation between species is all well and good, but the variation within a species was not always held in such a high regard as it is today. In Plato’s dialogs, Socrates argued that there was but one true form and the variation around it was but cheap and ill-fated attempts to capture the true form. However, in the days of Charles Dar-win and his contemporaries, variation was given a clear function.
The study of variation has increased in popularity over the years. In fact, a quick search on Pubmed reveals that the fraction of publications mentioning variation in ei-ther the title or abstract has been going up steadily since the 70’s. (Fig. 1). This does, however, refer to variation in general, not exclusively to the study of variation in genotypes and phenotypes. Nevertheless, variation seems to be gaining recognition in the scientific community.
In this thesis, the first three chapters will give you a general introduction to the field of quantitative genetics, a powerful tool to study the link between phenotypic and genotypic variation. I will cover the basics of inheritance of complex traits, how we
can find loci in the genome that contribute
2% 1% 0% 1970 Year 2017 Figure 1.Propagation of variation in publications. The mention of variation has been going up steadily over the years
to the variation in a population, and how to predict the phenotypes of individuals. We will also look at how phenotypes are modu-lated by genetic mechanisms, and how they can give phenotypes that are more extreme from one generation to the next.
Accompanying this thesis are two articles both published in 2016 inNature Commu-nications. These are the main articles of
this thesis and constitute the main body of my work. Each of them contain their own introduction, putting the work into a more specific context than I do in the first three chapters. After this there is a chapter on the work I am currently do-ing and have been dodo-ing since my arti-cles were published. This is an ongoing project and mostly discusses methodology as well as some preliminary results. Lastly, I extend the discussion from the articles, adding some thoughts about the mapping population and heterosis analysis.
But before we get started, a quote from Al-fred Russel Wallace’s “On the Law Which Has Regulated the Introduction of New Species”, worthy of thought when we are quick to divide and slow to unite.
The great gaps that exist between fishes, reptiles, birds, and mammals would then, no
doubt, be softened by intermediate groups, and the whole organic world would be seen to
be an unbroken and harmonious system.
Chapter
1
Genotype to phenotype
T
his chapter will introduce the con-cept of phenotypic and genetic variation, and how they are inte-grally related in a complex way. The com-plexity of this relationship is what my the-sis tries to unravel. I will discuss how the genome can influence, as well as predict, phenotypes.Variation is a key feature in natural popu-lations, it gives natural selection something to act on, making it completely essential for life as we know it to have evolved. Al-though Charles Darwin (Fig. 1.1) makes no mention of it in the title of his iconic book
On the origin of species - by means of natural selection, Alfred Russel Wallace (Fig. 1.2), independent co-discoverer of evolution by natural selection, gave credit to variation in naming his paper On the tendency of vari-eties to depart indefinitely from the original type. Understanding the genetic basis of
complex phenotypic variation has been – and still is– a goal of the natural sciences. Knowledge of this relationship will aid in, for example, predicting disease risk and breeding desirable traits in crops (Mackay et al.,2009). It has, however, been difficult to assess the genetic contributions to varia-tion.
1.1 Heritability
Variation in a phenotypic trait can have
Figure 1.1.Charles Robert Darwin, author of the groundbreaking book
On the origin of species - by means of natural selection,
laying the foundation for modern biology.Image source.
Figure 1.2.Alfred Russel Wallace, independent co-discoverer of evolution by natural selection.
Image source.
di↵erent sources, which constitutes one of the difficulties in knowing the genetic con-tribution. The amount of a population’s variation in a trait that can be attributed to the genome is called heritability. Her-itability is important, for example, when you want to select for a specific trait; if you want to select (through breeding) your
Heritability. The fraction of phenotypic variance in a population that can be attributed to genetic variation.
cows to have more milk production, you would first want to know how much of the variation in the milk production is due to di↵erences in the genome. If most of the variation is due to the environment, your e↵orts would be of more use optimizing that.
The heritability of a trait is not static, it can vary over time and place (Klug et al.,2009). If the environmental variation for a pop-ulation is low, then the genome will have a stronger relative e↵ect. The total phe-notypic variance in a population (Vt) can be expressed as the environmental variance (Ve) and the genetic variance (Vg).
Vt = Ve+ Vg
Chapter 1. Genotype to phenotype Additive AA Aa aa Phenot ype BB Bb bb Epistasis AA Aa aa Phenot ype BB Bb bb Dominance AA Aa aa Phenot ype BB Bb bb
Figure 1.3. Components of genetic variance. This schematic shows the concept behind the dif-ferent kinds of genetic components that make up the total genetic contribution (Vg) to the
phe-notypic variance of a population (Vt). Additive e↵ects are the fixed e↵ects that alleles contribute
with, which are independent of the allele compositions at other loci. I.e. for a completely addi-tive trait, the heterozygote (Aa or Bb) will have a phenotypic e↵ect that equals the mean of the two homozygotes (AA and aa, or BB and bb), and the e↵ect of either locus is independent of the genotype at the other locus. Epistasis or an epistatic interaction is when the e↵ect of a locus is dependent on the genotype at a second locus. The figure represents the most simple interaction containing only two loci, where the e↵ect of the a allele is enhanced with increasing numbers of the b allele at another locus. Finally, Dominant e↵ects are the deviations from the additive within a locus, such that the heterozygote does not equal the mean of the two homozygotes. In this example the B locus has a dominant e↵ect while the A locus is completely additive.
The genetic contribution to the phenotypic variation is called broad sense heritabil-ity, and can similarly be decomposed, such that:
Monozygotic. Twins that spawn from the same zygote. Dizygotic. Twins that spawn from di↵erent zygotes.
Vg= Vg,a+ Vg,d+ Vg,i
Complex traits. An observable trait that has two or more genes modulating it.
where Vg,ais additive variance, Vg,d is dom-inant variance and Vg,i is interaction vari-ance. These concepts are explained in more detail in figure 1.3. The contribution of the additive component to phenotypic vari-ation is called narrow sense heritability. In humans, narrow sense heritability is commonly estimated by twin studies. In a classical twin study, comparing the
pheno-typic similarity of monozygotic twins (MZ) and dizygotic (DZ) twins gives an estimate of the heritability of that trait. The heri-tability is calculated as twice the di↵erence between the correlation of the MZ twins and the DZ twins (Boomsma et al., 2002). E.g. if the correlation of MZ twins for a given trait is 0.6, and 0.3 for the DZ twins, then the heritability would be (2(0.6 − 0.3)) 60%.
1.2 Complex traits
Complex traits (or quantitative traits) lie at the heart of quantitative genetics, the field of genetics which is concerned with explaining the genetic background to
Chapter 1. Genotype to phenotype Complex Mendelian Phenotypes Loci controlling the phenotype Phenotype Phenotype Fre quency Fre quency
Figure 1.4. Mendelian and complex traits. A complex trait is controlled by several loci ( ), creating a continuous distribution of phenotypes in the population. In contrast, a Mendelian trait is controlled by one gene, and because of this the phenotypic distribution of the population will be bimodal, given that there are two variants of this gene. This occurs in diploid populations when one variant is dominant over the other. I.e. even though there are four di↵erent possible genotypes at the given locus, there are only two possible phenotypes.
tion in traits. A complex trait is any observ-able trait that has a large variation within individuals of a population and is modu-lated by two or more genes, giving the trait a continuous distribution. A classical ex-ample of a complex trait is height in hu-mans. A trait (or phenotype) that, by the way, has a quite high heritability (around 80% (Silventoinen et al.,2003)).
This is in contrast to Mendelian traits (or monogenic traits) (Fig. 1.4), where the phe-notype is modulated by a single gene. How-ever, monogenic traits may not be as sim-ple as they seem.Sirr et al.(2015) find that even a seemingly monogenic trait can have genetic and/or nongenetic modifiers. Any given complex trait is modulated by many genes in intricate networks and her-itability can answer what portion of vari-ation in the complex trait is defined by di↵erent genetic components, but we also want to know what specific sites in the genome a↵ect the phenotype.
1.3 Quantitative trait loci
Phenotype. The
phenotype of an organism is its collected set of traits, however, it is often used synonymously with trait, and will be used as such throughout this thesis.
A Quantitative Trait Locus (QTL) is, as its name suggests, a place in the genome that contributes quantitatively to a partic-ular trait. The field of genetics has come a long way in locating these loci thanks to the fact that factors controlling phenotypes (genes) co-segregate with the phenotypes.
QTLs can be located using two di↵erent QTL. A locus in the genome that contributes to the variation of a trait
methods, i) association-based mapping, or ii) linkage-based mapping, which will be
discussed insection 1.3.2andsection 1.3.3 The power and resolution with which we locate QTLs are highly dependent on the sample size of your mapping population, and on the amount of recombination that you have between the individuals of the population.
1.3.1 Recombination
QTL mapping is wholly dependent on re-combination. Recombination was
Chapter 1. Genotype to phenotype
posed by Morgan (1911), to explain the
Crossover. Reciprocal exchange of genetic material between the two homologous chromosomes (Whitby,2005).
mystery of some traits being coupled and others segregating randomly. His student,
Sturtevant(1913) went on to create the first ever genetic map, using the theory laid down byMorgan(1911).
Non-crossover. nonreciprocal short length exchange of genetic material between the two homologous chromosomes (Whitby,2005).
Recombination is initiated by double-strand breaks during prophase of meio-sis I (Keeney et al., 1997), these breaks can subsequently be repaired by using the sister chromatid or homologous
chromo-Marker. An identifiable position in the genome that di↵ers between the parents of a cross. This can be genotyped to know which parent contributed with the stretch of DNA that covers the marker.
some as a template. The recombination re-sults in gene conversion associated to either a crossover or a non-crossover (Whitby,
2005).
During meiosis, there is a bias for using the homologous chromosome for repairing the double-strand breaks (Haber et al., 1984). Repairing double-strand breaks during
mi-GWAS. A method to find locations in the genome that contribute to the variation of a trait in natural populations.
tosis, however, is biased to using the sis-ter chromatid as a template which does not result in any change of genetic material since the two sister chromatids are identi-cal (Fabre et al.,1984;Kadyk and Hartwell,
1992). The di↵erent bias in mitotic and meiotic recombination could be explained by the use of di↵erent recombination path-ways (Schwacha and Kleckner,1997). The recombination landscape of S. cere-visiae was described in great detail by
Mancera et al. (2008), mapping both
crossovers and non-crossovers genome wide. They genotyped the four haploid spores from 51 meioses resulting from the sporulation of a hybrid between S288C (a lab strain) and YJM789 (derived from a clinical isolate (Wei et al., 2007)). By using ⇠52,000 markers they could give
a detailed view of crossovers and non-crossovers since every event would likely be covered by several markers (median marker distance, 78bp).
They find on average 90.5 crossovers and 46.2 non-crossovers, however, they esti-mate that they missed ⇠30% of the non-crossovers and increase the number to 66.1.
Mancera et al. (2008) defined recombina-tion hotspots as regions involved in more recombination events than expected by chance. 179 such regions were found, and corroborating previous studies, 84% of them overlap a promotor. Promotor re-gions are known to host most of the double-strand breaks during meiosis (Baudat and Nicolas,1997;Gerton et al.,2000), and cor-relate well with recombination events even between di↵erent strains (Buhler et al.,
2007;Mancera et al.,2008).
QTL mapping makes use of recombination to break the linkage between markers and loci in the genome that contribute to the variation of a trait.
1.3.2 Association-based mapping
An association-based QTL mapping exper-iment makes use of recombination that has occurred through-out history. It is used for natural populations and is generally called Genome Wide Assocation Studies (GWAS). GWAS takes advantage of histor-ical recombination events within a popula-tion. Due to the large amount of recombi-nation events that have occurred in a natu-ral population through-out evolution, the genome has been shu✏ed to a very high
Chapter 1. Genotype to phenotype
Phenotypes
Genotypes
Parents Hybrid Segregants Mapping
Phenot ype A a Phenotype Fre quency Result casual variant
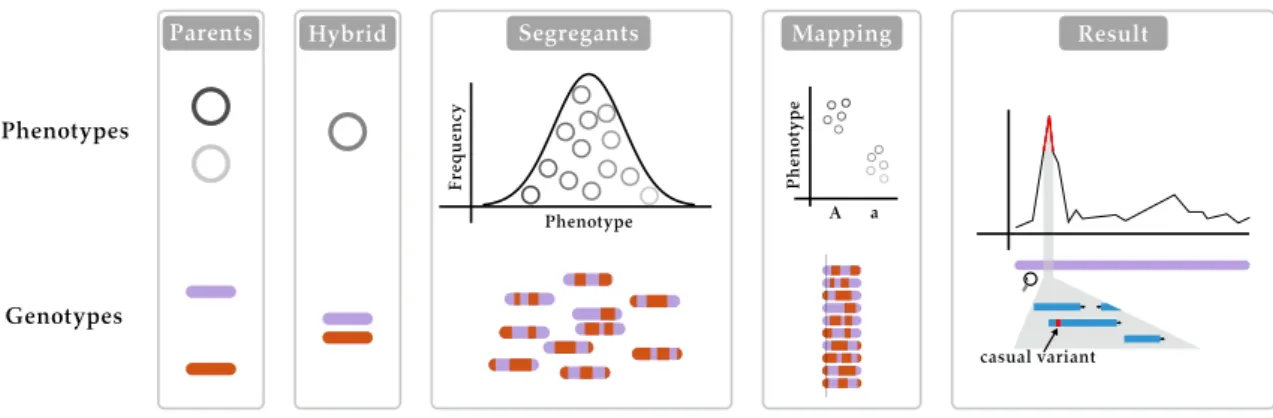
Figure 1.5.QTL mapping in practice. Linkage-based QTL mapping starts with a cross between two (or more) parents, creating a hybrid that has a phenotype which is (usually) intermediate of the two parents. In the case of yeast, the hybrid is sporulated and haploid segregants are isolated. These segregants are phenotyped and genotyped, once this is done the QTL mapping can start by using the genetic markers in the genome and sorting the segregants’ phenotypes according to their genotype at the given marker. This is done at every marker in the genome to create a QTL map where some regions of the genome give a significant signal, meaning that those regions have an e↵ect on the phenotype that reaches above the noise. These regions can then be further investigated to find the casual variant(s).
degree, unlinking all but the closest mark-ers from the causal locus. Thanks to this, GWAS can locate causal loci with high pre-cision (Mackay et al.,2009).
The association-based QTL mapping does, however, su↵er from a few limitations. One being that GWAS experiments have low power to detect rare variants that have an e↵ect on the phenotype (Visscher et al.,
2012). And in the context of S. cerevisiae,
GWAS studies will be severely hampered by the strong population structure (Liti and Louis,2012;Strope et al.,2015).
Population structure results in spurious as-sociations of variants to phenotypes due to stratification of the mapping popula-tion (Hamer and Sirota, 2000). In other words, if within your mapping population there are subpopulations, these subpopu-lations may di↵er in their allele frequen-cies and also, coincidentally, di↵er in their
phenotype levels. This means that ants not actually contributing to the vari-ation in a phenotype can be associated to it (Hamer and Sirota,2000;Marchini et al.,
2004). Linkage-based QTL mapping gener-ally does not have this caveat, since they are based on experimental crosses. However, in (Hallin et al.,2016) we experience popula-tion structure due to the crossing scheme of the phased outbred lines (seechapter 4).
Phenot ype A a Marker 1 Phenot ype A a Marker 2 Figure 1.6. QTL mapping and significance testing. Significance tests between the two populations, one for each genotype, distinguishes between markers with (marker 1) and without (marker 2) association to a causative locus.
1.3.3 Linkage-based mapping
A linkage-based QTL mapping experiment will start with a cross (Fig. 1.5). It uses the same underlying theory as
association-based mapping, but since there is no his- Causal. Refers to something that gives the actual e↵ect, for example, causal locus, causal SNP or casual marker.
torical recombination in the mapping ulation (since it does not use natural pop-ulations), it has to be created through the crossing. You choose two parents that di↵er in your phenotype of interest (e.g. pollen
Chapter 1. Genotype to phenotype
shape in the sweet pea) and that contain di↵erences in the genome. You cross them together and use their progeny to locate regions in the genome that contribute to the di↵erences between the progeny phe-notypes. This is the type of mapping that I will be focusing on through-out the thesis, and I will from here on use the term linkage-based mapping interchange-ably with QTL mapping.
Since linkage-based QTL mapping con-structs its own mapping population, clas-sically from a two-parent cross, it does not su↵er from the problem of rare vari-ants. All alleles are expected to be at a 50% frequency, and can thus be detected, even though they may represent a low fre-quency allele in the natural variation of the species as a whole (Parts,2014). Addition-ally, using model organisms to construct the mapping population means that the phenotypes can be measured under con-trolled conditions with little environmen-tal variation confounding the results. How-ever, the mapping population will not con-tain as many recombination events, and so the resolution of the mapping su↵ers. The statistical methods used in linkage-based mapping to find QTLs can vary in complexity. The most simple one, and the one used in the paperPowerful decompo-sition of complex traits in a diploid model, is the marker regression method. The sim-plicity of this method lies in the fact that it only uses the positions in the genome where you have marker data (Broman and Sen, 2009). At each marker it sorts the phenotypes of your samples depending on
their genotype at the marker, as in figure 1.6. QTL mapping is a constantly evolv-ing technique, for example, a recent devel-opment has made use of the Crispr Cas9 system but it was more than one hundred years ago that the theoretical foundation of QTL mapping was laid.
In 1904, Bateson, Saunders and Punnett (Bateson et al.,1904) publish their findings from experiments in the sweet pea ( Lath-yrus odoratus). They find deviations from
expected Mendelian segregation of traits, and they propose that the factors control-ling the two phenotypes they are investi-gating (pollen shape and color) are cou-pled. They write: “There is, therefore, some coupling of pollen shape and colours”. The
nature of this coupling would remain un-known until 1911 when Thomas Hunt Mor-gan suggests that the factors (or genes) controlling traits are physically located on chromosomes (Morgan, 1911). With this, 32 years after Walther Flemming had dis-covered the chromosome (Flemming,1878;
Paweletz, 2001), there was no question as to the function of chromosomes; propagat-ing genes to the next generation. A theory that had been outlined by Theodor Boveri and Walter Sutton in the chromosome the-ory of inheritance a few years earlier (Sutton,
1903). Other accounts of non-Mendelian segregation of traits are later attributed to this linkage between factors that control certain traits (Yuzo,1915;Sax,1923). Capitalizing on the wealth of knowledge that had been built up, Andrew Paterson and his colleagues use Restriction Frag-ment Length Polymorphisms (RFLPs) to get
Chapter 1. Genotype to phenotype
a map of the genome and locate at least 15 QTLs for three phenotypes in an interspe-cific backcross of tomato (Paterson et al.,
1988). By doing this, they set the stage for QTL mapping with the entire genome cov-ered by markers.
In order to locate the specific regions in the genome that are causally a↵ecting the phenotype you need markers that are close enough to the causal locus so that they co-segregate. A dense grid of markers over the entire genome will increase the likelihood that you cover the area with the causal lo-cus. Whole genome sequencing allows you to use all the Single Nucleotide Polymor-phisms (SNPs) between the two parents you have chosen, if these parents are suf-ficiently genetically diverged you will end up with a distribution of markers over the entire genome (Bloom et al., 2013; Hallin et al.,2016).
A dense grid of markers must be comple-mented with a large sample size in order to detect weak e↵ect loci (Bloom et al.,2013). The larger the sample size of your segre-gating population, the more power you will have to detect loci that do not have a very big e↵ect on the phenotype you are vestigating. Steps have been taken to in-crease the power of studies without nec-essarily increasing the genotyping and la-boring cost; such as using bulk segregant analysis coupled with experimental evolu-tion, where selection pressure is inflicted on a large pool of segregant strains and the changes in allele frequencies are mea-sured to find regions that contribute to the adaptation of the pool (Ehrenreich et al.,
2010; Parts et al., 2011); or constructing SNP. A nucleotide position in the genome that di↵ers between two given individuals.
large cross grids where the parents are se-quenced and the progeny mapping pop-ulations genotypes are inferred from the parents (Threadgill et al.,2002;Zou et al.,
2005;Tsaih et al.,2005;Hallin et al.,2016).
1.3.4 Sample size
A limitation common for both association-and linkage-based QTL mapping is the sample size. In order for GWAS to find small e↵ect loci, they continuously increase their sample size, doing meta-analyses cre-ating ever growing mapping populations. For the classical trait of human height, sample size started out at between 10,000 to 20,000 individuals in 2008 (Sanna et al.,
2008;Lettre et al.,2008). In 2010, a meta-analysis increased this number to 183,727 (Lango Allen et al., 2010), and the sam-ple size race culminated with a staggering sample size of 253,288 individuals in 2014 (Wood et al.,2014).
In linkage-based QTL mapping, the impor-tance of sample size was efficiently shown byBloom et al.(2013), where increasing the sample size from 100 to 1,005 increased the amount of QTLs from two to fifteen. The fifteen QTLs found increased the amount of narrow-sense heritability from 21% to 78%, showing that sample size can account for missing heritability (discussed further insection 1.5).
QTL mapping concerns itself with finding the genotypes that are linked to a specific phenotype, but how about finding the phe-notype that is linked to a specific gephe-notype?
Chapter 1. Genotype to phenotype
1.4 Predicting phenotypes from
genotypes
A goal for biology and medicine is to be
For a thought-provoking prediction experiment, readLippert et al.(2017) using genome-wide data to place an individual within the top ten candidates from a 100 person cohort with 88% accuracy. I.e., rather accurately using the genome to identify (or at least narrow down) individuals.
able to predict the phenotype of an indi-vidual given his or her genetic makeup. A natural start to this is to locate the most important regions of the genome, as with the QTL mapping. In humans, linkage-based QTL mapping is not done due to eth-ical and practeth-ical limitations. What can be done are Genome Wide Association Stud-ies.
A large number of phenotypes have had an even larger number of loci associated to
The simple prediction of looking at ones parents vs. the genomic method was tested in a clever study by
Aulchenko et al.(2009), where Sir. Francis Galton (Galton,1886) came out on top.
them using GWAS. And have yielded im-portant insight into the human biology and diseases (Visscher et al., 2012). However, in explaining the phenotypic variation of a population, GWAS often comes up short. If we move back the height in humans. The huge study from 2014 (Wood et al., 2014) used data from over 250,000 individuals and identified a staggering 697 variants in the genome that were significantly associ-ated to height. However, these almost 700 variants only explain 16% of the heritabil-ity.
1.5 Missing heritability
The fact that detected variants have only been able to explain a very small amount of the total genetically determined varia-tion has been called the missing heritabil-ity problem (Maher, 2008). For example, the variants that have been detected for human height do no more in predicting your height than glancing at your parents
does (paraphrasing from Joel Hirschhorn
in (Maher, 2008)). This missing
heri-tability has been elusive and many di↵er-ent –non-mutually exclusive– explanations have been suggested (Maher, 2008; Mano-lio et al.,2009;Zuk et al.,2012).
The large lack of heritability explained by loci that have been found to have a de-tectable e↵ect in height (a very well stud-ied complex trait) highlights the difficulty in using these GWAS results to predict phe-notypes. An approach that holds more promise is to use all the genetic informa-tion available for the populainforma-tion, not only the significantly causal loci. Being able to predict traits without prior knowledge of causal loci can revolutionize many as-pects of biology (Ober et al., 2012). In the study by Ober et al. they perform the first attempt at predicting phenotypes us-ing whole-genome-sequencus-ing data. Al-though their predictive power was rather weak, they make a case for using whole-genome information rather than causal variants. This opinion has been enforced by Makowsky et al. (2011) who evaluated the ability of whole-genome data to aid in predictions, and similarly find that it can indeed improve them. They do, however, show that increasing the training sample or including related individuals may be a bet-ter way of improving the predictive ability. Before this,Yang et al.(2010) try to explain the missing heritability in human height by using a large set of SNPs, and find that 45% of the variation in height can be attributed to these almost 300,000 variants. They go on to conclude that the missing heritability
Chapter 1. Genotype to phenotype
can be explained by variants that have ef-fects too small to be significantly detected, and by incomplete linkage disequilibrium between the loci with an e↵ect and the loci that they have genotyped. The rationale here is that, if there is an incomplete link-age between the genotyped locus and the locus giving the e↵ect, then a variant of the genotyped locus can be associated with many variants of the causal locus, diluting the e↵ect (Visscher et al.,2010).
All in all, it is not clear to what extent phenotypes can be predicted, or where ex-actly the problem lies. Luckily, the the-oretical limits of predicting traits can be tested using model systems where all vari-ation not arising from the underlying ge-netic makeup can be controlled (Märtens et al.,2016).
References
Aulchenko Yurii S, Struchalin Maksim V, et al. Predicting human height by Victorian and genomic methods. European journal of hu-man genetics : EJHG, 17(8):1070–1075, 2009.
Bateson William, Punnett Reginald, and Saun-ders Edith. Experimental studies in the physiology of heredity. Reports to the evo-lution committee of the Royal Society, pages 1–
154, 1904.
Baudat F and Nicolas A. Clustering of mei-otic double-strand breaks on yeast chromo-some III.Proceedings of the National Academy
of Sciences of the United States of America,
94(10):5213–5218, 1997.
Bloom Joshua S, Ehrenreich Ian M, Loo Wes-ley T, Lite Thúy-Lan Võ, and Kruglyak Leonid. Finding the sources of miss-ing heritability in a yeast cross. Nature,
494(7436):234–237, 2013.
Boomsma Dorret, Busjahn Andreas, and Pelto-nen Leena. Classical twin studies and be-yond. Nature reviews. Genetics, 3(11):872– 882, 2002.
Broman Karl W and Sen Saunak. A Guide to
QTL Mapping with R/qtl. Statistics for
Bi-ology and Health. Springer New York, New York, NY, 2009.
Buhler Cyril, Borde Valérie, and Lichten Michael. Mapping meiotic single-strand DNA reveals a new landscape of DNA double-strand breaks in Saccharomyces cerevisiae.PLoS biology, 5(12):e324, 2007.
Ehrenreich Ian M, Torabi Noorossadat, et al. Dissection of genetically complex traits with extremely large pools of yeast segre-gants.Nature, 464(7291):1039–1042, 2010.
Fabre F, Boulet A, and Roman H. Gene con-version at different points in the mitotic cy-cle of Saccharomyces cerevisiae. Molecular
& general genetics : MGG, 195(1-2):139–143,
1984.
Flemming Walther. Zur Kenntnis der Zelle und ihrer Teilung-Erscheinungen.Schriften
des naturwissenschaftlichen vereins für
Schleswig-Holstein, pages 23–27, 1878.
Galton Francis. Regression Towards Medi-ocrity in Hereditary Stature. The Journal of the Anthropological Institute of Great Britain and Ireland, 15:246, 1886.
Gerton J L, DeRisi J, et al. Global mapping of meiotic recombination hotspots and coldspots in the yeast Saccharomyces cere-visiae. Proceedings of the National Academy of Sciences of the United States of America,
97(21):11383–11390, 2000.
Haber J E, Thorburn P C, and Rogers D. Mei-otic and mitMei-otic behavior of dicentric chro-mosomes in Saccharomyces cerevisiae. Ge-netics, 106(2):185–205, 1984.
Hallin Johan, Märtens Kaspar, et al. Pow-erful decomposition of complex traits in a diploid model. Nature Communications,
7:13311, 2016.
Hamer D and Sirota L. Beware the chopsticks gene.Molecular Psychiatry, pages 1–3, 2000. Kadyk L C and Hartwell L H. Sister
chromatids are preferred over homologs
Chapter 1. Genotype to phenotype
as substrates for recombinational repair in Saccharomyces cerevisiae. Genetics, 132(2):387–402, 1992.
Keeney Scott, Giroux Craig N, and Kleck-ner Nancy. Meiosis-Specific DNA Double-Strand Breaks Are Catalyzed by Spo11, a Member of a Widely Conserved Protein Family. Cell, 88(3):375–384, 1997.
Klug William S, Cummings Michael R, Spencer Charlotte A, and Palladino Michael A.
Essen-tials of genetics. Pearson, 7 edition, 2009.
Lango Allen Hana, Estrada Karol, et al. Hun-dreds of variants clustered in genomic loci and biological pathways affect human height. Nature, 467(7317):832–838, 2010.
Lettre Guillaume, Jackson Anne U, et al. Iden-tification of ten loci associated with height highlights new biological pathways in hu-man growth.Nature genetics, 40(5):584–591, 2008.
Lippert Christoph, Sabatini Riccardo, et al. Identification of individuals by trait pre-diction using whole-genome sequencing data. Proceedings of the National Academy
of Sciences of the United States of America,
114(38):10166–10171, 2017.
Liti Gianni and Louis Edward J. Advances in quantitative trait analysis in yeast. PLoS Genetics, 8(8):e1002912, 2012.
Mackay Trudy F C, Stone Eric A, and Ayroles Julien F. The genetics of quantitative traits: challenges and prospects. Nature Reviews Genetics, 10(8):565–577, 2009.
Maher Brendan. Personal genomes: The case of the missing heritability. Nature,
456(7218):18–21, 2008.
Makowsky Robert, Pajewski Nicholas M, et al. Beyond missing heritability: pre-diction of complex traits. PLoS Genetics, 7(4):e1002051, 2011.
Mancera Eugenio, Bourgon Richard, Brozzi Alessandro, Huber Wolfgang, and Steinmetz Lars M. High-resolution mapping of mei-otic crossovers and non-crossovers in yeast.
Nature, 454(7203):479–485, 2008.
Manolio Teri A, Collins Francis S, et al. Find-ing the missFind-ing heritability of complex dis-eases. Nature, 461(7265):747–753, 2009.
Marchini Jonathan, Cardon Lon R, Phillips Michael S, and Donnelly Peter. The effects of human population structure on large ge-netic association studies. Nature genetics, 36:512 EP –, 2004.
Märtens Kaspar, Hallin Johan, Warringer Jonas, Liti Gianni, and Parts Leopold. Predicting quantitative traits from genome and phe-nome with near perfect accuracy. Nature
Communications, 7:11512, 2016.
Morgan Thomas Hunt. Random segregation versus coupling in Mendalian inheritance.
Science (New York, N.Y.), pages 1–1, 1911.
Ober Ulrike, Ayroles Julien F, et al. Using whole-genome sequence data to pre-dict quantitative trait phenotypes in Drosophila melanogaster. PLoS Genetics,
8(5):e1002685, 2012.
Parts Leopold. Genome-wide mapping of cel-lular traits using yeast. Yeast (Chichester, England), 31(6):197–205, 2014.
Parts Leopold, Cubillos Francisco A, et al. Re-vealing the genetic structure of a trait by sequencing a population under selection.
Genome research, 21(7):1131–1138, 2011.
Paterson A H, Lander E S, et al. Resolution of quantitative traits into Mendelian factors by using a complete linkage map of restric-tion fragment length polymorphisms.
Na-ture, 335(6192):721–726, 1988.
Paweletz Neidhard. Walther Flemming: pi-oneer of mitosis research. Nature reviews
molecular cell biology, 2(1):72–75, 2001.
Sanna Serena, Jackson Anne U, et al. Common variants in the GDF5-UQCC region are as-sociated with variation in human height.
Nature genetics, 40(2):198–203, 2008.
Sax K. The Association of Size Differ-ences with Seed-Coat Pattern and Pigmen-tation in PHASEOLUS VULGARIS. Genet-ics, 8(6):552–560, 1923.
Schwacha Anthony and Kleckner Nancy. In-terhomolog Bias during Meiotic Recom-bination: Meiotic Functions Promote a Highly Differentiated Interhomolog-Only Pathway.Cell, 90(6):1123–1135, 1997.
Chapter 1. Genotype to phenotype
Silventoinen Karri, Sammalisto Sampo, et al. Heritability of adult body height: a com-parative study of twin cohorts in eight countries. Twin research : the official
jour-nal of the Internatiojour-nal Society for Twin Stud-ies, 6(5):399–408, 2003.
Sirr Amy, Cromie Gareth A, et al. Allelic vari-ation, aneuploidy, and nongenetic mecha-nisms suppress a monogenic trait in yeast.
Genetics, 199(1):247–262, 2015.
Strope Pooja K, Skelly Daniel A, et al. The 100-genomes strains, an S. cerevisiae resource that illuminates its natural phenotypic and genotypic variation and emergence as an opportunistic pathogen. Genome research,
25(5):762–774, 2015.
Sturtevant Alfred Henry. the linear ar-rangement of six sex-linked factors in drosophila, as shown by their mode of as-sociation. Journal of Experimental Zoology,
14:43–59, 1913.
Sutton Walter. The chromosomes in heredity.
Biological Bulletin, (4):231–251, 1903.
Threadgill David W, Hunter Kent W, and Williams Robert W. Genetic dissection of complex and quantitative traits: from fan-tasy to reality via a community effort.
Mam-malian genome : official journal of the Interna-tional Mammalian Genome Society, 13(4):175–
178, 2002.
Tsaih Shirng-Wern, Lu Lu, Airey David C, Williams Robert W, and Churchill Gary A. Quantitative trait mapping in a diallel cross of recombinant inbred lines. Mam-malian genome : official journal of the Interna-tional Mammalian Genome Society, 16(5):344–
355, 2005.
Visscher Peter M, Brown Matthew A, McCarthy Mark I, and Yang Jian. Five years of GWAS discovery. American journal of human genet-ics, 90(1):7–24, 2012.
Visscher Peter M, Yang Jian, and Goddard Michael E. A commentary on ’common SNPs explain a large proportion of the her-itability for human height’ by Yang et al. (2010). Twin research and human genetics : the official journal of the International Society for Twin Studies, 13(6):517–524, 2010.
Wei Wu, McCusker John H, et al. Genome se-quencing and comparative analysis of Sac-charomyces cerevisiae strain YJM789.
Pro-ceedings of the National Academy of Sciences of the United States of America, 104(31):12825–
12830, 2007.
Whitby M C. Making crossovers during
meio-sis. Biochemical Society transactions, 33(Pt
6):1451–1455, 2005.
Wood Andrew R, Esko Tonu, et al. Defining the role of common variation in the genomic and biological architecture of adult human height. Nature genetics, 46(11):1173–1186,
2014.
Yang Jian, Benyamin Beben, et al. Common SNPs explain a large proportion of the her-itability for human height. Nature genetics,
42(7):565–569, 2010.
Yuzo Hoshino. On the inheritance of the flow-ering time in peas and in rice. The journal of the college of agriculture, Tohoku Imperical University, Sapporo, Japan, pages 1–76, 1915.
Zou Fei, Gelfond Jonathan A L, et al. Quantita-tive trait locus analysis using recombinant inbred intercrosses: theoretical and empir-ical considerations. Genetics, 170(3):1299–
1311, 2005.
Zuk Or, Hechter Eliana, Sunyaev Shamil R, and Lander Eric S. The mystery of missing her-itability: Genetic interactions create phan-tom heritability. Proceedings of the National Academy of Sciences of the United States of America, 109(4):1193–1198, 2012.
Chapter
2
Hybrids and heterosis
H
ybrids are the result of cross-ing any two individuals. Hy-bridization is a vital mecha-nism in the biological world, it creates vari-ation by combining alleles in configura-tions that have not been seen before. A hy-brid might get the best of both parents, or the worst, or will perhaps come out as a perfect midpoint in the continuous pheno-typic distribution that lies between the two parents (Fig. 2.1).This chapter will give an account of the phenotypes of hybrids and how they relate to their parents. The concept of hetero-sis (hybrid vigor) will be discussed as well as what possible mechanisms could cause this.
2.1 The use of hybrids
Perhaps the most famous hybrid is the mule. A cross between a female horse and male donkey, the mule has been known for centuries for its longevity and ability to work on less food (although these traits may have been overrated (Garrett, 1990)). Nevertheless it is a hybrid with a lot of character and history to go with it.
It is not only the mule that is an impor- S. paradoxus.S. cerevisiae’s closest wild relative.
tant agricultural hybrid, the use of maize hybrids between inbred lines went up from 10 to 90% between 1935 and 1939 in Iowa, USA. The increase in yield and uniformity of the plants that came with using hybrids led them to represent the bulk of the maize produced in the USA by 1950 (Crow,1998). Hybridization can also be a force in specia-tion. Leducq et al.(2016) finds an example of a hybrid between two lineages of
Saccha-romyces paradoxus. This hybrid had a
mo-saic genome composed of mostly one par-ent with interspersed islands of the other. It is found in the contact zone of the two parents and exhibits intermediate pheno-types, as well as partial reproductive iso-lation. Leducq et al. (2016) hypothesize that the two parentals had come in con-tact when the glacial ice retreated approxi-mately 10,000 years ago which is when the hybridization would have taken place. The three examples above highlight a very interesting aspect of hybrids: their abil-ity to outperform, or at least perform dif-ferently than, their parents. This can be to the benefit of humans, as in the exam-ple of increased yield of maize. As for the
Chapter 2. Hybrids and heterosis Offspring phenotype distribution pos itiv e m id-p aren t h etero sis nega tive mid -par ent h eter osis best parent heterosis worst paren t heterosis
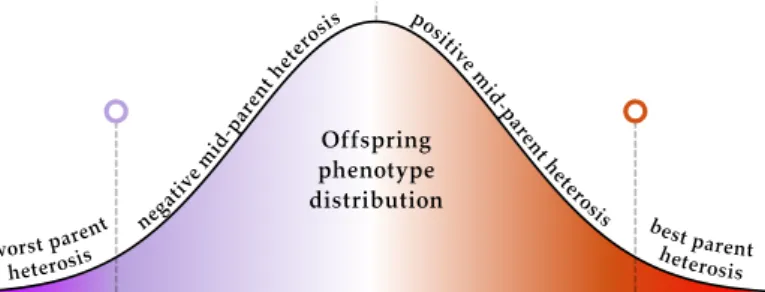
Figure 2.1.Offspring phenotype distribution. How the phenotypes of o↵spring behave are not always straight forward. Most often, they stay within the range of their two parents. In this figure, you see the distribution of phenotypes of o↵spring from the purple and orange parent. The parent phenotypes are flagged in the distribution. When the phenotype of an o↵spring is more extreme than that of either parent, we call it heterosis. Traditionally heterosis has been used only as defining traits where the o↵spring exceeds the two parents, however, I will use it to designate any deviation from the expected middle of the distribution.
mule, Charles Darwin eloquently described his admiration for this famous hybrid in his Diary of the Voyage of H.M.S. Beagle:
The mule always strikes me as a most surprising animal: that a Hybrid should possess far more reason, memory, obstinacy,
powers of digestion & muscular endurance, than either of its parents. – One fancies art
has here out-mastered Nature.
2.2 Heterosis
Charles Darwin found that progeny from hybrid maize were performing better than that of progeny from self-pollinated plants. He stated that o↵spring from hybrid plants have a “greater innate constitutional vigour”
(Duvick, 2001; Darwin, 1876). Tradition-ally, heterosis signifies an o↵spring that has a superior phenotype compared to its two parents, as it was coined by George Harrison Shull in 1914 (Larièpe et al.,
2012;Shull,1914). However, in this thesis and the accompanied article (Hallin et al.,
2016) it will signify any deviation of o↵-spring phenotypes from the immediately intermediate of the two parents (Shapira et al.,2014) (Fig. 2.1).
We designate four di↵erent categories of heterosis as seen infigure 2.1. Worst parent heterosis occurs when the o↵spring has a phenotype that is weaker than the weakest parent, while best parent heterosis is when an o↵spring has a stronger phenotype than that of the strongest parent. Positive and negative mid-parent heterosis are when the o↵spring have a phenotype that lies above or below the exact midpoint of the parents’ phenotypes.
Heterosis has generally been investigated by looking at heterotic heterozygous o↵-spring from crosses of highly homozygous (inbred) parents (Shapira et al.,2014). Un-fortunately, this does not likely reflect how heterosis can impact natural evolution, as organisms are rarely homozygous to such an extent (at least humans (Joshi et al.,
2015)). Albeit, Saccharomyces cerevisiae
presents an exception here, as they are
Chapter 2. Hybrids and heterosis
Phenot
ype
Locus affecting trait
AA Aa Aa aa Dominanc e Ove rdominanc e Pa ren t 1 gen otype Pa ren t 2 gen otype
Figure 2.2. Dominance and overdominance.
A locus can contribute to heterosis in di↵erent ways. A heterozygous locus may cause the phe-notype to resemble one of the parents (dom-inance) or may exceed the phenotype of both parents (overdominance)
often highly homozygous in their natural state (Hansson and Westerberg,2002; Mag-wene et al.,2011;Wang et al.,2012). Heterosis can come as a consequence of dominance, overdominance and epistatic interactions (Shapira et al.,2014;Lippman
and Zamir, 2007). These mechanisms are
not mutually exclusive, but it is not clear which is most prominent. In the section below you will read about the two mech-anisms that holds the focus of my thesis, dominance and overdominance.
2.3 Dominance & overdominance
We defined dominance previously in the heritability section, the only di↵erence is that we are now inspecting how dominance can contribute to heterosis, rather than how it contributes to the overall phenotypic variation. Dominance comes from one al-lele masking the e↵ect of another and has been shown to be quite prevalent in man-made yeast hybrids (Zörgö et al.,2012).
The phenomenon was discovered and coined as dominance by Gregor Mendel (Mendel,1866). In this landmark paper he designates dominance as one parental char-acter completely masking (dominant) the character of the other parent (recessive). Although Mendel was referring to traits be-ing either dominant or recessive, the terms and their definitions are now used for alle-les. His observation of dominance was that of complete dominance, i.e. where the trait of the hybrid was indistinguishable from that of one of the parents. Consequently, his definition of dominance only extended so far, but in this work the definition is ex-tended to include any deviation from the mid-point of the two parents.
The dominance hypothesis posits that a hybrid o↵spring will contain many loci in the genome that has one strong allele and one weak, and that these two would be dominant and recessive, respectively. The strong dominant allele would complement the weak recessive allele, resulting in an o↵spring that is outperforming both par-ents (Bruce, 1910; Crow, 1948). When
Bruce (1910) wrote this there were no ex-perimental evidence to strengthen his as-sumptions, but since then numerous stud-ies have found how dominance can con-tribute to heterosis (Xiao et al., 1995; Gra-ham et al.,1997;Charlesworth and Willis,
2009).
While dominance relies on a number of di↵erent loci being complemented by the two di↵erent parents, overdominance only needs one occurrence to give a heterotic phenotype (Crow, 1948; Shapira et al.,
Chapter 2. Hybrids and heterosis
2014). Overdominance contributing to het-erosis was proposed by East (1908) and it requires a positive interaction between two alleles at the same locus. I.e. the heterozy-gous state of a particular locus is more ben-eficial than the homozygous states of either allele. This is generally called the over-dominance hypothesis.
Overdominance is a tempting explanation to heterosis as it only requires a few or one locus, while dominance requires several loci and, additionally, it depends on each parent having beneficial dominant variants at di↵erent loci that can complement the detrimental variants of the other parent. However, the detection of true overdomi-nant contributions to heterosis can be trou-blesome due to pseudo-overdominance. Pseudo-overdominance occurs when loci linked with the seemingly overdominant locus are in fact the loci that contribute to the phenotype. These loci are linked to the pseudo-overdominant locus and are in re-pulsion, i.e. the beneficial dominant alle-les are coming from di↵erent parents, so combining them can result in a heterotic phenotype, and can give the impression of a locus having an overdominant e↵ect (Charlesworth and Willis,2009).
Several studies in plants have shown over-dominance to be the mechanism by which heterosis occurs, it has been found in for example maize (Stuber et al.,1992), tomato (Semel et al.,2006) and rice (Li et al.,2001;
Luo et al.,2001).
The study by Semel et al. (2006) is based on the inbred Solanum lycopersicum strain
M82. They use 76 strains with the M82 background but each with a segment of
Solanum pennelli (introgressed lines (ILs))
to create heterozygous strains by back-crossing these to M82. By doing this, they have strains that are, in a give segment of the genome, homozygous for S. lycoper-sicum, homozygous for S. pennelli or
het-erozygous. They use this population of strains in order to find how overdominance contributes to heterosis, and they measure 35 traits which they divide into reproduc-tive, intermediate and non-reproductive. They find that traits that are associated to reproduction have a higher amount of over-dominant QTLs than do traits that are non-reproductive. Although their study focuses on overdominance (20% of QTLS), QTLs with a dominant contribution to heterosis (27%) is more prevalant.
Semel et al. (2006) discard
pseudo-overdominance as a confounding factor in their study, but the strongest QTL with a suggested overdominant e↵ect found in the work byStuber et al.(1992) was found to be due to pseudo-overdominance by a subsequent study that fine-mapped this QTL (Graham et al., 1997; Charlesworth and Willis,2009).
It is still not clear what the relative contri-butions of dominance and overdominance are, but the amounting data on the sub-ject seem to be favoring the masking of deleterious recessive alleles, i.e. dominance (Charlesworth and Willis,2009).
Chapter 2. Hybrids and heterosis
References
Bruce A B. The mendelian theory of heredity and the augmentation of vigor.Science (New
York, N.Y.), 32(827):627–628, 1910.
Charlesworth Deborah and Willis John H. The genetics of inbreeding depression. Nature
Reviews Genetics, 10(11):783–796, 2009.
Crow J F. Alternative Hypotheses of Hybrid Vigor. Genetics, 33(5):477–487, 1948. Crow J F. 90 years ago: the beginning of
hy-brid maize., volume 148. Genetics Society of
America, Laboratory of Genetics, University of Wisconsin, Madison 53706, USA., 1998. Darwin Charles. The effects of cross and
self fertilisation in the vegetable kingdom. John Murray, 1876.
Duvick D N. Biotechnology in the 1930s: the development of hybrid maize. Nature
re-views. Genetics, 2(1):69–74, 2001.
East E M. Inbreeding in corn. Reports of
the Connecticut Agricultural Experiment Sta-tion for Years, pages 419–428, 1908.
Garrett Martin A. The Mule in Southern Agri-culture: A Requiem.The Journal of Economic
History, 50(4):925–930, 1990.
Graham Geo↵rey I, Wol↵ David W, and Stu-ber Charles W. Characterization of a Yield Quantitative Trait Locus on Chromosome Five of Maize by Fine Mapping. Crop
Sci-ence, 37(5):1601–1610, 1997.
Hallin Johan, Märtens Kaspar, et al. Pow-erful decomposition of complex traits in a diploid model. Nature Communications,
7:13311, 2016.
Hansson Bengt and Westerberg Lars. On the correlation between heterozygosity and fit-ness in natural populations. Molecular ecol-ogy, 11(12):2467–2474, 2002.
Joshi Peter K, Esko Tonu, et al. Direc-tional dominance on stature and cognition in diverse human populations. Nature,
523(7561):459–462, 2015.
Larièpe A, Mangin B, et al. The genetic ba-sis of heteroba-sis: multiparental quantitative trait loci mapping reveals contrasted levels of apparent overdominance among traits of agronomical interest in maize (Zea mays
L.). Genetics, 190(2):795–811, 2012.
Leducq Jean-Baptiste, Nielly-Thibault Lou, et al. Speciation driven by hybridization and chromosomal plasticity in a wild yeast.
Nature microbiology, 1(1):15003, 2016.
Li Z K, Luo L J, et al. Overdominant epistatic loci are the primary genetic basis of inbreeding depression and heterosis in rice. I. Biomass and grain yield. Genetics,
158(4):1737–1753, 2001.
Lippman Zachary B and Zamir Dani. Hetero-sis: revisiting the magic. Trends in genetics : TIG, 23(2):60–66, 2007.
Luo L J, Li Z K, et al. Overdominant epistatic loci are the primary genetic basis of inbreeding depression and heterosis in rice. II. Grain yield components. Genetics,
158(4):1755–1771, 2001.
Magwene Paul M, Kayıkçı Ömür, et al. Out-crossing, mitotic recombination, and life-history trade-offs shape genome evolution in Saccharomyces cerevisiae. Proceedings of
the National Academy of Sciences of the United States of America, 108(5):1987–1992, 2011.
Mendel Gregor. Versuche über plflanzenhy-briden. Verhandlungen des naturforschenden Vereines in Brünn, 1866.
Semel Yaniv, Nissenbaum Jonathan, et al. Over-dominant quantitative trait loci for yield and fitness in tomato. Proceedings of the Na-tional Academy of Sciences of the United States of America, 103(35):12981–12986, 2006.
Shapira R, Levy T, Shaked S, Fridman E, and David L. Extensive heterosis in growth of yeast hybrids is explained by a com-bination of genetic models. Heredity, 113(4):316–326, 2014.
Shull George Harrison. Duplicate genes for capsule-form in Bursa bursa-pastoris .
Zeitschrift für Induktive Abstammungs- und Vererbungslehre, 12(1):79–149, 1914.
Stuber C W, Lincoln S E, Wol↵ D W, Helentjaris T, and Lander E S. Identification of genetic factors contributing to heterosis in a hybrid from two elite maize inbred lines using molecular markers. Genetics, 132(3):823–
839, 1992.
Wang Qi-Ming, Liu Wan-Qiu, Liti Gianni, Wang Shi-An, and Bai Feng-Yan. Sur-prisingly diverged populations of
Chapter 2. Hybrids and heterosis
charomyces cerevisiae in natural environ-ments remote from human activity.
Molec-ular ecology, 21(22):5404–5417, 2012.
Xiao J, Li J, Yuan L, and Tanksley S D. Domi-nance is the major genetic basis of heterosis in rice as revealed by QTL analysis using molecular markers. Genetics, 140(2):745– 754, 1995.
Zörgö Enikö, Gjuvsland Arne, et al. Life his-tory shapes trait heredity by accumulation of loss-of-function alleles in yeast. Molec-ular Biology and Evolution, 29(7):1781–1789,
2012.
Chapter
3
On the use of yeast
“K
ärt barn har många namn”is a Swedish proverb meaning: “a beloved child has many names”. That certainly holds true for my model organism. Known to some by its latin name, Saccharomyces
cerevisiae, to others by budding yeast, but
surely, to most by bakers’ yeast, or simply, yeast. S. cerevisiae was the first eukaryote to have its genome sequenced in 1996, and has since then firmly asserted its position as a leading model system for genetics and genomics studies. Beyond that, it has made great contributions to practically every field of biology.
In this chapter you will read about yeast as a model in the di↵erent aspects of my work. And also about di↵erent approaches taken in order to dissect the genetic architecture of complex traits using yeast. All concepts discussed here have been explained in the previous chapters.
3.1 The model
Yeast is an umbrella term that contains fungi who reproduce by budding or fission, and do not enclose their sexual states in fruiting bodies (Kurtzman et al.,2011). S.
cerevisiae is a yeast and a unicellular fungus
belonging to the ascomycota clade. Other
ascomycetes are the molds belonging to the
Penicillium genus, famously used to make
antibiotics. The ascomycota is one of the two clades that the fungi have been divided into. The other one, basidiomycota, is the
one that you might think of when you hear the word fungus (Fig. 3.1).
Figure 3.1.The facets of fungi. Fungi come in many di↵erent shapes and sizes. Here you find a fungi from the
basidiomycota (above) as
well asS. cerevisiae with
the cell wall stained with calcoflour-white and expressing red fluorescent protein, representing the ascomycota (below, taken fromLiti(2015)).
In the 1930’s, the Danish geneticist Øjvind Winge at the Carlsberg laboratory in Copenhagen, Denmark, arguably initiated the field of yeast genetics with his work on alternation of generations and ascospores (Barnett,2007).
On the 24th of April, 1996, S. cerevisiae
was the first eukaryote to have its whole genome sequence released. The associated publication found a genome that is much more condensed than in other eukaryotes (e.g. the nematodeC. elegans and humans)
potentially containing 5885 protein coding genes (Go↵eau et al.,1996).
But yeast has long had a life outside the lab. Possibly originating in China, it can be found all around the world and exists in a multitude of ecological niches (Liti et al.,2009;Liti,2015). S. cerevisiae
Chapter 3. On the use of yeast
Figure 3.2.S. cerevisiae species tree. This is the species tree ofS. cerevisiae published byLiti et al.
(2009). By sequencing the genome of 38 yeast strains from di↵erent geographical and ecological origin. They found five distinct major clades (in gray) interspersed by mosaic strains composed of the major clades.
ably exists in its diploid form and repro-duces by asexual budding. Its sexual cy-cle can be induced by environmental trig-gers (which is exploited in the laboratory setting), when this happens it produces four haploid spores, segregating between the two mating types, a and ↵ (Liti,2015). The ease with which researchers can con-trol the sexual cycle of yeast is one of its many benefits.
In this figure, the West African strain DBVPG6044 ( ) and the North American strain YPS128 ( ) are the two strains used for the large cross grid in the two papers of this thesis.
Other strengths of yeast as a model lie in its large population sizes, fast generation time, ease and low cost of cultivation, and the fact that it is a single cell eukaryotic organism with a relatively small genome size. A genome that, in spite of diverg-ing from humans about 1 billion years ago (Douzery et al., 2004), shares around one third of its genes with humans (O’Brien et al., 2005). In one study, Kachroo et al.
(2015) found that when they replaced 469 essential S. cerevisiae genes with their
hu-man orthologs, 200 of them could be fun-cionally replaced. This is a strong case for the shared ancestry of all organisms on the earth, and of using yeast as a model organ-ism.
The research on S. cerevisiae has long
fo-cused on the model strain S288C or of strains derived from it (Liti, 2015). Natu-rally, only one strain (which, in fact, is a phenotypic outlier compared to other yeast strains (Warringer et al.,2011)) cannot rep-resent the entire S. cerevisiae species, and
certainly not the eukaryotic kingdom as a whole. Work on this model strain has been invaluable, but using the large reservoir of natural genetic and phenotypic variation in the S. cerevisae species tree will bring out
new facets of population genetics.