A
B
Supplementary Figure 1: Superimposed 1H/15N-HSQC spectra showing the
backbone amide signals of TWD11-180 in the presence of NPA (A) and quercetin (B)
in comparison to the solvent (DMSO). For details, see Methods. Black spectrum,
solvent control; red, NPA and blue, quercetin.
ppm 6.5 7.0 7.5 8.0 8.5 9.0 9.5 10.0 ppm 106 108 110 112 114 116 118 120 122 124 126 128 130 132 DMSO NPA ppm 6.5 7.0 7.5 8.0 8.5 9.0 9.5 10.0 ppm 106 108 110 112 114 116 118 120 122 124 126 128 130 132 T78 Q82 K39 V40 D41 K79 V124 L123 ppm 6.5 7.0 7.5 8.0 8.5 9.0 9.5 10.0 ppm 106 108 110 112 114 116 118 120 122 124 126 128 130 132 DMSO Quer ppm 6.5 7.0 7.5 8.0 8.5 9.0 9.5 10.0 ppm 106 108 110 112 114 116 118 120 122 124 126 128 130 132 T78 Q82 K39 V40 D41 K79 V124 L123
DMSO
NPA
DMSO
quercetin
Supplementary Figure 2: In silico docking and quantum chemical modeling of NPA and benzoic acid binding on TWD1.
(A-C) Thousand poses for NPA and benzoic acid (BA) were generated using the PyMOL
embedded AutoDock Vina toolset and colored according to their binding scores (best: green, lowest: red). Shown are the ten most stable NPA-bound conformation clusters calculated with the TWD11-339 (A-B) and TWD134-180 (C-D) segment in fixed (A-B) and flexible residue
side-chain mode (C-D). Top-ranked docking pose NPA scores are -11 (-7) kcal/mol and BA scores are -4 (-4.5) kcal/mol for flexible (and rigid) docking, making BA binding very unlikely. Theoretical position of FK506 is indicated in pink. (E-F) Optimized geometries of the binding of NPA (red in (E)) and benzoic acid (BA; pink in (F)) to TWD1. Calculated BA binding energies ΔEave = -31.35 kJ/mol are a factor 2.3 lower than for NPA (ΔEave(NPA) = -71.65. kJ/mol). For orientation P37 is colored in green; putative H bonds are dashed in yellow.
CSP (Δppm)
C
D
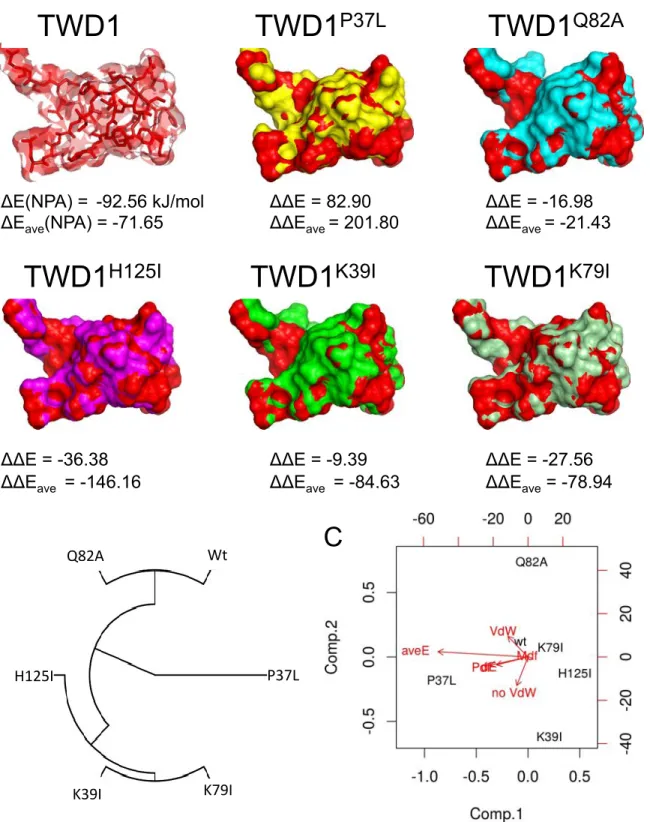
Supplementary Figure 3: Structural analysis of wild-type and mutant version of the TWD1 FKBD using Quantum chemical modeling (DFT).
!
(A) Optimized geometries of the binding surface of WT and indicated TWD1 mutants show the
differences of mutant geometries (in dissimilar colours) to WT TWD1 (in red). Calculated NPA binding energies (∆E) and relative changes of binding energies in kJ/mol (∆∆E) are shown below structures.
!
(B) Classification of the mutants attending to a multivariable analysis of different components of
their theoretical binding energies with NPA (∆E,!∆Eave, ∆EVdW, ∆EPdef, ∆EMdef) after full DFT geometry optimization.
!
(C) Biplot analysis (using the first two principal components of information, comp. 1 and comp. 2)
displays the relationships between the decomposed chemical forces related to the quality of the intermolecular interaction between NPA and each pocket (Wt and mutants).
!
Wt
!
P37L!
K79I!
K39I!
H125I!
Q82A!
Optimized geometries
(a)
Wt
(b)P37L
(c)Q82A
(d)H125I
(e)K39I
(f)K79I
Binding of NPA to FKBP42 surface
(g)
Binding geometry
(h)Density deformation
(i)Potential surface
(j)
Tetrapole interaction
(k)Dipole interaction
Abbildung 1: Structural analysis, using DFT methods, of different mutants and the interaction between the surface binding
protein and the molecule NPA. Subfigures (a - f) shows the optimized geometries of the binding surface of the Wt (a), while
the pictures (b - f) show the differences of the geometries of the mutants (in dissimilar colors) by overlapping them with
respect to the Wt as reference. The lower panel (g - k) represent the most stable geometry of the binding of the NPA in the
surface binding of the protein. Subfigure (g) shows the ligand - protein interaction, emphasizing the hydrogen bonds that
occur between NPA and some amino acids. Subfigures (h - k) illustrate the analysis of the density deformation using the
theory of deformed atoms in molecules (DAM) for contour values of ±0.001 au (electron / bohr
3): in (h) the positive (red)
electronic density make reference to the chemical bonding, while the negative (blue) make reference to the regions with charge
depletion. In (i) the potential surface where yellow shows the negative potential responsible for H-bonds interactions. In (j)
the tetrapole interaction that stabilize the interactions between the rings of NPA and the amino acids. In (k) dipole-dipole
induced interaction between NPA and H125.
1
TWD1 TWD1
P37LTWD1
Q82AOptimized geometries
(a)
Wt
(b)P37L
(c)Q82A
(d)H125I
(e)K39I
(f)K79I
Binding of NPA to FKBP42 surface
(g)
Binding geometry
(h)Density deformation
(i)Potential surface
(j)
Tetrapole interaction
(k)Dipole interaction
Abbildung 1: Structural analysis, using DFT methods, of different mutants and the interaction between the surface binding
protein and the molecule NPA. Subfigures (a - f) shows the optimized geometries of the binding surface of the Wt (a), while
the pictures (b - f) show the differences of the geometries of the mutants (in dissimilar colors) by overlapping them with
respect to the Wt as reference. The lower panel (g - k) represent the most stable geometry of the binding of the NPA in the
surface binding of the protein. Subfigure (g) shows the ligand - protein interaction, emphasizing the hydrogen bonds that
occur between NPA and some amino acids. Subfigures (h - k) illustrate the analysis of the density deformation using the
theory of deformed atoms in molecules (DAM) for contour values of ±0.001 au (electron / bohr
3): in (h) the positive (red)
electronic density make reference to the chemical bonding, while the negative (blue) make reference to the regions with charge
depletion. In (i) the potential surface where yellow shows the negative potential responsible for H-bonds interactions. In (j)
the tetrapole interaction that stabilize the interactions between the rings of NPA and the amino acids. In (k) dipole-dipole
induced interaction between NPA and H125.
1
TWD1
H125ITWD1
K39ITWD1
K79IΔE(NPA) =!!-92.56 kJ/mol ΔΔE = 82.90 ΔΔE = -16.98 !
ΔEave(NPA) = -71.65 ΔΔEave= 201.80 ΔΔEave= -21.43 ! ! ! ! !!!!!!!! ! ! ! ! ! !
ΔΔE = -36.38 ΔΔE = -9.39 ΔΔE = -27.56 !
ΔΔEave = -146.16 ΔΔEave = -84.63 ΔΔEave = -78.94!
A
B
C
Supplemental Data. Zhu et al. (2016). Plant Cell 10.1105/tpc.15.00726
Supplementary Figure 4: NPA binding and regulatory impact of wild-type and mutated versions of TWD1 in yeast. (A) Specific 3H-NPA binding to total microsomes prepared from
yeast expressing TWD1 fused to Renilla luciferase (Rluc) was analyzed in the absence (total) and presence of a 1000-fold access of non-radiolabelled NPA concentrations (unspecific). Specific binding was calculated as difference between total and unspecific NPA binding as described in Methods. Significant differences of mean ± SE (n ≥ 8; unpaired t test with Welch’s correction, p<0.05) to vector control and TWD1-Rluc are indicated by one or two asterisks, respectively. (B) Inhibitory impact on ABCB-mediated auxin efflux in yeast. Wild-type TWD1 and TWD1K39I and TWD1K79I but not TWD1H125I and TWD1Q82A inhibit
ABCB1-mediated (B1) IAA export. Reduction of auxin retention (export) was calculated as relative export of initial export (mean ± SE, n ≥ 8). Significant differences (unpaired t-test with Welch’s correction, P<0.05) to B1/TWD1 are indicated by an ‘a’
B
Supplementary Figure 5: Sensograms and representative fitted models of kinetic analyses (black lines, left), residual deviation from 1:1 Langmuir binding model (bottom panel, left) and equilibrium analyses (right) of surface plasmon resonance (SPR) analyses of NPA (A), benzoic acid (BA, B), BUM (C) and TIBA (D) binding using thiole-immobilized TWD11-339. Drug injections were 15 µM, 30 µM, 60 µM and 90 µMDouble referencing and data
analysis was performed using Scrubber2 (BioLoglic Software Pty Ltd, Campbell, Australia) and TraceDrawer (Ridgeview Instruments AB, Vänge, Sweden) analysis software. Note that sensograms obtained for BA do not allow for a meaningful fit, indicating that TWD11-339 did not
bind this compound. Binding parameters are listed in Table 2. All experiments were repeated at least 3 times on independent sensor chips. RU, normalized response unit (µRIU/ MW * 100).
A
B
C
B
Supplementary Figure 6: Root gravitropism and auxin-induced hypocotyl elongation of twd1-3 is less sensitive to NPA.
(A) Rate of curvature calculated as first derivative
of root curvature of roots in the absence (straight lines) and presence of 10 µM NPA (dashed lines). Data are means ± SE (n = 3 sets of experiments with each 50 seedlings).
(B) Hypocotyl elongation normalized to 100% at
time point of addition of 100 nM IAA at t = 70 min. (arrow) of wild type (WT, Col-0), twd1-3, HA– TWD1 in the absence (straight lines) and presence of 10 µM NPA (dashed lines). Shown are means; n = 14.
Supplementary Figure 7: Hypocotyl length of twd1-1 and act7-4 in the presence and absence of actin and microtubule stabilizing and destabilizing agents.
(A) Destabilization and stabilization of actin by latrunculin B and jasplakinolide, respectively,
reduces hypocotyl elongation in WT (Wassilewskija wild type) to a similar magnitude as NPA. Note reduced sensitivities in twd1-1.
(B) Destabilization of microtubules by paclitaxel/ taxol reduces hypocotyl elongation in WT to a
similar magnitude as NPA, while stabilization by oryzalin has no significant effect. Note similar sensitivities for twd1-1 and act7-4 compared to WT excluding an involvement of TWD1 in microtubule organization.
Significant differences (unpaired t test with Welch’s correction, p < 0.05) to solvent controls are indicated with ‘a’, between wild type and mutant alleles with ‘b’ (means ± SE; n = 4 sets of 30 seedlings each). b a a a a a b a a a a
A
B
WT twd1-1 act7-4
WT twd1-1 act7-4
Supplementary Figure 8: Functional classification of TWD1 interacting proteins identified by co-immunoprecipitation followed by MS/MS analyses using TWD1-CFP as a bait. Mascot identified proteins from three
independent co-IP/MS analyses (see Supplementary Data set 1 for details) were classified according to their molecular function (A), their cellular components (B) and their putative biological process (C) using Blast2Go (www.blast2go. com).
B
C
Supplementary Figure 9: TWD1 does not autonomously bind t o m a m m a l i a n a c t i n f i l a m e n t s a n d a f f e c t a c t i n polymerization.
(A) High speed co-sedimentation analyses conducted with 8 µM
purified TWD11-180 (FKBD) and 4 µM polymerized actin at different pH (6.0-7.4) and in the presence or absence of CaCl2 (+/- 303 µM). Note that sedimentation in the presence of actin filaments (lower panels) is comparable to sedimentation in their absence (upper panels), excluding a direct interaction.
(B) Actin polymerization assay. Pyrene-actin labeled actin
monomers (3 µM) were induced to polymerize in the absence or presence of 12 µM TWD11-339, and 12 µM NPA. The increase of fluorescence due to actin polymerization was recorded over 1000s. Initial fluorescence was set to 1.
A
B
FKBD
FKBD actin
Supplementary Figure 10: Confocal microscopy analyses of cortical actin bundling of hypocotyls (A-B) and roots (C-D) expressing GFP-fABD2 treated with 10 µM NPA.
Representative epidermal cells (A, C) and quantification of actin bundling (skewness, B, D); bars, 20 µm. Significant differences (unpaired t test with Welch’s correction, p < 0.05) between wild type and mutant alleles are indicated by an ‘a’, significant differences to solvent controls by a ‘b’ (mean
NPA - + - + - + - + nd a a b b a a b b NPA
- + - + - + - +
WT twd1-1 act7-4 TWD1-CFP
(twd1-1)
B
C
D
A
B
Supplementary Figure 11: Concentration-dependency of NPA treatments causing bundling of cortical actin in hypocotyls.
(A) Representative epidermal cells expressing GFP-fABD2 in
Wassilewskija wild type (WT), twd1-1, act7-4 and twd1-1 complemented by TWD1:TWD1-CFP (TWD1-CFP); bar, 20 µm.
(B) Quantification of actin bundling (skewness). Significant differences
(unpaired t test with Welch’s correction, p < 0.05) between wild type and mutant alleles are indicated by an ‘a’, significant differences to solvent controls by a ‘b’ (mean ± SE; n ≥ 40). Note that reduced differences between to twd1-1 and act7-4 in comparison to Supplementary Fig. 9 online are most likely due to usage of another confocal microscope with slightly different confocal setting.
B
C
D
E
Supplementary Figure 12: act7 single and double mutants reveal endosomal and vacuolar defects.
Short FM4-64 treatment (2 µM, 15 min; A), ARF1 location (B), lysotracker red (LTR; C), long FM4-64 treatment (4 µM, 3h; D) and lateral plasma membrane localization of TWD1 (E; stronger at the outer polar domain in the wild type (WT)) is altered in
act7-4 and actin double mutant combination. Bars,
A
B
C
Supplementary Figure 13: Expression and localization of PIN and ABCB-type auxin transporters are dependent on ACT7.
(A-B) Immunolocalization of PIN1 (A) and PIN2 (B) in
act7-4 shows similar de-localizations as PIN1 and
PIN2-GFP lines crossed with act7-4. Wassilewskija (WS) and Columbia (Col-0) wild types and act7-4 (in WS) were used.
(C) ABCB4 is de-localized from the PM in act7-6 as
shown by crossing between ABCB4:ABCB4-GFP (in Col-0 WT) and act7-6 (SALK_131610in Col-0 WT), bars are 10 µm.
Col-0 WS act7-4
Col-0 WS act7-4
PIN1
!
PIN2
!
WT act7-6
ABCB4-GFP
!
Supplementary Figure 14: Endosomal markers, Syp22, Syp61 and RabF2b, are delocalized in act7-4 compared to the corresponding wild type. Wild-type (WT, upper row)
endosomal marker lines, Syp22-YFP, RabF2b-GFP and Syp61-CFP, were crossed into act7-4 (lower row) and root tissues were imaged by confocal microscopy. Delocalization of endosomal markers are marked by arrows; bars, 10 µm.
act
7-4
overlay ABCB19-GFP FM4-64
act7
%4
!
!!!!!!!!!!W
T!
A
B
overlay PIN1-GFP FM4-64act7
%4
!
!!!!!!!!!!W
T!
Supplementary Figure 15: ABCB19 and PIN1 co-localize with endocytic marker FM4-64 after BFA treatment.
(A-B) ABCB19-GFP (A) and PIN1-GFP (B)
co-localizes with short-treated FM4-64 (15 min) after BFA treatment (25 µM, 1h) in wild-type (WT) and
act7-4 (white arrows). In addition, for both PIN1
and ABCB19 GFP-positive accumulations of late endosomal nature are visible in act7-4 (marked with green arrows). Bars are 10 µm.
Supplementary Figure 16: Heat map presentation (A) and influx profiles (B) of IAA influx along wild type (WT), twd1-1 and act7-4 roots treated with 5 μM lathrunculin B (LatB), jasplakinolide (Jasp) or the solvent (DMSO).
Positive fluxes represent a net IAA influx. Shown are means ± SE; n = 12.
WT
twd1-1
act7-4
WT Jasp WT solvent twd1-1 solvent twd1-1 LatB twd1-1Jasp WT solvent act7-4 solvent act7-4 LatB cct7-4 JaspA
B
C
control TWD1
fkbp
a a a a b b b b b a b b bSupplementary Figure 17: Analyses of FKBP action in yeast.
(A-B) Deletion of all four yeast FKBPs alters yeast budding but not size. Bud size (A;
un-polarized, small-to-medium buds, large buds) and yeast size (B) of Wt yeast expressing TWD1 in the absence and presence of NPA (10 µM) and of yeast strain KDY81.18c having a deletion of all four yeast FKBPs, FPR1-4 (fkbp, Hemenway & Heitman, 1996).
(C) Expression of TWD1 increases yeast size. Bud size (classified as: UP, un-polarized; MB,
small-to-medium buds; LB, large buds) of Wt yeast mother cells (M) and buds (B) expressing TWD1 in the absence and presence of NPA (10 µM). Note that TWD1K79I also increases yeast
cell size but that cell size is further increased by NPA.
Significant differences (unpaired t test with Welch’s correction, p < 0.05) between vector control (control) and yeast expressing TWD1 are indicated by ‘a’, significant differences to solvent controls by ‘b’ (mean ± SE; n > 3 independent transformants).
control
TWD1
fkbp
NPA
-
+
-
+
-
+
a
b
a
b
a
a
Supplementary Figure 18: Working model summarizing the function of FKBP42/TWD1 as an integrator of actin bundling/dynamics and polar auxin transport.
(A) In this work we characterize the FKBP42, TWD1, as a low-affinity NPA binding protein that
physically interacts with the vegetative actin subunit, ACT7. TWD1 functions as an integrator between actin cytoskeleton dynamics and polar auxin transport; the latter being essential for the establishment of local auxin gradients known to control plant development. The central integrative role of TWD1 is further underlined by the finding that TWD1 mediates the effect of NPA on actin filament dynamics. Note that TWD1 might also interact with ACT8 (see text for details) shown to function redundantly with ACT7, while ACT2 seems not to be part of this pathway. Verified and unclear interactions are indicated by straight or dashed lines, respectively. Components and functions described in this work are indicated in bold.
(B) TWD1-ACT7 interaction is indirect, therefore we propose a third-party actin-binding protein
(ABP) as a functional linker. The complex effect of TWD1 on AF organization and dynamics (i.e. a combined increase in AF bundling and decrease in dynamics), argues for the idea that TWD1 functionally interacts with at least two independent, regulatory ABPs via two axis: TWD1 increases AF turnover by positively regulating an ABPx that promotes actin severing and de-polymerization (axis 1); these activities are reduced in twd1 (Table 2). TWD1 negatively regulates AF de-bundling frequency via a putative ABPy (axis 2). De-bundling is nearly 4x enhanced in twd1, while bundling frequency is not significantly modified (Table 2). NPA inhibits regulatory axis 1 via binding to TWD1, and thereby reduces AF turnover. Accordingly, NPA treatment increases AF stability in WT but has no effect on AF dynamics in twd1. Reduced AF turnover (inhibition of axis 1) combined with inhibition of de-bundling (active axis 2) results in an overall increase in actin bundling and decrease in actin dynamics.