HAL Id: halshs-00590519
https://halshs.archives-ouvertes.fr/halshs-00590519
Preprint submitted on 3 May 2011
HAL is a multi-disciplinary open access archive for the deposit and dissemination of sci-entific research documents, whether they are pub-lished or not. The documents may come from teaching and research institutions in France or abroad, or from public or private research centers.
L’archive ouverte pluridisciplinaire HAL, est destinée au dépôt et à la diffusion de documents scientifiques de niveau recherche, publiés ou non, émanant des établissements d’enseignement et de recherche français ou étrangers, des laboratoires publics ou privés.
Is man doomed to progress?
Claudia Senik
To cite this version:
P
ARIS-J
OURDANS
CIENCESE
CONOMIQUES48,BD JOURDAN –E.N.S.–75014PARIS TEL. :33(0)143136300 – FAX :33(0)143136310
www.pse.ens.fr
WORKING PAPER N° 2006 - 12
Is man doomed to progress?
Claudia Senik
JEL Codes : C23, D31, D84, D91, I31, Z13
Keywords : Expectations, growth, subjective happiness, adaptation, panel data.
CENTRE NATIONAL DE LA RECHERCHE SCIENTIFIQUE –ÉCOLE DES HAUTES ÉTUDES EN SCIENCES SOCIALES
Is man doomed to progress?
Claudia Senik
Paris School of Economics* May 23, 2007
A
BSTRACTThis paper is dedicated to the empirical exploration of the welfare effect of expectations and progress per se. Using ten waves of the Russian Longitudinal Monitoring Survey, a panel household survey rich in subjective variables, the analysis suggests that for a given total stock of inter-temporal consumption, agents are more satisfied with an increasing time-profile of consumption: they seem to have a strong “taste for improvement”. This contributes to qualify the “Easterlin paradox” that income growth does not make people happy.
Key words: Expectations, growth, subjective happiness, adaptation, panel data. JEL codes: C23, D31, D84, D91, I31, Z13
* also affiliated to University Paris-IV Sorbonne, PSE (CNRS, EHESS, ENPC, ENS), IZA and Institut Universitaire de France
PSE, 48, bd Jourdan, 75014 Paris tel. 33 1 43 13 63 12
e-mail : [email protected] http://www.pse.ens.fr/senik/index.html
People have a “gestalt” notion of an ideal distribution of outcomes in time (Camerer and
Loewenstein, 2004).
1.
I
NTRODUCTIONDo past and future events affect current feelings of utility? After decades of tests and discussions of the discounted utility model, with the hindsight of field data and experiments, the assumption of separability between different sequences of utility has been breached. Beyond hyperbolic discounting, many anomalies regarding the relation between time, decision and utility are now well established. In particular, “behavioural economics” (e.g. Camerer and Loewenstein, 2004) acknowledge the possibility of inter-temporal spillovers of utility, i.e. the anticipated or retarded influence of events on individual well-being. Doing so, one is using a notion of utility that is not defined uniquely as a value attached ex ante to a decision, by comparison with other choices, but as an experience, i.e. a mental state that includes emotions1.
How do lags and leads enter into current utility? Past consumption, or past utility is most often taken to exert a negative impact over current satisfaction because of benchmarking
1 I refer to Kahneman et al. (1997) for the discussion of the difference between decision-utility and
effects such as adaptation2 (Frederick et al., 2002) and reference point effects3. As opposed to the rich literature devoted to adaptation, the positive continuing effect of past consumption has been rarely documented, except as memory utility (Kahneman, 2003). Studies in child psychology could certainly provide illustrations of the benefits of an early accumulation of an initial “stock” of happiness. A recent paper by Graham and Oswald (2006) develops the notion of “hedonic capital” as a stock on which individuals can draw to smooth bad life-shocks
Concerning the effect of the future, the literature has recently accumulated evidence of “anticipatory feelings” (Caplin and Leahy, 2001) such as dread, savouring, hope and anxiety. The idea is that agents experience by advance the utility of future events (e.g. surgery operation or having dinner with a glamorous partner). The intuition dates back to the origin of economic thinking. “three distinct ways are recognisable in which pleasurable or painful
feelings are caused: (1) by the memory of events, (2) by the sensation of present events, (3) by the anticipation of future events” (Bentham, quoted by Loewenstein, 1987). However, future
events can also exert a negative contrast effect if one is impatient of enjoying an expected event, which, by contrast, makes the present dull. A prisoner about to be released from jail is likely to experience this type of negative anticipatory feelings.
The consequence of inter-temporal spillovers of utility is that the time profile of events matters. In particular, both adaptation and anticipatory feelings mean that individuals are more satisfied at each moment if they see their dynamic consumption trajectory as a rising one. Indeed, with aspirations based on past consumption they enjoy consuming more than
2 Adaptation is sometimes declined in two versions: hedonic treadmill and satisfaction treadmill. “Hedonic
treadmill” refers to adaptation to a latent pleasure variable (say income), whereas “satisfaction treadmill” invokes adaptation to a certain level of satisfaction, i.e. the notion of a changing aspiration level (in other terms, satisfaction itself becomes an argument of satisfaction).
3 Helson (1947) defines adaptation as the diminished responsiveness to a repeated or continued stimulus. In a
model of rational addiction à la Becker and Murphy (1988) adaptation means that current utility is a decreasing function of the stock of accumulated past consumption.
yesterday, and because of savouring they enjoy the perspective of a future improvement. In sum, they enjoy progressing4.
This paper tries to provide empirical evidence of this phenomenon. It illustrates the fact that acknowledging or expecting an improvement in one’s material situation is a motive of life satisfaction. Its main claim is that, ceteris paribus, for a given stock of cumulated inter-temporal consumption, people are happier when they experience a progression in their standard of living than when they consume the same stock, but without a progression. The principal challenge of this work is to show that these results reflect of the impact of progress
per se.
1.1 Why isn’t it trivial?
Isn’t it trivial that progressing or expecting to progress influences happiness? Although this idea is very intuitive, it is in contradiction with some basic principles of economic thinking. First, classically, economists consider that individuals maximize their inter-temporal utility, but they assume (for simplicity) that each period’s experienced utility depends only on the contemporaneous consumption flow (separability of time sequences).
Second, when agents are supposed to be impatient: when they make choices that maximize their inter-temporal utility, they are supposed to value the flows of current consumption at a higher rate than the same flow of consumption available in, say, two years’ time. In other words, they have a preference for the present. This is completely at odds with the assumption of savouring and of a preference for increasing time profiles of consumption. As pointed by Loewenstein (2003), Caplin and Leahy (2001) and Köszegi (2005), anticipated utility gives rise to apparently negative rates of discounting of the future.
Third, consumer theory considers that agents optimise their consumption over their life cycle, which leads them to smooth their consumption profile: if they are not financially constrained, they borrow and save in order to equalize the marginal utility of consumption at each period; this most often does not lead to a rising time-path of consumption.
4 If agents expect adaptation to take place in the future, it constitutes an additional argument for preferring
Hence, the welfare influence of pure informational phenomena like expectations are not usually acknowledged by standard economic modelling, which does not allow expected future improvement to influence immediate welfare directly.
It is important to stress that the savouring effect that is studied here differs from the obvious consumption smoothing whereby agents anticipate, in their current consumption level, the higher income due for tomorrow (e.g. Browning and Collado, 2001). The focus of the paper is not on the inter-temporal allocation of material consumption, but on the inter-temporal externality of satisfaction, i.e. on the “direct effect of information on pleasure and pain” (Loewenstein, 2006).
1.2 Why does it matter?
Should economists bother taking into account inter-temporal transfers of utility? There are many arguments in favour of doing so. One of them is that inter-temporal utility spillovers complicate the understanding of what a rational behaviour should be, and constitutes a challenge for the theory of decision-making5. Consider for example, the notion of satisfaction treadmill, which lies at the foundation of the so-called Easterlin paradox. The idea is that habituation effects destroy the benefit of growth. This is because of the deleterious role of aspirations: “Material aspirations increase commensurately with income, and as a result, one
gets no nearer to or farther away from the attainment of one’s material goals, and well-being is unchanged” (Easterlin, 2003).
5 Inter-temporal spillovers seem to question the validity of the consumer model by calling in heterodox
assumptions about agents’ preferences or behaviour. But the recognition of such behaviour can help explaining a series of puzzling phenomena. The manipulation of information (strategic learning and remembering) is one of those. People who derive utility from their beliefs or representations about the future can rightly choose to “put their head in the sand”. Hence, they will not take medical tests in order to avoid thinking about the possibility of being ill, or will not prepare their retirement in order to keep away from the idea of old age and death. Governments and doctors can also carefully filter the information they give to their patients or citizens in order to maximize their welfare (Caplin and Leahy, 2003). More generally, habituation, loss-aversion and anticipatory feelings contribute to explain many anomalies and apparently time-inconsistent behaviour, such nominal price rigidities, the departure of wages from productivity, or the equity premium puzzle (Camerer and Loewenstein, 2003, Frederick et al., 2002).
The issue is provocative and important, both for theoreticians and policy-makers. On the theoretical side, agents who underestimate the habituation effect that sweeps away part of their expected income utility should not be represented as rational utility maximizers, but rather as myopic inter-temporally inconsistent persons. They take decisions based on false expectations so that their experienced utility turns out to be different (lower) from their expected utility6. On the political side, the market economies of social democracies are based on a pro-efficiency-cum-growth consensus. If growth turns out not to be make people happy, then other types of social organizations could be preferable. The implications of the Easterlin question thus loom large, questioning the need for paternalism and the choice of capitalism. The Easterlin paradox is based on adaptation, i.e. the influence of past consumption on current utility. However, taking into account the emotional impact of future prospects can bring out different conclusions and reconcile adaptation with growth. Indeed, with a “taste for improvement”, working hard for money or any other goal, even in a framework with adaptation, turns out not to be a self-defeating project.
This short discussion illustrates the complexity of the interlocked dynamics of income, aspirations, expectations and satisfaction. This paper does not try to estimate a structural model of these effects; instead, it tries to estimate a reduced form of the ex post relation between past or expected progress and satisfaction, based on a retrospective view.
1.3 Existing empirical evidence
So far, the empirical evidence about inter-temporal spillovers has mainly been collected from field studies or experiments. (e.g. Loewenstein and Sicherman, 1991, Loewenstein and Prelec, 1991, Loewenstein, Read and Baumeister, 2003, Brocas and Carillo, 2003, 2004, Camerer, Loewenstein and Rabin, 2004). A famous and intuitive experiment by Loewenstein and Prelec (1991) consisted in asking people to choose over different sequences of dinners at more or less fancy restaurants: the results revealed a strong preference for improving sequences (in terms of meals’ quality). Recently, a new type of evidence has been provided by experiments
6 As put by Easterlin (2001): “People […] project current aspirations to be the same throughout the life cycle,
while income grows. But since aspirations actually grow along with income, experienced happiness is systematically different from projected happiness. Consequently, choices turn out to be based on false expectations”.
in neuroscience and more specifically in “neuro-economics” (Camerer et al., 2004). For instance, an experiment by Berns et al. (2006) uses functional magnetic resonance imaging to relate brain activity with anticipations and dread. They observe a significant relationship between individual differences in the measure of dread in the brain activity and individual differences in inter-temporal choice behaviour (Loewenstein, 2006).
By contrast, survey evidence is scarce. Concerning adaptation, di Tella et al. (2005) use the German GSOEP panel data and find signs of total habituation to income (but not to status). They show that the effect of past income on current satisfaction tends to fade away with time. Stutzer (2003), using a Swiss survey, finds that higher income aspirations reduce individual utility. He uses the “income evaluation question” (in your circumstances, what income would
you find sufficient?) as a proxy for aspirations. Aspirations of agents are then found to depend
on the average income of their community and on their own income, conformingly to van Praag’s earlier finding. One of the most remarkable contributions of the Leyden school is indeed the unveiling of a “preference drift”, an evaporation of the ex post effect on satisfaction of a rise in individual income (see van Praag, 1971, 2001 and van Praag and Ferrer-i-Carbonnell, 2004).
Concerning spillover effects from the future, Clark et al. (2003) have shown that individuals start being less happy one year before they experience job quits, layoffs and unemployment. Van Praag and Ferrer-i-Carbonell (2004) devote a chapter of their book to “The Impact of Past and Future on Satisfaction”. They show that past remembered and future expected income both influence current financial satisfaction. Frank and Hutchens (2004) observe the increasing wage profiles of commercial airline pilots and intercity bus drivers; they show that in both cases, earnings grow more rapidly than productivity over time. They interpret this as a sign of a preference for rising consumption profiles, coupled with other behavioural assumptions such as lack of willpower and comparison effects, which make this type of forced saving desirable when individuals are unable to defer present consumption.
The next section presents the data and the empirical strategy. Section 3 presents the results, section 4 interprets them, and section 5 concludes.
2.
D
ATA AND EMPIRICAL STRATEGYThis work is based on the waves 5 to 13 of the Russian Longitudinal Monitoring Survey (RLMS), a database containing many attitudinal questions related to satisfaction, expectations and past changes in individuals’ living standards. These waves correspond to years 1994, 1995, 1996, 1998, 2000, 2001, 2002, 2003, and 2004. This is panel data, so that it is possible to follow the dynamics of expectations and satisfaction of the same individuals during nine consecutive rounds. The panel nature of the data also allows to control (at least some of the) unobserved individual heterogeneity. Finally, the Russian environment is a guarantee of sufficient variance in the dynamics of income, expectations and satisfaction. Essentially, in Russia, aggregate income and subjective well-being decline from 1994 and resume after the devaluation of August 1998 and onwards. Behind these aggregate evolutions, it is well-known that the Russian context imposes a high degree of variability and uncertainty upon Russian households (Senik, 2004, Eggers et al., 2004).
The main demonstrandum of this paper is the pure effect of progression on welfare: ceteris
paribus, given their total stock of real expenditure, agents are happier with an increasing
time-profile of consumption. One thus needs to identify the welfare effects of past and expected variations in individual consumption. The next sub-section presents the attitudinal questions that are used to proxy these effects.
2.1 Subjective variables as proxies for welfare
Let Ct, Ct-1, Cat, Cat+1 be respectively the flows of current consumption at time t, past consumption at time t-1, consumption at time t as expected in t-1, and future expected consumption at time t+1 as expected at time t. The RLMS data contains several subjective variables that correspond to these magnitudes.
The EXPECTED IMPROVEMENT subjective variable (Do you think that in the next 12 months
you and your family will live better than today or worse?) is taken to proxy the difference
between current and future expected living standard (Cat+1 - Ct), while the PAST IMPROVEMENT question (Tell me, please: How has the financial situation of your family changed in the last
12 months?) proxies subjective past evolution, (Ct-Ct-1). The current consumption of the household Ct is proxied using the LOG REAL EXPENDITURE of the year, which is based on a detailed and exhaustive reporting of all consumption items by the household. Concerning the
past level of consumption Ct-1, one would like to have a variable representing “remembered utility” (in the terminology of Kahneman et al., 1997) i.e. a question that would ask “what was your living standard last year?”. However, as there is no such variable in the dataset, I use LAGGED REAL EXPENDITURE as a proxy forCt-1.
Eventually, the objective is to assess the effects of these variables on general LIFE SATISFACTION, (To what extent are you satisfied with your life in general at the present
time?). I also use self-assessed HEALTH (Tell me, please: How would you evaluate your health?) as a proxy for experienced utility. The descriptive statistics of the variables are
presented in the Appendix.
2.2 Empirical strategy
The objective is to isolate the pure welfare effect of expectations7 and change per se, i.e. the relation between LIFE SATISFACTION and indicators of progress such as EXPECTED IMPROVEMENT or SITUATIONHASIMPROVED, ceteris paribus. To this end, one must overcome
the difficulty that stems from the intertwined effects of aspirations, adaptation and expectations. Suppose for instance that my current positive expectations make me happier today but create higher aspirations that render me more difficult to satisfy tomorrow. Then, what is the total dynamic effect of positive expectations on inter-temporal happiness?
In order to elucidate this question, an intuitive way is to take a retrospective view. The idea is to capture the net result of these complex dynamics of expectations, progress and satisfaction by asking the following question: “after several years, for a given stock of inter-temporal consumption, do people who have more often experienced or expected a progression in their living standard have a higher score of cumulated happiness than (otherwise identical) people
7 A delicate issue is whether my experienced utility in t is affected by my expected experienced utility in t+1 or
by the expected change in my standard of living. In other words, what are anticipatory feelings about: the future event itself or the future contentment brought by the event? The future flow of utility or its argument? Although the question is interesting, there is no means to decide upon it, at least with the material on which this paper is based. Indeed, the question “Do you think that in the next 12 months you and your family will live better than today or worse?” mixes the impact of expectations with their content. On the other hand, false beliefs à la Easterlin concern flows of utility, not of consumption, i.e. people imagine that getting richer will make them happy, but it does not.
who have consumed the same stock but without expected or actual progression?” Hence, one needs to estimate a relationship between an aggregate indicator of progression and an aggregate score of Life Satisfaction, controlling for the total stock of real consumption of the individual over the considered period.
A technical question is what period to consider, i.e. how to aggregate the time series. It is tempting to “collapse” the whole period 1994-2004 in order to have more hindsight. However, this would not allow controlling for individual unobserved heterogeneity. An obvious problem is indeed that happiness and expectations are probably endogenous to some idiosyncratic invariant personal feature such as “personality”. Subjective variables are particularly subject to anchoring effects that make interpersonal comparisons difficult. For example, more extraverted persons may be systematically more satisfied and more optimistic than others, hence the “spurious” relation between the two variables. Supposing that personality is time invariant, and that it can be approximated by an additive effect, the usual method is to use introduce fixed effects8.
In order to keep the time dimension of the data so as to introduce individual fixed effects, I thus divide the observations into three blocks of three years9. I then aggregate the stock of consumption and the score of Life Satisfaction inside each block. The equation to estimate is (1):
CUMULATED LIFE SATISFACTION ib = a0 + a1. CUMULATED CONSUMPTIONib + a2. INDICATOR OF PROGRESS ib + a3 .X it + a4. It + uit + ei (1)
8 Subjective variables are ordinal variables, hence, in principle, they are improper to simple differences. Two
solutions are then available: (i) either collapse the satisfaction and expectations variables into categories (satisfied/not satisfied, situation will improve/deteriorate) and run a conditional fixed effect logit model, which imposes an important loss of information; (ii) or ignore the ordinal nature of the variables and use classic panel models. Surprisingly, after a series of papers which cautiously respected the ordinal nature of subjective variables, economists started to go back to linear models, considering after Ferrer-i-Carbonnel and Frijters (2004) that introducing fixed effects was of primary importance. In this paper, I adopt the second approach, but I check that the results are robust to the first one.
9 I have done the same exercise collapsing the time dimension into two periods of five years: the results are
where b=1 for years 1994-1996, b=2 for years 1997-2000 and b=3 for years 2001-2004, CUMULATED LIFE SATISFACTIONib is the sum of life satisfaction scores of individual i over the years of block b, CUMULATED CONSUMPTIONib is the sum of consumption flows of individual i over block b, ei is a time invariant individual fixed effects, Xit is a vector of socio-demographic controls, It are time dummies, uit is a white noise. These three sets of variables are measured at the last year of each time block, so that t =1996 if b=1, t = 2001 if b = 2 and t = 2004 if b = 3.
The estimation of equation (1) is thus run on a sample of 2808 individuals * 3 years, i.e. 8424 observations.
In terms of INDICATOR OF PROGRESS, I consider alternatively four indicators. They measure respectively the number of times, inside each time block, an individual declares expecting an improvement, expecting a stable situation or expecting a deterioration in the material situation of her family. I also measure an objective indicator of progression, i.e. the number of times the real household income of an individual has increased during the period. All these indicators can take discrete values from 0 to 3.
This specification does not solve all the problems. Another important caveat is that happiness and financial expectations can be endogenous to some unobserved variable (omitted variable problem). A solution is then to instrument expectations. In addition, there is the suspicion that happiness influences expectations rather than the opposite (reverse causation problem). People who are unhappy at a certain point of their life could well have a bias towards pessimistic expectations of income for instance. On the contrary, people who are satisfied or going though a good period of their life could well be more optimistic. Instrumentation also solves part of this problem. On the other hand, as long as the causality does run from expectations to happiness, one should not mind the existence of a reverse causality too. The objective is not to exclude that happiness causes optimistic expectations, but to only assess whether the reverse is true.
As it is difficult to instrument the aggregate score of expected progress, I use a different specification: I regress current Life Satisfaction over instrumented current expectations, controlling for socio-demographic variables, time dummies and individual fixed effects. As an additional robustness test, in order to be sure to be dealing with ex post experienced utility instead of ex ante decision utility (in which case the results would be trivial), I
alternatively use self-assessed HEALTH (Tell me, please: How would you evaluate your health?)asthe endogenous variable of the above regressions, instead of LIFE SATISFACTION.
3.
R
ESULTSThe empirical analysis shows that the time profile of consumption seems to have a welfare impact per se. Instrumenting expectations and questioning the notion of life satisfaction do not alter this result.
3.1 The importance of progressing
I start with the estimation of equation (1), which tries to answer the following questions: with hindsight, for a given stock of total cumulated consumption over three consecutive periods, how does the fact of having nourished positive (resp. negative) expectations feed into cumulated happiness? And how does the fact of having experienced a rising income profile affect cumulated happiness? This exercise thus tries to capture the welfare effect of the perceived and objective time profile of individuals’ living standard.
Table 1 displays the estimation of equation (1), i.e. regressions of CUMULATED LIFE SATISFACTION scores of the periods 1994-1996, 1998-2001 and 2002-2004 over CUMULATED EXPENDITURE in the same periods, an INDICATOR OF CUMULATED PROGRESSION in one’s living standard during the same periods, and other controls measured at the last year of each block (1996, 2001, 2004).
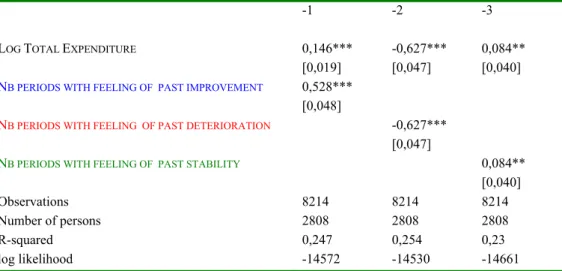
Not surprisingly, total CUMULATED REAL HOUSEHOLD EXPENDITURE exerts an important impact on CUMULATED LIFE SATISFACTION. Then, controlling for this variable, column 1 shows the positive welfare impact of the number of periods individuals objectively experienced an increase in their real household income (symmetrically, aggregate happiness decreases with the number of periods of declining living standard). Table A1 in the Annex confirms this result using individuals’ subjective past evolution. It shows that, ceteris paribus, the more often people have felt that their financial situation had improved (resp. deteriorated) the higher (resp. lower) their cumulated ex post satisfaction. Subjective past stability has a much lower impact on cumulated satisfaction, as compared to past improvement or deterioration.
Turning to subjective expectations, Table 1 suggests that the more often individuals have nourished positive expectations, the higher their total cumulated happiness score (column 2). One additional period of positive expectations increases cumulated happiness by 0.546, knowing that the cumulated happiness score over three years varies from 0 to 15 with an average of 6.9 and a standard deviation of 0.76. Expecting a stable living standard (column 3) is also a factor of cumulated happiness but by a much lower extent. Conversely, the more often individuals have expected a deterioration in their living standard, the lower their cumulated happiness score (column 4). However, expecting an improvement exerts an impact of a larger absolute magnitude than expecting stability or a deterioration10.
Hence, controlling for the total stock of real consumption over three years, there seems to be a positive relation between income mobility, both past and expected, and individual total happiness. In other words, for a given amount of consumption over time, the time-profile matters: individuals have a preference for increasing sequences of consumption.
10 Of course, one cannot compare the effect sizes as if they were based on equal quantitative changes of material
circumstances. First, the variables are qualitative; they capture the feeling of respondents that things have “improved” or “worsened”, but not the extent to which they have. Moreover, in Tables 1 and 3, the variables are defined as the number of times an individual experiences or expects a progression/ deterioration/stability of his material living standard. Hence, the important point is the asymmetry between negative and positive change. This could be misleading if negative shocks were of a much larger magnitude than positive shocks. However, there is no reason to believe so. In particular, since 1998, the Russian economy has been on a strong growth trend, so that incomes have been on the rise (in average).
Table 1. Happiness and Consumption Dynamics Fixed Effects OLS of CUMULATED LIFE SATISFACTION
-1 -2 -3 -4
NB PERIODS WITH HOUSEHOLD INCOME RISE 0,089***
[0.034]
NB PERIODS WITH EXPECTATIONS OF IMPROVEMENT 0.546***
[0.041]
NB PERIODS WITH EXPECTATIONS OF STABILITY 0.106***
[0.028]
NB PERIODS WITH EXPECTATIONS OF DETERIORATION -0.385***
[0.033] LOG TOTAL EXPENDITURE 0,168*** 0.152*** 0.168*** 0.151*** [0.019] [0.019] [0.019] [0.019] Observations 8284 8214 8214 8214 Number of persons 2808 2808 2808 2808 R-squared overall 0,229 0,254 0,232 0,249 Log likelihood -14844 -14532 -14653 -14561
Controls: age, age square, number of children, working status, marital status, time dummies. * significant at 10%, ** significant at 5%, *** significant at 1%.
Regression of cumulated LIFE SATISFACTION SCORES of the periods 1994-1996, 1998-2001 and 2002-2004 over CUMULATED EXPENDITURE and CUMULATED INDICATORS OF IMPROVEMENT in the same periods and other controls taken at the last year of each block (1996, 2001, 2004).
Before addressing the problem of omitted variables using instrumentation (in section 3.3), I have tried to rule out a possible (sceptical) interpretation of Table 1, namely that some unobserved variable (beyond personality traits), that is shared across optimistic, happy and reportedly healthy people, is driving the findings. It is true that Happiness, Expectations and Health are correlated11. I thus try to verify that that the relation between progression (actual and expected) and life satisfaction is robust to the situation, trajectory or features of individuals.
The main suspicion is that people tend to extrapolate the trends that they have experienced in the past. This implies that people who have experienced a past improvement tend to have positive expectations and be happier, whereas those who have experience negative outcomes
11
The correlation table is the following:
Happy Health Expectations Happy 1.0000
Health 0.1970 1.0000
in the past tend to expect that the same evolution will happen in the future. If so, Table 1 is not illustrating the effect of expected change on happiness but simply the effect of past experience. In order to explore this issue, Table 2 presents the regression of current LIFE SATISFACTION over current EXPECTED IMPROVEMENT, controlling for real expenditure and the usual controls, over three different samples of individuals: the whole sample (column 1), the sub-sample of individuals who estimate that their situation has improved as compared to 12 months ago (column 2), and the sub-sample of people who think that their situation has worsened or remained unchanged (column 3). Table 2 shows that the effect of EXPECTED IMPROVEMENT remains positive and significant whatever the past evolution of the agent. Hence, the effect of EXPECTED IMPROVEMENT on LIFE SATISFACTION does not just reflect the past experience of individuals.
Table 2. The impact of expectations does not depend on past evolution Fixed Effects OLS Regressions OF LIFE SATISFACTION
-1 -2 -3
All Situation improved Situation did not improve
EXPECTED IMPROVEMENT 0.343*** 0.162** 0.200*** [0.021] [0.080] [0.047] LOG REAL EXPENDITURE 0.128*** 0,019 0.084*** [0.012] [0.060] [0.027] Observations 17018 1771 5489 Number of persons 2551 1084 2114 R-squared 0,128 0,071 0,037 Log likelihood -19917 -1228 -5261
Controls: age, age square, nb kids under 7 in household, nb kids from 7 to 18 years old in household, working status, marital status, year dummies.
Dichotomized variable: expect improvement: yes or no.
The number of observations is smaller in columns 2 and 3 because variable past improvement is only available during four waves, from 2001 to 2004.
* significant at 10%, ** significant at 5%, *** significant at 1%.
I have also checked that the relation between progress and life satisfaction holds for other partitions of the sample (e.g. richer versus poorer). Hence, the relation is not driven only by the individuals who experience positive (or negative) affects in the three dimensions (health, happiness and expectations).
3.2 Health and expected improvement
Another worrying question is the following: Does the variable LIFE SATISFACTION really measures ex post experienced utility and not ex ante expected utility? In the latter case, there would be nothing surprising about the fact that expected improvement raises expected future utility. By contrast, if declared LIFE SATISFACTION reflects (at least partly) experienced happiness, then the observation that this variable is influenced by expectations is not trivial. In other words, the question is whether declared LIFE SATISFACTION measures a feeling rather than a value judgement.
How can one depart decision-utility from experienced-utility? Consider the definition of health by the World Health Organization (1946): “Health is a state of complete physical,
mental and social well-being and not merely the absence of disease or infirmity”; this
description is almost indistinguishable form the definition of well-being, i.e. experienced utility. De facto, self-assessed health is highly correlated with declared satisfaction (R2=0.19). Now most specialists would agree that health is certainly an experience rather than a judgement. It is thus interesting to use the SELF-ASSESSED HEALTH variable, which is available in the RLMS survey, as a proxy for the feeling of satisfaction12 and to check whether it depends on past and expected progress.
I thus estimate an equation similar to (1), in which I replace LIFE SATISFACTION with SELF -ASSESSED HEALTH.
12 The important point here is not that subjective health be unbiased but that it reflects an experience, a feeling,
Table 3. Health and consumption dynamics
Fixed effects OLS regressions of CUMULATED SELF-DECLARED HEALTH
-1 -2 -3 -4
NB PERIODS WITH HOUSEHOLD INCOME RISE 0,016
[0.019]
NB PERIODS WITH EXPECTATIONS OF IMPROVEMENT 0.095***
[0.024]
NB PERIODS WITH EXPECTATIONS OF STABILITY 0,024
[0.016]
NB PERIODS WITH EXPECTATIONS OF DETERIORATION -0.101***
[0.019] LOG TOTAL EXPENDITURE 0,005 0,002 0,005 0 [0.011] [0.011] [0.011] [0.011] Observations 8214 8214 8214 8214 Number of persons 2808 2808 2808 2808 R-squared within 0,044 0,047 0,044 0,049 log likelihood -10148 -10137 -10147 -10128
Controls: age, age square, number of children, working status, marital status, time dummies.
Regression of CUMULATED HEATH SCORES of the periods 1994-1996, 1998-2001 and 2002-2004 over CUMULATED EXPENDITURE and CUMULATED INDICATORS OF IMPROVEMENT in the same periods and other controls taken at the last year of each block (1996, 2001, 2004).
* significant at 10%, ** significant at 5%, *** significant at 1%.
As shown by Table 3, SELF-ASSESSED HEALTH13 is sensitive to one’s expected consumption trajectory. Positive and negative expectations have an impact of similar magnitude (columns 2 and 4 in Table 3) although negative prospects have a slightly more important impact. This contrasts with the regression of LIFE SATISFACTION, where the number of periods with EXPECTATIONS OF IMPROVEMENT had a larger impact than the number of periods with EXPECTATIONS OF DETERIORATION. Table A2 in the Annex shows that, ceteris paribus, people who have more often experienced an improvement (resp. a deterioration) in their financial situation also reach ex post higher (resp. lower) scores of cumulated subjective health.
Hence, SELF-ASSESSED HEALTH can be considered as a proxy of LIFE SATISFACTION but seems to have its own profile. In particular, the stress generated by negative anticipatory feelings seems to be particularly harmful for subjective health. Stability has a much lower impact on
13 It may come as a surprise that the coefficients on total expenditure and objective income rise are not
significant, but this is a classical result that income is not a significant variable in the regression of subjective health.
subjective health than it has on subjective life satisfaction. Beyond these particular feature of self-assessed health, the lesson of Tables 1 and 3 is that expected and observed progression can be considered to influence experienced-utility and not only decision-utility.
3.3 Ruling out the “omitted variable” interpretation
When assessing the welfare effect of expected and perceived improvement, how can one be sure not to be evaluating the impact of a hidden variable? In this section I concentrate on the influence of expectations.
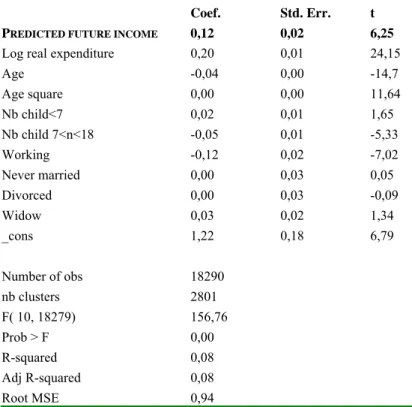
The classical response to the omitted variable problem is instrumentation: one needs to think of a variable that influences EXPECTATIONS directly, but only influences LIFE SATISFACTION through EXPECTATIONS. Stutzer (2003) uses aggregate income variables and contact with neighbours as instruments for aspirations. In a similar spirit, I use the typical income of one’s professional group at the next period to instrument EXPECTATIONS. I thus regress real income (yt+1) on age, gender, industry, diploma, occupation and regional price level in period (t+1). I then use the PREDICTED INCOME of the next period (ŷt+1) as an instrument, which is what agents should expect if they had perfect foresight. (I check that indeed agents have quite reasonable forecasts about the evolution of their living standard, see section 4.2). Lastly, I verify that instrumented expectations do influence self-declared happiness.
The system of equation to estimate is thus the following:
• PREDICTED INCOME: yt = b0 + b1.[age, gender, education, occupation, region, industry)t + εit (2.1) • EXPECTED IMPROVEMENT : Eit = e0 + e1. ŷi t+1 + vit + ωi (2.2) • LIFE SATISFACTION: LSit = d0 + d1.Cit + d2. Êit + d3 .Xit + d4. It + υit + νi (2.3)
where ε it, vit and υit are white noises, and ωi and νi are individual fixed effects.
Beyond the usual assumptions about the error terms, this system is based on the assumption that PREDICTED FUTURE INCOME ŷi t+1 does not influence LIFE SATISFACTION at period t directly but only via EXPECTATIONS, which means that the right-hand side variables that are used to estimate ŷit+1 should also not influence LIFE SATISFACTION directly but only via
EXPECTATIONS, except those who are also present in the final regression of LIFE SATISFACTION, i.e. age and gender. This is all the more credible as these magnitudes are measured one period ahead (t+1) from current life satisfaction (t) 14. One also has to avoid the risk of perfect multi-collinearity between the right-hand side variables in the estimation of ŷit+1 and the right-hand side variables of the regression of Life Satisfaction, in particular, the socio-demographic variables that are designated under the term Xit. As shown in Table 4, Xit includes age, age square, the number of children under 7 years old and between 7 and 18 years old, the working status and the marital status of the individuals. This exclusion relation should ensure that this risk is avoided.
14 A possible limitation of the instrument is the high volatility of the Russian economy. In addition, the relation
between skills and rewards has been greatly perturbated since the beginning of the Transition. However, this does not mean that most individuals cannot forecast their future situation, even though it does not correspond to what they could aspire to in another context, or in the pre-Transition context.
Another (opposite) problem is that predicted income, i.e. the instrumental variable, might capture the higher job security somebody is experiencing in t, even though the predicted future income is based on the typical income of the individual based on his circumstances as of t+1. I have checked that restricting the sample to individuals who change job at the next period (5346 observations) does not alter the result (the coefficient on predicted future income is 0.13 (0.035) and the coefficient on instrumented expectations is 1.13 (0.37). The idea is that if the individual changes job, her expectations are regressed on the new characteristics of the job in t+1 and not on her job in t. Nonetheless, it is still possible that the reason why an individual expects to change job at time t+1 is likely to make her happy already in the current period t. An ideal instrument would capture something exclusively related to the future and not to the current circumstances of the individual…
Table 4. Two Stage Least Square Regression of LIFE SATISFACTION
EXPECTATIONS Instrumented by PREDICTED INCOME for the Next Period
Second stage regression of LIFE SATISFACTION
Coef. Std. Err. t
EXPECTED IMPROVEMENT 0,81 0,20 4,04
Log real expenditure 0,09 0,04 2,25
Age -0,01 0,01 -1,5 Age square 0,00 0,00 2,76 Nb child<7 -0,05 0,02 -2,93 Nb child 7<n<18 -0,04 0,01 -2,85 Working 0,18 0,03 5,58 Never married -0,03 0,04 -0,85 Divorced -0,10 0,04 -2,56 Widow -0,12 0,04 -3,34 _cons -0,57 0,47 -1,23 Number of obs 18290 Nb clusters 2801 F( 10, 2800) 96,98 Prob > F 0,00 R-squared 0,04 Root MSE 1,05
First-stage regression of EXPECTED IMPROVEMENT
Coef. Std. Err. t
PREDICTED FUTURE INCOME 0,12 0,02 6,25
Log real expenditure 0,20 0,01 24,15
Age -0,04 0,00 -14,7 Age square 0,00 0,00 11,64 Nb child<7 0,02 0,01 1,65 Nb child 7<n<18 -0,05 0,01 -5,33 Working -0,12 0,02 -7,02 Never married 0,00 0,03 0,05 Divorced 0,00 0,03 -0,09 Widow 0,03 0,02 1,34 _cons 1,22 0,18 6,79 Number of obs 18290 nb clusters 2801 F( 10, 18279) 156,76 Prob > F 0,00 R-squared 0,08 Adj R-squared 0,08 Root MSE 0,94
Regression with robust errors, cluster (individual). Instrumented: Expected improvement. In the first-stage regression, Expected improvement in period t is regressed on individual circumstances at period (t+1).
The results of Table 4 show that the predicted income of the next period does influence current expectations and that instrumented expectations, in turn, do influence Life Satisfaction. Hence, one cannot reject the assumption that the relation between EXPECTED IMPROVEMENT and LIFE SATISFACTION is not spurious.
The same doubt can be cast on SUBJECTIVE HEALTH: do optimistic persons feel more healthy or is there some unobserved reason why they feel both more optimistic and more healthy? Likewise for the regression of LIFE SATISFACTION, I try to establish the direction of the causality by instrumenting EXPECTED IMPROVEMENT on future PREDICTED INCOME, assuming that PREDICTED INCOME only influences SUBJECTIVE HEALTH via expectations. The result of the 2SLS estimation confirms that there is some causality going from expectations to health: in the first stage estimation of EXPECTED IMPROVEMENT, the coefficient of PREDICTED INCOME is 0,032, with a T statistics of 4; in the second stage estimation of HEALTH, the coefficient of instrumented EXPECTED IMPROVEMENT is 0,949, with a T statistics of 2,4 (controlling for the usual variables). Hence experienced utility, as proxied by SELF-DECLARED HEALTH, seems to be influenced by expectations.
4.
I
NTERPRETATION.
P
ROGRESSION ANDS
ISYPHUSThis set of results suggests the following conclusions: Remembered and expected events exert an important impact on current experienced utility. They influence Life Satisfaction as well as self-assessed Health. Declared Life Satisfaction thus expresses moment-utility, which according to Kahneman (2003) is best suited for constructing a measure of objective happiness.
4.1 Sisyphus
Ceteris paribus, people are happier when they observe or expect a positive change. As put by Camerer and Loewenstein (2004): “A majority of subjects prefer sequences that improve over
time. Preferences for improvement appear to be driven in part by savouring and dread, and in part by adaptation and loss-aversion”. This is because “improving sequences allow decision makers to savour the best outcomes under the end of the sequence. With losses, getting undesirable outcomes over with quickly eliminates dread. Adaptation leads to a preference for improving sequences because people tend to adapt to ongoing stimuli over time and to
evaluate new stimuli relative to their adaptation level […]. Loss aversion intensifies the preference for improvement over deterioration ”.
This preference for improvement in the context of adaptation is reminding of the legend of Sisyphus. As a punishment inflicted by Zeus, Sisyphus was doomed to push a boulder uphill over and over again, knowing that as soon as the rock would reach the top it would immediately fall back. In a similar way, man seems to be doomed to progress: progressing does not always make him much happier but not doing so would condemn him to an even more cruel fate. Transposed in the field of economics, the idea is that lucid agents rationally enjoy the perspective of a progression in their material situation, be it only because this is the only means to overcome the deleterious work of adaptation.
4.2 Happiness out of illusion?
Another interpretation of the taste for progression could be that agents underestimate adaptation and overestimate their future welfare15, as suggested by Easterlin (2001). Partisans of economic growth could reply that even so, people who strive for money, although they may find out that the increase in their material standard is not as satisfying as expected, may nonetheless have enjoyed the perspective. However, this raises a series of issues. First, how much value can we attach to growth if its welfare effect is due to agents’ misprediction of their future utility? More importantly, when agents acknowledge that their expectations were too high, how much disutility does this generate? To what extent does the ex post disutility of disappointment compensate the flow of anticipatory feelings that was felt ex ante? Conversely, is there a possibility of a double dividend: one from the imagination, one from the realization of the event?
Some answers to these questions are provided by Table 1, which suggests that in spite of adaptation and possible forecasting errors, the net inter-temporal effect of having positive expectations is to increase cumulated happiness. Moreover, the data shows that agents make quite reasonable predictions about their future standard of living. In the fixed effect OLS
15
The literature is rich of examples of mistaken forecasts of future welfare. Loewenstein (1987, 2003) for instance, reports the experience of people whose degree of anxiety about a future surgery operation turns out to be much more intense that the actual pain they actually suffer during the operation.
regression of PAST IMPROVEMENTat period t (How has the financial situation of your family
changed in the last 12 months?), the coefficient of EXPECTED IMPROVEMENT at period t-1 (Do
you think that in the next 12 months you and your family will live better than today or worse?)
is positive, important and significant at the 1% level. Hence, the data do not validate the assumption that agents are not lucid about their future prospects, and more precisely that they fail in predicting the way they will appreciate their consumption level in the future.
Finally, the data do not validate the assumption of complete adaptation. To test the extent of adaptation to income, I use the same method as Di Tella, de New and MacCulloch (2005), namely I introduce HOUSEHOLD EXPENDITURE at time t, t-1, t-2 and t-3, in the regression of LIFE SATISFACTION, controlling for the usual socio-demographic variables. I do not find evidence of a strong adaptation effect. The coefficients on the lagged variables are not significant. Hence, the data do not support the assumption of a strong, and a fortiori complete, adaptation.
In summary, expectations are not completely misled; they are consistent with agents’ ex post evaluation of their situation, which in turn influences Life Satisfaction. One can conclude that agents are not completely mistaken when they rejoice at the prospect of a future improvement in their living standard. Their anticipatory feelings are not totally compensated by an ex post dissatisfaction.
4.3 A built-in disposition?
Camerer and Loewenstein (2004) go as far as claiming that “people have a “gestalt” notion of
an ideal distribution of outcomes in time”, which means that trying to progress is something
like a built-in mechanism, a basic instinct. This observation finds an echo in the psychological corpus, in particular the so-called tellic theories.
Firstly, having aspirations as such is recognized as being good for one’s happiness. “Dispositional optimism” for instance, i.e. “one’s characteristic thoughts about the future”, is considered by many psychologists as a correlate of happiness (Diener et al., 1999). Cantor and Sanderson (quoted by Diener et al., 1999, p 284) note that “having goals provides a sense of
personal agency and a sense of structure and meaning to daily life”. Emmons (1986) reports
that “positive affect and a higher life satisfaction are associated with past fulfilment of goals
and with having valued goals, independent of past success”. Pomerantz et al. (quoted by
important have higher life satisfaction, self-esteem and positive affect”. As a contraposée, not
trying to progress, not having aspirations is often considered by psychologists as a sign of depression or illness.
Secondly, the mere fact of moving towards one’s goals is also recognized as a source of well-being. Michalos (1985) notes that “the process of moving towards one’s aspirations may be
more important to well-being than the end-state of goal attainment. Thus people with high aspirations and low current outcomes may be satisfied as long as they are making adequate progress towards their goal”. According to Emmons (1986), “happiness results more from the pursuit of a goal than from the attainment of a goal”.
Some authors attribute these observations to anthropologic considerations. They see the attempt to progress as a built-in mechanism specific to humanity. Frank and Hutchens (2004, p 555) for instance, note that the biological model of human nervous system creates the condition of sensitivity to change and deviation rather than to level. It is also tempting to look at the improvement instinct as a feature selected by evolution16.
Lastly, a philosophical interpretation is a more optimistic version of Sisyphus: Descartes thought that self-esteem is the basis of happiness. Conformingly, progressing, while as painstaking as pushing Sisyphus’ boulder, would make man happy by generating self-esteem, or the pleasure that derives from contemplating a valuable goal.
5.
C
ONCLUSION:
BACK TO THEE
ASTERLIN PARADOXThis paper has illustrated the existence of anticipatory feelings and the preference for improving sequences of consumption. Raising the incomes of all may not increase the happiness of all, but expecting a financial improvement seems to be a motive of well-being
per se, beyond the obvious effect of consumption smoothing.
To be sure, this pro-growth argument may not be decisive; in particular it does not take into account the negative externalities of growth. Similar effects could also probably be evidenced
16 Of course, it could be argued that evolutionism is based on competition, and that it is competition that forces
individuals to progress, in spite of their preference for leisure. But then the question has to be addressed why people engage into competition.
in other domains and it would be interesting to compare the relative impact of material improvement versus progress in other fields.
However, unveiling the role of expectations contributes to shed light on the Easterlin paradox. There seem to be several channels relating income growth and well-being (Clark and Senik, 2007). The first most obvious one is of course the direct positive effect of consumption. The second and third negative channels are social comparisons and adaptation. Lastly, the fourth channel is the positive impact of expectations.
The net effect of these four channels may turn out to be deceptively small if these effects more or less compensate each other. This would explain the Easterlin paradox. Hence, before concluding that income growth does not make people happy, it is worthwhile decomposing the general relation between GDP growth and Life Satisfaction, especially if the relative effect of these channels depends on the macroeconomic and institutional features of the economy.
An assumption to explore is indeed that the positive welfare impact of expectations is higher in certain contexts. Senik (2004, 2007) showed that expected income based on the observation of one’s professional peers has a particularly strong welfare impact in more mobile and uncertain economies (e.g. Transition countries). The current paper extends this result to expected income in general. It recalls that growth is one of the important ingredients of national welfare.
R
EFERENCES- Becker, G., and Murphy, K., 1988. A Theory of Rational Addiction. Journal of Political Economy 96(4), 675-700.
- Berns, G., Chappelow, J., Cekic, M., Zink, C., Pagnoni, G., and Martin-Skurski, M., 2006. Neurobiological Substrates of Dread. Science 312, 754-758.
- Blanchflower, D., and Oswald, A., 2004. Well-Being over Time in Britain and the USA. Journal of Public Economics 88, 1359-1386.
- Brocas, I., and Carillo, J., 2003. The Psychology of Economics Decisions, Volume 1: Rationality and Well-Being Oxford University Press.
- Brocas, I., and Carillo, J., 2004. The Psychology of Economics Decisions, Volume 2: Reasons and Choices. Oxford University Press.
- Brocas, I., Carillo, J., and Dewatripont, 2004. M., Commitment Devices under Self-Control Problems: an Overview. In Brocas I. and Carillo J., eds, 2004, op.cit., pp 49-66. - Browning, M., and Collado, D., 2001. The Responses of Expenditures to Anticipated
Income Changes: Panel Data Estimates. American Economic Review 91(3).
- Camerer, C., and Loewenstein, G., 2004. Behavioural Economics: Past, Present, Future. In Camerer C., Loewenstein G. and Rabin M., eds, 2004, op.cit., pp 3-52.
- Camerer, C., Loewenstein, G., and Prelec, D., Neuroeconomics: How Neuroscience can Inform Economics. Journal of Economic Literature forthcoming.
- Camerer, C., Loewenstein, G., and Rabin, M., 2004. Advances in Behavioral Economics. Princeton University Press and Russell Sage Foundation.
- Caplin, and A., Leahy, J., 2003, Behavioural Policy. In Brocas I. and Carillo J., eds. 2003, op.cit.
- Caplin, A., and Leahy, J., 2001. Psychological expected utility and anticipatory feelings. Quarterly Journal of Economics CXVI (1), 55-80.
- Clark, A., Diener, E., Georgellis, Y., and Lucas, R., 2003. Lags and Leads in Life Satisfaction: a Test of the Baseline Hypothesis. PSE. Mimeo.
- Di Tella, R., Haisken de New, J., and MacCulloch, R., 2005. Adaptation to Income and to Status in Individual Panel. Harvard Business School. Mimeo.
- Diener, E., and Lucas, R., 2000. Explaining differences in societal levels of happiness: relative standards, need fulfillment, culture, and evaluation theory. Journal of Happiness Studies 1, 47-78.
- Diener, E., Eunkook, M. Suh., Richard, L., and Heidi, L. Smith., 1999. Subjective Well-Being : Three Decades of Progress. Psychologic Bulletin 125(2) 276-302.
- Easterlin, R. A., 1974. Does economic growth improve the human lot ? Some empirical evidence. In P.A. David et M.W. Reder Nations and households in economic growth. New-York, Academic Press. p 89-125.
- Easterlin, R. A., 1995. Will raising the incomes of all increase the happiness of all?. Journal of Economic Behaviour and Organization. 27, 35-47.
- Easterlin, R. A., 2001. Income and Happiness: Towards a Unified Theory. The Economic Journal 111, 465-484.
- Easterlin, R. A., 2003. Explaining Happiness. PNAS. 100(19).
- Eggers, A., Graham, C., and Sukhtankar, S., 2004. Does Happiness Pay? An Exploration Based on Panel Data from Russia. Journal of Economic Behavior and Organization 56(3). - Elster, J., and Loewenstein, G., 1992. Utility from memory and anticipation. In J. Elster
and G. Loewenstein Choice over Time. New York: Russell Sage Foundation. pp. 213-234.
- Emmons, R., 1986. Personal Strivings: An Approach to Personality and Subjective Well-Being. Journal of Personality and Social Psychology 51, 1058-68.
- Ferrer-i-Carbonnell, A., and Frijters, P., 2004. How Important is Methodology for the Estimates of the Determinants of Happiness ?. Economic Journal 114: 641:659.
- Frank, R., and Hutchens, R., 2004. Wages, Seniority and the Demand for Rising Consumption Profiles. In Camerer C., Loewenstein G. and Rabin M. eds, 2004, , op.cit. 548-571.
- Frederick, S., Loewenstein, G., and O’Donoghue, T., 2002. Time Discounting and Time Preference: a Critical Review. Journal of Economic Literature 40, 351-401.
- Frey, B., and Stutzer, A., 2002. What Can Economists Learn from Happiness Research ?. Journal of Economic Literature XL(2), 402-35.
- Graham, L., and Oswald, A., 2006. Hedonic Capital. University of Warwick. Mimeo. - Helson, H., 1947. Adaptation-Level as a Frame of Reference for Prediction of
Psychophysical Data. American Journal of Psychology 60, 1-29.
- Kahneman, D., 2003. Experienced Utility and Objective Happiness: A Moment-Based Approach. In Brocas I. and Carillo J. eds, 2003, op.cit. pp 187-208.
- Kahneman, D., Wakker, P., and Sarin, R., 1997. Back to Bentham? Explorations of Experienced Utility. Quarterly Journal of Economics.
- Köszegi, B., 2005. Utility from Anticipation and Personal Equilibrium. University of California, Berkely. Mimeo.
- Loewenstein, G., and Prelec, D., 1991. Negative Time Preferences. American Economic Review, Papers and Proceedings. 82(2), 347-352.
- Loewenstein, G., and Sicherman, N., 1991. Do Workers Prefer Increasing Wage Profiles?. Journal of Labour Economics. 9(1), 67-84.
- Loewenstein, G., 1987. Anticipation and the Valuation of Delayed Consumption. Economic Journal. 97(387), 664-684.
- Loewenstein, G., 2006. The Pleasures and Pains of Information. Science. 312, 704-706. - Loewenstein, G., Read, D., and Baumeister, R., eds. 2003. Time and Decision. Russell
- Mellers, B., and McGraw, P., 2004. Self-Serving Beliefs and the Pleasures of Outcomes. In Brocas I. and Carillo J. 2004, , op.cit. pp31-48.
- Palacios-Huerta, I., 2004. Consistent Intertemporal Decision-Making through Memory and Anticipation. In Brocas I. and Carillo J. 2004, op.cit. pp 67-80.
- Senik, C., 2004. When Information Dominates Comparison. Learning from Russian Subjective Panel Data. Journal of Public Economics 88 (9-10), 2099-2133.
- Stutzer, A., 2004. The role of Income Aspirations in Individual Happiness. Journal of Economic Behavior and Organization 54, 89-109.
- Van Praag, B., and Ferrer-i-Carbonnell, A., 2004. Happiness Quantified. Oxford University Press.
- Van Praag, B., 1971. The Welfare Function of Income: an Empirical Investigation. European Economic Review 2, 337-69.
A
PPENDIX.
Descriptive Statistics
Source RLMS rounds 5 to 13 (1994-2004), population from 18 to 65 years old.
LIFE SATISFACTION. To what extent are you satisfied with your life in general at the present time?
LIFE SATISFACTION 1994 1995 1996 1998 2000 2001 2002 2003 2004 Total
Not at all satisfied 576 759 873 1071 661 504 365 410 368 5587
Less than satisfied 1153 1029 1006 978 1114 1094 895 1016 911 9196
Both yes and no 525 540 538 482 602 656 707 645 714 5409
Rather satisfied 244 203 200 214 324 447 695 616 725 3668
Fully satisfied 76 80 48 45 76 86 139 112 74 736
Total 2574 2611 2665 279 2777 2787 2801 2799 2792 24596
PAST IMPROVEMENT. Tell me, please: How has the financial situation of your family changed in the last 12
months?
PAST IMPROVEMENT 2001 2002 2003 2004 Total
Greatly worsened 239 179 177 194 789
Slightly worsened 427 400 395 413 1635
Has not changed 1495 1521 1592 1633 6241
Slightly improved 564 611 575 475 2225
Greatly improved 62 79 35 54 230
Total 2787 279 2774 2769 1112
EXPECTED IMPROVEMENT. Do you think that in the next 12 months you and your family will live better than
today or worse?
EXPECTED IMPROVEMENT 1994 1995 1996 1998 2000 2001 2002 2003 2004 Total
You will live much worse 595 593 573 748 233 143 119 111 138 3253
You will live somewhat worse 597 533 507 548 355 279 293 300 332 3744
Nothing will change 894 949 1006 797 1249 1411 1475 1413 1438 10632
You will live somewhat better 293 249 247 209 397 485 479 458 411 3228
You will live much better 45 45 33 33 54 53 70 36 68 437
HEALTH. Tell me, please: How would you evaluate your health? It is:
HEALTH 1994 1995 1996 1998 2000 2001 2002 2003 2004 Total
Very bad 52 37 32 51 73 66 67 68 95 541
Bad 375 373 391 409 414 448 465 514 491 388
Average, not good, but not bad 1697 1589 1584 1608 1658 169 1653 1626 1607 14712
Good 643 762 761 663 602 574 581 564 577 5727
Very good 35 31 33 66 53 26 36 27 23 330
Total 2802 2792 2801 2797 28 2804 2802 2799 2793 2519
TOTAL REAL EXPENDITURE OF THE HOUSEHOLD
Year 1994 1995 1996 1998 2000 2001 2002 2003 2004
Mean 10356 8757 7722 5749 6830 7752 7622 8620 8342
Standard deviation 8930 8800 8316 5914 7879 7734 6834 13291 8528
CUMULATED SUBJECTIVE VARIABLES BY BLOCKS OF YEARS
Obs. Mean Std, Dev. Min Max
1994-1996
Number of periods with objective income rise 8424 0,77 0,61 0 2
Number of periods with expectations of improvement 8424 0,32 0,66 0 3
Number of periods with expectations of stability 8424 1,01 0,94 0 3
Number of periods with expectations of stability 8424 1,21 1,05 0 3
Cumulated Life Satisfaction score 8424 6,05 2,61 0 15
1998-2001
Number of periods with objective income rise 8424 1,64 0,70 0 3
Number of periods with expectations of improvement 8424 0,44 0,74 0 3
Number of periods with expectations of stability 8424 1,23 0,94 0 3
Number of periods with expectations of stability 8424 0,82 0,87 0 3
Cumulated Life Satisfaction score 8424 6,70 2,37 0 15
2002-2004
Number of periods with objective income rise 8424 1,79 0,69 0 3
Number of periods with expectations of improvement 8424 0,54 0,85 0 3
Number of periods with expectations of stability 8424 1,54 1,02 0 3
Number of periods with expectations of stability 8424 0,46 0,78 0 3
Table A1. Happiness and Subjective Past Evolution Fixed Effects OLS of CUMULATED LIFE SATISFACTION
-1 -2 -3
LOG TOTAL EXPENDITURE 0,146*** -0,627*** 0,084** [0,019] [0,047] [0,040]
NB PERIODS WITH FEELING OF PAST IMPROVEMENT 0,528***
[0,048] NB PERIODS WITH FEELING OF PAST DETERIORATION -0,627***
[0,047]
NB PERIODS WITH FEELING OF PAST STABILITY 0,084**
[0,040]
Observations 8214 8214 8214
Number of persons 2808 2808 2808
R-squared 0,247 0,254 0,23
log likelihood -14572 -14530 -14661
Controls: age, age square, number of children, working status, marital status, time dummies.
Regression of CUMULATED LIFE SATISFACTION scores of the periods 1994-1996, 1998-2001 and 2002-2004 over
CUMULATED EXPENDITURE and CUMULATED INDICATORS OF PAST CHANGE in the same periods and other controls taken at the last year of each block (1996, 2001, 2004).
* significant at 10%, ** significant at 5%, *** significant at 1%.
Table A2. Health and Subjective Past Evolution Fixed Effects OLS of CUMULATED SUBJECTIVE HEALTH
-1 -2 -3
LOG TOTAL EXPENDITURE 0 0,005 0
[0,011] [0,011] [0,011] NB PERIODS WITH FEELING OF PAST IMPROVEMENT 0,123***
[0,028]
NB PERIODS WITH FEELING OF PAST DETERIORATION 0,022 [0,023]
NB PERIODS WITH FEELING OF PAST STABILITY -0,140***
[0,027] Observations 8214 8214 8214 Number of persons 2808 2808 2808 R-squared 0,048 0,044 0,049 log likelihood -10134 -10148 -10129 Controls: age, age square, number of children, working status, marital status, time dummies.
Regression of CUMULATED HEATH SCORES of the periods 1994-1996, 1998-2001 and 2002-2004 over CUMULATED EXPENDITURE and CUMULATED INDICATORS OF PAST CHANGE in the same periods and other controls taken at the last year of each block (1996, 2001, 2004).
T
ABLE OF CONTENTSAbstract ... 1
1. Introduction ... 2
1.1 Why isn’t it trivial? ... 4
1.2 Why does it matter? ... 5
1.3 Existing empirical evidence ... 6
2. Data and empirical strategy ... 8
2.1 Subjective variables as proxies for welfare... 8
2.2 Empirical strategy ... 9
3. Results ... 12
3.1 The importance of progressing ... 12
3.2 Health and expected improvement ... 16
3.3 Ruling out the “omitted variable” interpretation ... 18
4. Interpretation. Progression and Sisyphus ... 21
4.1 Sisyphus... 21
4.2 Happiness out of illusion?... 22
4.3 A built-in disposition?... 23
5. Conclusion: back to the Easterlin paradox... 24
References... 26
Appendix. ... 30
Descriptive Statistics ... 30