HAL Id: insu-02899069
https://hal-insu.archives-ouvertes.fr/insu-02899069
Submitted on 14 Jul 2020HAL is a multi-disciplinary open access archive for the deposit and dissemination of sci-entific research documents, whether they are pub-lished or not. The documents may come from teaching and research institutions in France or abroad, or from public or private research centers.
L’archive ouverte pluridisciplinaire HAL, est destinée au dépôt et à la diffusion de documents scientifiques de niveau recherche, publiés ou non, émanant des établissements d’enseignement et de recherche français ou étrangers, des laboratoires publics ou privés.
To cite this version:
Gérard Ancellet, François Ravetta, Jacques Pelon, Andrea Pazmino, Amélie Klein, et al.. Ozone Lidar Observations in the City of Paris: Seasonal Variability and Role of The Nocturnal Low Level Jet. EPJ Web of Conferences, EDP Sciences, 2020, The 29th International Laser Radar Conference (ILRC 29), 237, pp.03022. �10.1051/epjconf/202023703022�. �insu-02899069�
O
ZONE LIDAROBSERVATIONSINTHE CITYOF
P
ARIS:
SEASONAL VARIABILITY ANDROLE OF THE NOCTURNALLOW LEVELJET
Gérard Ancellet1*, François Ravetta1,Jacques Pelon1, Andrea Pazmino1 , Amélie Klein1, Elsa
Dieudonné2, Patrick Augustin2, Hervé Delbarre2
1 Laboratoire Atmosphere Milieux, Observations Spatiales (LATMOS), CNRS-INSU, Sorbonne
Université,Université Versailles St Quentin, Paris, France
2LPCA Université du Littoral-Côte d’Opale, Dunkerque, France
*Email: gerard.ancellet@latmos.ipsl.fr
ABSTRACT
Ozone lidar measurements have been carried out in Paris during 4 years to characterize the seasonal variability of the vertical gradient within the urban planetary boundary layer (PBL). The interaction between NOx emission and thermal stability of the
PBL is the main driver of the winter strong positive O3 gradient, while summer neutral
gradient is related to weaker thermal stability and photochemical ozone production at the regional scale. Simultaneous lidar measurements of ozone and wind vertical profiles during 36 hours in September 2014 also show that the nocturnal low level jet (NLLJ) plays a significant role in the early morning ozone increase.
1. INTRODUCTION
Understanding the behavior of ozone in the urban boundary layer is necessary to develop effective air pollution control strategies in cities throughout the world. A key uncertainty in understanding ground level ozone is knowledge of the role of vertical and regional transport processes in controlling ozone and ozone precursors mixing and dispersion Chemical and physical processes at night and during transitions (night-to-day and day-to-night) as well as lack of vertically resolved measurements limit our ability to forecast “next-day” ozone concentrations [1].
2. METHODOLOGY AND EXPERIMENTAL SETUP
2.1 Objectives and methodology
Assessment of the UV DIAL lidar observations to improve our knowledge of ozone transport and photochemistry in the urban boundary layer was made using (1) regular measurements of the O3
vertical profile between 0.3km and 3km (4-8 times per month) in Paris city center to characterize the seasonal evolution of ozone vertical gradient within and above the urban planetary boundary layer (PBL) (2) continuous observations of O3 and wind vertical profiles and of PBL height during 48 hours. The seasonal cycle was studied using lidar measurements averaged over 1hour during daytime and with partial clear sky conditions up to 3km altitude. Such measurements are available during 4 years (2011-2014) with 4-8 profiles per month [2]. Regarding the analysis of the O3 vertical profile diurnal cycle, a specific campaign was held in Paris in September 2014 [3].
2.2 The ozone lidar observations
The ozone Differential Absorption Lidar (DIAL) instrument is an airborne lidar system [4,5] in-stalled in a shelter at Sorbonne Université (SU) in the frame of the QUALAIR facility. The transmit-ter module is based on a solid state Nd-YAG laser and Stimulated Raman Scattering in deuterium to generate 3 wavelengths (266, 289, and 316nm). The wavelength pair 266-289nm is used for the ranges between 0.4km and 1.7km, while measure-ments with the pair 289-316nm provide data above 1.5km only. The Lidar vertical resolution varies from 100m at the 0.4km altitude to 1000m at the 3km altitude. The temporal resolution can be as low as 2 minutes, but only hourly profiles are considered for the analysis of the seasonal variability. In the altitude range 200m to 3000m the Lidar accuracy including the different error sources (signal to noise ratio, Lidar alignment, background signal correction) is of the order of 15µg.m-3. At range below 500m, the DIAL
mea-surement is mainly limited by the geometrical telescope overlap function uncertainty. To further reduce the error on the ozone measurements be-low 500m a new optical receiver has been added
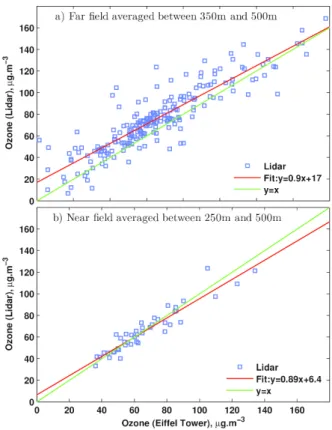
in October 2013 to the Lidar. It includes a 10cm telescope with a 3.3mrd field of view to reach a full overlap near 200m. Measurements are alter-nately made using the large 40cm telescope in the far field from 400m to 3km and using the small near field telescope from 200m to 900m. For the near field measurements, only two wavelengths (266 and 289nm) are necessary because the 266nm Lidar signal is still strong enough below 1km. The correlation between the surface mea-surements at the Eiffel Tower (310m ASL) and the Lidar data averaged between 250m and 500m high have been used to check the Lidar accuracy at 310m. The comparison with the far field ozone Lidar data (Fig.1a) shows a bias of 10µg.m-3 and a 14µg.m-3 standard deviation. When using the near field mode (Fig.1b) the bias is close to zero and the standard deviation is 7µg.m-3.
Fig. 1: Scatter plot of ozone concentrations ured by the Lidar and the Eiffel Tower meas-urements between 2011 and 2014. Top panel shows the Lidar far field (large telescope) aver-aged between 350m and 500m and the bottom panel shows the Lidar near field (small telescope) averaged between 250m and 500m.
2.3 The wind and backscatter lidar data
Wind fields during the September 2014 campaign were measured using an eye safe scanning wind Lidar (Leosphere Windcube WLS 100) operating at 1.54 µm with a repetition rate of 10kHz. The Doppler shift is measured with a heterodyne tech-nique. The wind Lidar was located on the roof of a 60m tower providing wind fields in the range 0.19 to 1.5km with a 50m resolution [6]. The wind li-dar accuracy is of the order of 0.5m.s-1. The
QUALAIR operational eye safe micropulse Lidar emitting at 532nm is also used to monitor the aerosol backscatter profile with a 15m vertical resolution and a 1s time resolution. The PBL height is calculated using the wind variance max-imum during the night and the day-to-night and night-to-day transitions, while during the day the altitude is taken when the variance of the backscatter lidar is maximum [7].
2.4 Surface Data
The Paris air quality network provides O3, NO2
surface concentrations at about 70 stations. Two stations have been selected for our study: first at the top of the Eiffel Tower (275m AGL) and sec-ond at ground level away from direct traffic emis-sion (Paris 13). Temperature lapse rate between the Montsouris station and the top of the Eiffel tower is also used to characterize the atmospheric thermal stability. The tropospheric column of NO2
is measured by SAOZ (Système d'Analyse par Observation Zénithale) instrument. Although SAOZ was developed to monitor NO2 total
col-umns, it can also infer tropospheric columns in the polluted urban PBL [8,9].
3. RESULTS
3.1 The seasonal cycle of the ozone vertical gradient
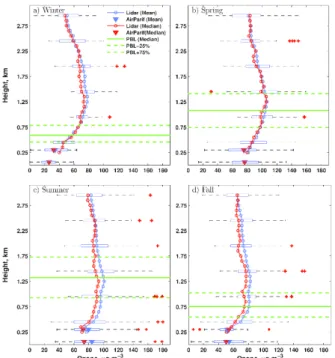
The seasonal average and median of the vertical profiles of ozone measured by the LIDAR between 250m and 3km are shown in Fig.2 for the entire measurement period (2011-2014). The ozone gradients within the PBL are the largest in winter (60µg.m-3.km-1) and fall (40µg.m-3.km-1),
while it is minimum in spring (27µg.m-3.km-1) and
summer (20µg.m-3.km-1). The positive gradients
are still visible using the quartiles, meaning that the result is robust. The seasonal variability of the
O3 gradients in the urban layer near the surface
shows a similar pattern when using the surface and Eiffel tower observations, but with lower values 25 and 14µg.m-3.km-1 respectively in winter
fall and less than 1µg.m-3.km-1 in spring and
summer. In winter, the amount of ozone destruction needed to explain an ozone positive gradient of 60µg.m-3.km-1 between 60m and 590m
is of the order of 8mg.m-2, in good agreement with
the winter NO2 column measured by the SAOZ.
Fig. 2 Seasonal variation (a to d) of vertical
pro-files of ozone for the period 2011-2014. Blue (red) curves are the mean (median) of vertical ozone profiles for each season. Blue (red) triangles are the corresponding ozone seasonal mean (median) for in-situ measurements at the surface and at the Eiffel Tower. Whisker boxes limits show the in-terquartile range whereas outliers are showed by red markers. Planetary boundary layers (PBL) heights are represented by a green continuous line while the dashed green lines are for the percentiles 25% and 75%.
For spring and summer, ozone is well-mixed in the first 300m, but there is still a weak positive gradient above 500m. The spring and summer ozone gradients in the upper part of the PBL are however less visible when using the values of the 75th percentile. Considering the seasonal variabil-ity of the thermal gradient, we expect a neutral vertical ozone gradient in the urban layer up to
300m in summer. Considering that the level of NO2 column 6mg.m-2) is still significant in
sum-mer to induce a positive gradient across the PBL, it means that photochemical production at the scale of the Paris area and vertical mixing are strong enough to compensate for this NO2 titration
in summer.
3.1 The role of the nocturnal boundary layer jet on the surface ozone diurnal cycle
A campaign was held in Paris to study the role of the nocturnal low level jet (NLLJ) on the ozone diurnal cycle. Vertical ozone profiles were mea-sured during a 36 hour intensive observation pe-riod (IOP) on 9-10 September 2014.
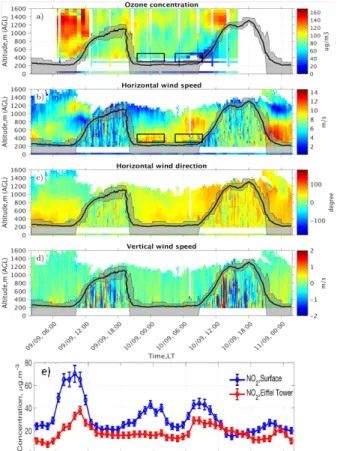
Ozone measurements from the Lidar are com-bined with in-situ measurements at the surface (Paris13) and at the Eiffel Tower (275m AGL) in one ozone contour plot (Fig.3a). Ozone Lidar measurements can be as low as 200m AGL, when using the near field telescope. The PBL height in Fig. 3 is calculated as described in Section 2.3. During the IOP, low nocturnal boundary layer (NBL) heights are observed, with values ~ 250m AGL. Ozone values are vertically homogeneous within the PBL during daytime due to strong ver-tical mixing during daytime as shown by the Doppler lidar vertical wind speeds (Fig. 3d). Ozone values are also larger in the afternoon in good agreement with the peak in the photochemi-cal ozone production from NOx and VOCs emis-sions. During the night, O3 concentrations are
above 100µg.m-3 on 9 Sept., whereas they are as
low as 40µg.m-3 late in the night/early morning on
10 Sept. This feature just above the NBL is co-lo-cated with a NLLJ, (Fig. 3b).The horizontal wind direction and air mass transport modelling (not shown) shows the NLLJ on 10 Sept. 2014 origi-nates from a region with low ozone production northeast of Paris. Potential temperature and O3
gradients have positive values during the night, corresponding to a stable NBL (Fig. 3b). Due to the stable NBL, ozone is trapped close to the sur-face and O3 deposition combined with titration by
NO result in a positive ozone gradient [10]. On 10 Sept.2014, the NBL lapse rate (+5K.km-1) is
how-ever two times lower than the temperature gradi-ent on 9 Sept., which favors vertical transport and mixing of the low ozone layer downwards. The
temporal evolution of NO2 at the surface and the
Eiffel tower (Fig. 3e) also shows that at early morning NO2 gradient (06:00-08:00 LT) is higher
on 9 Sept. than on 10 Sept. while emissions are expected to be the same. Increased vertical trans-port due to the NLLJ between the residual layer (RL) and the NBL is the most likely explanation for the ozone decrease in the RL. Enhanced noc-turnal vertical mixing associated with NLLJs has already been observed in similar cases [1, 11]. The low ozone concentration in the RL has also conse-quences on the next day rate of ozone increase near the surface (Fig. 3a). Indeed the rate of in-crease between 10:30-12:30 LT is only 12µg.m -3.h-1 on 10 Sept. while it is 26µg.m-3.h-1 on 9 Sept.
[3].
Fig. 3:Time evolution on 9 and 10 September of
lidar O3 concentrations (a), of surface O3 (a) and NOx (e) measured at the Eiffel Tower (275m
AGL) and the Paris13 station (5m AGL), of the horizontal lidar wind speed (b) and direction (c), of vertical wind speed (d). Surface wind speed and direction measured at Montsouris are also shown in (b) and (c). The PBL height is shown in black with its uncertainty in grey.
Conclusion and Perspectives.
Our studies shows that regular and continuous ob-servations of ozone and wind profiles in the urban boundary layer are mandatory to account for ozone surface variability. This is why the QUALAIR station (qualair.aero.jussieu.fr) was developed by SU in the center of Paris. The as-similation of ozone vertical profiles, PBL height and wind fields in chemical transport models will improve forecasts of "next-day" ozone pollution. While Doppler lidar, or urban canopy radar [12], are available to meet this goal, a new small size and autonomous UV DIAL lidar is still needed. It is currently under construction at LATMOS, using a diode pumped high repetition rate Nd-YAG laser and hollow core fiber for stimulated scattering.
ACKNOWLEDGEMENTS
This work was supported by SU and the OSU Ecce-TERRA. A. Klein and Elsa Dieudonné thesis were funded by Ministère de l'enseignement supérieur et de la recherche and supported by Ecole normale supérieure de Cachan (ENS Paris-Saclay).
REFERENCES
[1] J.T. Sullivan, et al. Atmospheric Environment 158, 160-171 (2017)
[2] A. Klein, et al. Atmospheric Environment 167, 603-615.(2017)
[3] A. Klein, et al. Atmospheric Environment 197, 92-102 (2019)
[4] G. Ancellet and F. Ravetta Appl. Opt. 37(24), 5509-5521 (1998)
[5] G. Ancellet and F. Ravetta J. Environ. Monit. 5, 47-56 (2003)
[6] I. Veselovskii, et al. Atmos. Chem. Phys 16, 7013-7028 (2016)
[7] L. Menut, et al. Appl. Opt. 38, 945–954 (1999) [8] F. Tack, et al., Atmospheric Measurement Techniques 8~(6), 2417—2435 (2015)
[9] E. Dieudonné, et al. Geophysical Research Letters 40(6), 1247-1251 (2013)
[10]J. Stutz,et al. Journal of Geophysical Re-search: Atmospheres 109(D12), D12306 (2004) [11] S. Kuang et al. Atmospheric Environment 45(33), 6078-6084 (2011)
[12] A. Oude Nijhuis et al. BAMS 99 (11), 2275-2293 (2018).